Science Arts & Métiers (SAM)
is an open access repository that collects the work of Arts et Métiers Institute of Technology researchers and makes it freely available over the web where possible.
This is an author-deposited version published in: https://sam.ensam.eu Handle ID: .http://hdl.handle.net/10985/18855
To cite this version :
Stanisaw STEFANOWSKI, Rémy FRAYSSINHES, Grzegorz PINKOWSKI, Louis DENAUD -Study on the in-process measurements of the surface roughness of Douglas fir green veneers with the use of laser profilometer - European Journal of Wood and Wood Products - Vol. 78, n°3, p.555-564 - 2020
Any correspondence concerning this service should be sent to the repository Administrator : archiveouverte@ensam.eu
Study on the in‑process measurements of the surface roughness
of Douglas fir green veneers with the use of laser profilometer
Stanisław Stefanowski1 · Rémy Frayssinhes2 · Grzegorz Pinkowski1 · Louis Denaud2
Abstract
The presented research concerns the use of a laser profilometer to measure the surface roughness of green Douglas fir heartwood veneers during the peeling process. It investigates the effect of various process parameters on the surface quality. Three experiments were carried out with a single variable factor for each experiment: log centration, soaking temperature and cutting speed. Moreover, the origin of the surface roughness of Douglas fir green veneers was investigated. The study shows that laser profilometer seems to be a useful equipment in online measurement of surface roughness of green veneers. Based on the experiment results it was stated that surface roughness of Douglas fir veneers is characterized by large differ-entiation depending on the location on the veneer. The performed analysis shows that the surface roughness of Douglas fir green veneer could be improved when using relatively high cutting speed, not too high steaming temperature and logs with a centered core. The presented study shows that the laser profilometer can be effectively applied to the measurement and evaluation of green veneers during the peeling process and that there is still an area to develop this methodology.
1 Introduction
Roughness is one of the most frequently used parameters in the analysis of the quality of wood surface. In veneer produc-tion, the surface roughness, beside lathe check occurrence and thickness variation, can be a proper indicator of veneer quality. Roughness of the veneers is important mainly in case of their further processing, especially in production of plywood and LVL. It has been previously stated that sur-face roughness has a significant effect on the gluing abil-ity of veneers, glue consumption, penetration of adhesive into the veneer, and bonding strength of veneer products. Sogutlu (2017) found that the lower the roughness of wood, the lower is the glue consumption. Faust and Rice (1986) reported that adhesive strength is up to 30% higher for veneers with a smooth surface than with a rough surface. DeVallance et al. (2007) tested gluebond quality of Douglas
fir plywood showing that the percent wood failure can be increased by reducing veneer roughness. Neese et al. (2004) conducted similar experiments and noticed the same depend-ence. Improving the quality of veneer surface can be done by conducting additional technological processes such as sanding or veneer densification (Candan et al. 2010; Bekhta et al. 2017), which allow obtaining better veneer properties, among others lower surface roughness (Diouf et al. 2011; Bekhta et al. 2014). However, in industrial process monitor-ing of the surface roughness durmonitor-ing the peelmonitor-ing process and decreasing the roughness to the optimal level by appropriate selection of technological parameters can be necessary to obtain an acceptable surface quality.
The effects of pre-treatment and peeling parameters, such as cutting speed, soaking temperature, soaking time, clearance angle, etc. on the surface quality of veneers are considerable, but still not precisely understood, especially in terms of differentiation in structure and properties of different wood species. Tanritanir et al. (2006) stated that the steaming time has a significant effect on the surface roughness of beech veneers. Dundar et al. (2008b) com-pleted similar experiments and demonstrated that the soak-ing time increased the surface roughness of beech veneers peeled from heartwood. Rohumaa et al. (2016) investigated the effect of the soaking temperature on the surface quality of birch veneers showing that too low soaking temperature
* Louis Denaud
louis.denaud@ensam.eu
1 Department of Woodworking Machinery and Basis
of Machines Construction, Poznan University of Life Sciences, ul. Wojska Polskiego 38/42, 60-627 Poznań, Poland
2 Arts et Metiers Institute of Technology, LABOMAP,
(20 °C) causes high surface roughness of the loose side of veneers. Aydin et al. (2006) carried out research on a similar subject showing that surface roughness of spruce veneers obtained from the log with a temperature of 52 °C was lower than when the log temperature was 32 °C.
In case of Douglas fir, which is a highly heterogenous species (Echols 1973; Vonnet et al. 1985), property selec-tion of soaking and peeling parameters may have a cru-cial influence on the product quality. Corder and Atherton (1963) used air-flow arrangement to measure surface rough-ness of veneers. The authors stated that an increase in the temperature of logs during the peeling process increased the surface roughness of Douglas fir veneers peeled from sapwood, and they reported that the optimal temperature of wood is 60 °C. Dupleix et al. (2013) also noted that soak-ing temperature has an effect on the lathe check distribu-tion and depth. On the other hand, Hecker (1995a) found that the boiling time and the log temperature do not have a significant effect on the surface roughness, but it depends significantly on moisture content of wood during the peeling process. The author also showed that the surface roughness is higher for heartwood than for sapwood, what is directly connected to moisture content. The author used the contact stylus method to measure the surface roughness. However, most of the articles described above concern dry veneers. According to the authors` knowledge, there is no research on the surface roughness of green veneers, mainly because the stylus method of roughness measurement, which is most commonly used, is useless in green veneer evaluation, in particular in the case of continuous measurements.
Generally, methods of surface roughness measurement can be split into two categories: contact and non-contact. Methods from the first category are the most frequently used ones, and they are common in laboratory measurements, in particular for solid wood products (Kilic et al. 2006; Thoma et al. 2015), but also for wood veneers (Tanritanir et al. 2006; Dundar et al. 2008a; Candan et al. 2010; Bekhta et al. 2014). The main weakness of this approach is the contact between the fibers and the stylus, especially for fuzzy surfaces. The second category concerns mainly optical and laser scanning methods (Lundberg and Porankiewicz 1995; Sandak et al.
2004). Previous research, conducted in recent years, showed that these methods have larger potential for the use in wood processing than contact methods, in particular in on-line measurement of the surface roughness in manufacturing lines. A comparison of stylus and optical methods was done by Funck et al. (1993). Sandak and Tanaka (2003) showed that using a laser profilometer to measure roughness allows obtaining proper images of wood surfaces. Therefore, this solution can be applied to monitor and evaluate the surface roughness of veneers during the peeling process. Goli and Sandak (2016) used laser profilometer and optical camera to evaluate and image the surface of machined wood and
proposed a method for automated assessment of the sur-face quality. It is assumed that only an optical measuring system can be relevant to measure online green veneer sur-face roughness, which is required to be able to adapt both steaming temperature and peeling process settings. This is especially true for wood species known to produce fuzzy surfaces due to the Horner effect as Douglas fir does (Mothe
1988). This phenomenon is perfectly described in Thibaut et al. (2016). According to the authors, a bundle of mate-rial is compacted ahead of the tool tip until separation can occur with small cracks above and beneath the cutting direc-tion together with a quick swelling back of the bundle, as in the movement of an accordion. This was called the Horner effect. This phenomenon is occurring because of the low wood density of Douglas fir early wood especially when the logs were previously soaked or steamed.
The aim of this study was to use a laser profilometer to measure the surface roughness of thigh side of green Doug-las fir (Pseudotsuga menziesii) heartwood veneers during the peeling process. The loose side of the veneer is highly influenced by the lathe check phenomenon and both surfaces are sensitive to cutting quality. It was assumed that the thigh side of the veneer was enough to measure the veneer surface quality. The effect of soaking temperature, log centration and cutting speed on green veneer surface roughness was investigated. Moreover, the origin of the surface roughness of Douglas fir veneers was analyzed.
This species represents a great potential to produce ply-wood or LVL panels in France. According to the authors` best knowledge, even if Douglas fir is one of the most peeled species in the world, there is no objective characterization of veneers by optical measurements.
2 Materials and methods
2.1 Peeling process
Green Douglas fir logs (Pseudotsuga menziesii) were sawn into six 800 mm length logs. Prior to peeling, all logs were soaked for 48 h in hot water to insure reaching 60 °C at the log’s core. Veneers were produced in LaBoMaP (ENSAM, Cluny, France) by a rotary peeling process using SEM S500 instrumented peeling machine.
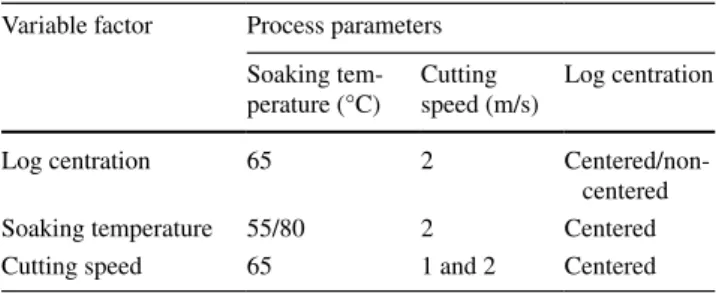
Three experiments were carried out and analyzed sepa-rately, with one variable factor in each experiment: log centration with two logs from Matour (France), soaking temperature with two logs from St Germain la Montagne (France) and cutting speed with two logs from Matour (France). In total, 5 logs were peeled during the study. The peeling process parameters for each experiment are pre-sented in Table 1. The edge angle of the cutting knife was 21° and the clearance angle was in the range of 0°–1°. All
logs were peeled without the angular pressure bar. Accord-ing to previous test, the Horner effect is highly penalizAccord-ing the final veneer quality when using the angular pressure bar since bundles of fibers stay stacked to the tools creating local veneer thickness variation. Veneer thickness was 3 mm in all analyzed cases.
Non-centered log for the first experiment was prepared from a tree with the core located slightly non-centered. The procedure of preparing the log is presented in Fig. 1.
2.2 Surface roughness measurement
Surface roughness of the veneers was measured using LJ-V7080 laser profilometer (Keyence, Itasca, IL, USA). Repeatability in Z-axis was 0.5 μm. The profilometer was installed in the peeling line 85 mm above the moving veneer. Data obtained from the profilometer were filtered to elimi-nate waviness of the profile using the high-pass filter with the cut-off length of 8 mm. This value has been chosen based on ISO 4288 (1996), which says that if Ra is in the range of
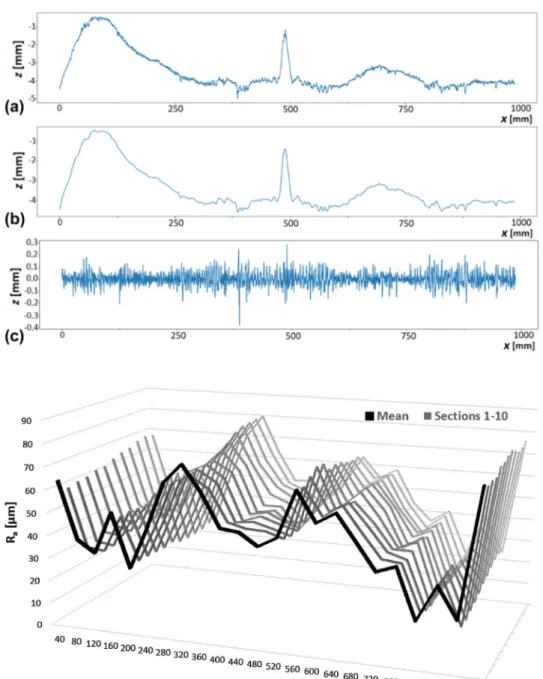
10–80 µm, then the cut off length should be 8 mm. To filter and treat the data, Python with NumPy and Matplotlib pack-ages in PyCharm software (JetBrains, Prague, Czech Repub-lic) was used. An example of filtering results of veneer with a length of 1 m is shown in Fig. 2.
The surface roughness parameters were calculated in accordance with ISO 4287 (1997). The arithmetic mean surface roughness (Ra) and the maximum height of the
profile (Rz) parameters were used. The reason for using these
parameters is that Ra is the most commonly used indicator
in the research on surface roughness of wood (Aydin et al.
2006; Tanritanir et al. 2006; Dundar et al. 2008b; Rohumaa et al. 2016), while Rz parameter allows to analyze the
struc-ture of wood, which contains deep cavities (Csanády and Magoss 2013). Roughness parameters were calculated using the following equations:
The length of the measuring path lm was 40 mm. Z1–5 is the distance between the highest peak and the deepest valley in the elementary section le of the measuring path, which
amounted to 8 mm. Roughness parameters were calculated on 10 lines from the middle part of the measuring section. Then, for each measuring path lm, mean values of Ra and Rz
from 10 measuring lines were calculated, as presented in Fig. 3. Distance between each line was 0.1 mm, so 1 mm width area was analyzed.
The calculation of the mean values from 10 middle sec-tions of the measuring area helps getting representative information about the surface, which is mainly constituted of tracheids perpendicular to the measuring direction (see Fig. 5). Variability of the roughness is considerably higher in the measuring direction (veneer length in Fig. 3). However, the longitudinal variability may also affect the final results of the surface roughness. Figure 4 presents the roughness meas-urements of a 1 m veneer length. Each point on the graph represents Ra on the measuring path lm (40 mm), obtained
from the 10 middle sections of the profile in accordance with the method described above. The presented standard deviation represents the variability of Ra on each lm from 100
measuring sections, so from 10 mm width part of the veneer. (1) Ra= 1 lm lm ∫ 0 |z(x)| ∗ dx [𝜇m] (2) Rz= 1 5∗ ( Z1+ Z2+ Z3+ Z4+ Z5 ) [𝜇m] Table 1 Parameters of the peeling processes carried out in this study
Variable factor Process parameters Soaking
tem-perature (°C) Cutting speed (m/s) Log centration Log centration 65 2
Centered/non-centered Soaking temperature 55/80 2 Centered Cutting speed 65 1 and 2 Centered
Veneer variability in the grain direction is not negligible. Standard deviation was higher especially when values of Ra
were also high. More precisely, earlywood seems to present the roughest surfaces.
The attempt to evaluate surface roughness of veneers using three dimensional parameters (3D surface map), as proposed by Goli and Sandak (2016) for solid wood machin-ing, seems to be an article-relevant approach.
For each analyzed log, 125 measurements of roughness parameters from the last part of the veneer were analyzed. This part of the veneer was produced with stabilized cutting condi-tions (neither at the beginning nor at the end of the ribbon). In total, 5 m of veneer from each log was analyzed. Analysis was conducted only on the last 5 m of the veneer in order to analyze
only a heartwood and thus avoid the effect of a sapwood on the results, which could perturb interpretation of the experiment.
In order to establish significant dependences between the results, the unequal variance t-test was completed at the sig-nificance level of α = 0.05. Statistical analysis and calculation of statistical indicators was done in Excel software (Microsoft, Redmond, WA, USA).
Fig. 2 An example of filtering results of the surface profile: a unfiltered surface profile (direct profile), b waviness profile of the surface, c roughness profile of the surface
Fig. 3 Sections of the surface roughness measurement with calculated mean line in a band on 1 mm width
3 Results and discussion
3.1 The origin of the surface roughness of Douglas fir green veneers
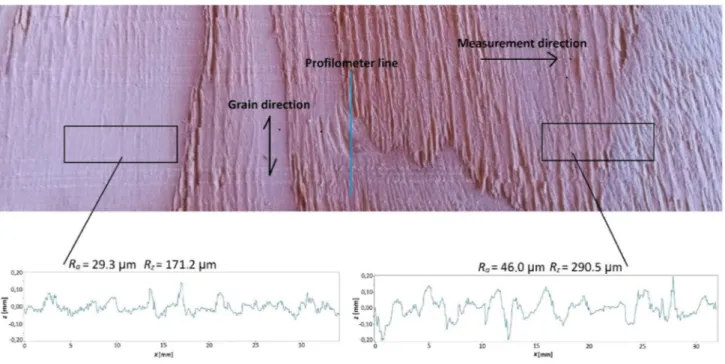
The surface roughness of Douglas fir green veneers peeled from heartwood is characterized by high variability. In some parts of the veneer, the surface is very wavy and
consisted of regular high peaks and deep cavities, which occurred most often in earlywood. This phenomenon can be seen on the image of the surface in Fig. 5. In the earlywood part, the surface is rough and big differ-ences between the highest and the deepest points exist. The opposite dependence occurs in latewood, where the surface is smooth and roughness parameters are lower by over 50%.
Fig. 4 Results of Ra
measure-ment on one veneer. Each point represents mean from 10 measuring sections and standard deviation shows variability of 100 measuring sections
The presented image shows that the structure of the sur-face and values of roughness parameters may be consider-ably different for different areas of the veneer. The explana-tion of this feature is a different structure and properties of early- and latewood, such as density and structure of cells.
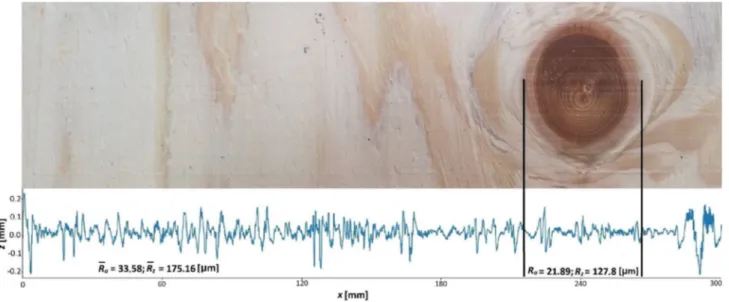
Another element of wood characteristics affecting the surface roughness of veneers are knots. Generally, knots decrease the quality of veneers, because they cause dete-rioration in mechanical properties of veneer-based boards, such as LVL and plywood. They also have a negative effect on the product aesthetics. Therefore, they are not desirable in veneer manufacturing. In case of the surface roughness, knots may have various effects, depending on their type. The intergrown knots may decrease the surface roughness, because of their higher density. An example of such case is shown in Fig. 6. However, except for intergrown knots, there are other types, for example, encased or decayed knots, which may negatively affect the surface roughness and decrease the quality.
3.2 The effect of process parameters on the surface roughness of green veneers
Table 2 contains statistical indicators of Ra and Rz
param-eters for centered and non-centered logs. Significant varia-tion of indicators can be observed for each parameter (from 36 to 43%), which could be attributed to the heterogeneous structure of Douglas fir. It has been previously reported that factors such as ring widths, density of earlywood and late-wood and specific cell structure have an effect on the surface roughness (Mothe et al. 1992; Sachsse and Roffael 1993; Hecker 1995b). The surface roughness and variation of the
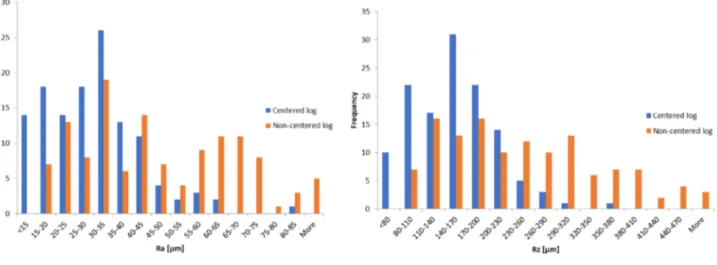
results are higher for non-centered logs than for centered logs, which can be explained by a different ring arrangement in the non-centered log and thus different distribution of late- and earlywood. Both calculated roughness parameters for the non-centered log are higher by approximately 55% than the ones of centered logs. It was decided to present the results using histograms, which give a more precise infor-mation in case of a high number of results. The distribution of the results for centered and non-centered logs is shown in Fig. 7.
As can be seen on the histograms, distributions of the results for both kinds of logs are considerably different. Gen-erally, the results of both analyzed logs are characterized by positive skewness, thus they are right-tailed distributed. However, a non-centered log is characterized by a larger number of high value results, which results in significantly higher mean values of Ra and Rz for this log.
Table 3 presents results of roughness parameters for logs soaked in different temperatures. As before, results
Fig. 6 Roughness profile of intergrown knot compared to regular wood, with calculated roughness parameters of sections before and within the
knot
Table 2 Results of roughness parameters of centered and non-cen-tered logs
Centered log Non-centered log Ra Rz Ra Rz Average (µm) 29.8 154.8 46.8 246.1 Standard deviation (µm) 12.5 55.7 19.8 102.7 Variance 156.3 3102.3 393.8 6398.8 Coefficient of variation (%) 42.0 36.0 42.4 41.7 Normalized kurtosis 1.59 0.76 − 0.90 − 0.58 Skewness 0.95 0.58 0.35 0.51
variability is high and amounts up to 49%. Higher rough-ness values were obtained for logs soaked at 80 °C, which is in an agreement with Corder and Atherton (1963). It may be caused by "softification" of early wood at high temperature, which can produce the Horner effect (Mothe 1988; Marchal et al. 2009; Thibaut et al. 2016).
Based on Fig. 8, it can be seen that the most frequent val-ues of roughness parameters for analyzed logs are consider-ably different. All distribution parameters are characterized by positive skewness and kurtosis. The distribution of Ra
parameter is close to a normal distribution. It can be noticed that kurtosis for Rz parameter for 55 °C is clearly higher Fig. 7 Distribution of the results of roughness parameters for centered and non-centered logs
Table 3 Results of roughness parameters depending on the soaking temperature Soaking temp. 55 °C Soaking temp. 80 °C Ra Rz Ra Rz Average (µm) 38.0 216.9 45.8 250.5 Standard deviation (µm) 14.2 105.2 14.8 80.5 Variance 201.3 11,059.3 220.1 6482.5 Coefficient of variation (%) 37.4 48.5 32.4 32.1 Normalized kurtosis 0.68 4.62 1.60 0.5 Skewness 0.78 1.75 0.83 0.69
compared to other cases, showing that this distribution is leptokurtic. The surface of the veneer peeled from this log was characterized by similar number of high and low values of Rz (distribution is more uniform).
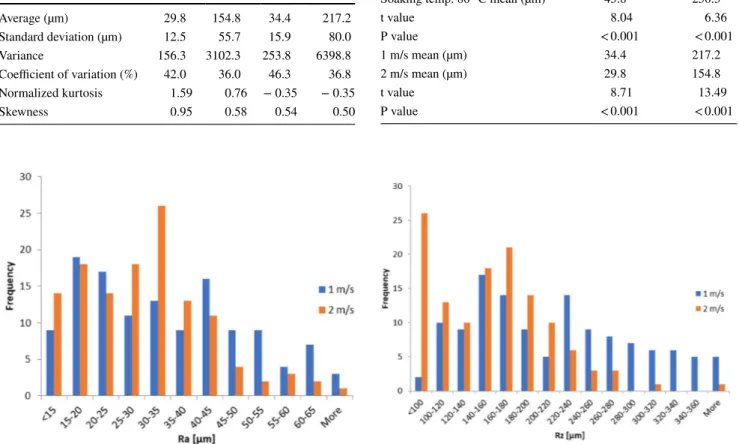
Table 4 presents surface roughness parameters depend-ing on the cuttdepend-ing speed. All the roughness parameters are higher for the cutting speed of 1 m/s. The reason of this feature is that when the cutting speed is too low, cell wall cannot be cut correctly especially on earlywood, and pro-duces the Horner effect (Mothe 1988; Marchal et al 2009; Thibaut et al. 2016). This phenomenon also concerns dif-ferent techniques of wood machining, among others veneer production by slicing (Dundar et al. 2008a). It can be seen on the diagrams in Fig. 9 that results of the cutting speed of 1 m/s are more evenly distributed (especially distribution of Rz results) and characterized by negative kurtosis (− 0.35 for Ra and Rz).
According to the authors conclusions, future research on this subject could be limited to analyze only Rz
param-eter. This approach allows to limit the number of results
and analyze the surface structure more precisely by focusing just on one parameter.
Table 5 contains statistical analysis of results of the sur-face roughness of green heartwood veneers. For both ana-lyzed roughness parameters of all tested samples, average values are significantly different at assumed significance level of α = 0.05.
4 Conclusion
This research shows that in-process optical measurement of the surface roughness carried out with the use of a laser profilometer can be effectively useful in the veneer produc-tion. Laser measurement has the potential to quantify and evaluate surface roughness, which may be a proper indicator
Table 4 Surface roughness parameters depending on the cutting
speed Cutting speed 2 m/s Cutting speed 1 m/s Ra Rz Ra Rz Average (µm) 29.8 154.8 34.4 217.2 Standard deviation (µm) 12.5 55.7 15.9 80.0 Variance 156.3 3102.3 253.8 6398.8 Coefficient of variation (%) 42.0 36.0 46.3 36.8 Normalized kurtosis 1.59 0.76 − 0.35 − 0.35 Skewness 0.95 0.58 0.54 0.50
Fig. 9 Distribution of the results of roughness parameters depending on the cutting speed
Table 5 Statistical analysis of the results of the surface roughness obtained during the study
Ra Rz
Centered log mean (µm) 29.8 154.8 Non-centered log mean (µm) 46.8 246.1
t value 6.25 6.99
P value < 0.001 < 0.001
Soaking temp. 55 °C mean (µm) 38.0 216.9 Soaking temp. 80 °C mean (µm) 45.8 250.5
t value 8.04 6.36 P value < 0.001 < 0.001 1 m/s mean (µm) 34.4 217.2 2 m/s mean (µm) 29.8 154.8 t value 8.71 13.49 P value < 0.001 < 0.001
of green veneer quality. The investigation shows that using a laser profilometer allows finding differences in the surface roughness of green veneers peeled in various conditions. The surface quality of the heartwood veneers is significantly different depending on the parameters of both pre-treatment and peeling processes. It has been found that veneer sur-face roughness is sensitive to soaking temperature. Values of roughness parameter were the lowest when the soaking temperature was 65 °C and the highest when the soaking temperature was 80 °C. More experiments are required in this regard. Peeling of well-centered core log is also favora-ble because irregular distribution of early- and latewood has a negative effect on the surface quality. This configuration (2 m/s, centered, 65 °C) allows obtaining the lowest surface roughness in the range of the conducted experiments.
Moreover, the origin of the surface roughness of Douglas fir veneers was analyzed, including the effect of the structure and properties of wood on the surface roughness. Structure of the surface is very diverse depending on location in the veneer. The surface roughness is considerably higher for ear-lywood than for latewood for Douglas fir, what is connected to higher density and different structure of cells in latewood. For this reason, the results are characterized by high vari-ation, which in some cases amounts up to 50%. Statistical analysis showed that in the range of the conducted experi-ments, the log centration, the soaking temperature and the cutting speed have a significant effect on the surface rough-ness of green Douglas fir veneers peeled from heartwood. Acknowledgements The authors gratefully acknowledge the financial support from the Bourgogne Franche-Comté region, the Ministère de l’Alimentation et de l’Agriculture Francais and the Xylomat Techni-cal Platform from the Xylomat Scientific Network funded by ANR-10-EQPX-16 XYLOFOREST. The study was done during Eras-mus + internship for PhD students.
Compliance with ethical standards
Conflict of interest On behalf of all authors, the corresponding author states that there is no conflict of interest.
References
Aydin I, Colakoglu G, Hiziroglu S (2006) Surface characteristics of spruce veneers and shear strength of plywood as a function of log temperature in peeling process. Int J Solids Struct 43:6140–6147 Bekhta P, Proszyk S, Krystofiak T, Mamonova M, Pinkowski G, Lis
B (2014) Effect of thermomechanical densification on surface roughness of wood veneers. Wood Mat Sci Eng 9:233–245 Bekhta P, Proszyk S, Krystofiak T, Sedliacik J, Novak I, Mamonova
M (2017) Effects of short-term thermomechanical densification on the structure and properties of wood veneers. Wood Mat Sci Eng 12:40–54
Csanády E, Magoss E (2013) Mechanics of wood machining, 2nd edn. Springer, Berlin
Candan Z, Hiziroglu S, McDonald AG (2010) Surface quality of ther-mally compressed Douglas fir veneer. Mater Des 31:3574–3577 Corder S E, Atherton G H (1963) Effect of peeling temperatures on Douglas fir veneer. Information circular 18, Forest Research Laboratory, Oregon State University, Corvallis, Oregon, USA DeVallance DB, Funck JW, Reeb JE (2007) Douglas-fir plywood
gluebond quality as influenced by veneer roughness, lathe checks, and annual ring characteristics. For Prod J 57:21–28 Diouf PN, Stevanovic T, Cloutier A, Fang CH, Blanchet P,
Kou-baa A, Mariotti N (2011) Effects of thermo-hygro-mechanical densification on the surface characteristics of trembling aspen and hybrid poplar wood veneers. Appl Surf Sci 257:3558–3564 Dundar T, Akbulut T, Korkut S (2008a) The effects of some man-ufacturing factors on surface roughness of sliced Makore (Tieghemella heckelii Pierre Ex A. Chev.) and rotary-cut beech (Fagus orientalis L.) Veneers. Build Environ 43:469–474 Dundar T, As N, Korkut S, Unsal O (2008b) The effect of
boil-ing time on the surface roughness of rotary-cut veneers from oriental beech (Fagus orientalis L.). J Mater Process Technol 199:119–123
Dupleix A, Denaud LE, Bleron L, Marchal R, Hughes M (2013) The effect of log heating temperature on the peeling process and veneer quality: beech, birch, and spruce case studies. Eur J Wood Prod 71:163–171
Echols RM (1973) Uniformity of wood density assessed from X-rays of increment cores. Wood Sci Technol 7:34–44
Faust TD, Rice JT (1986) Effects of veneer surface roughness on glue-bond quality in southern pine plywood. For Prod J 36:57–62 Funck JW, Forrer JB, Butler DA, Brunner CC, Maristany AG (1993)
Measuring surface roughness on wood: a comparison of laser-scatter and stylus-tracing approaches. Ind Appl Opt Inspect Metrol Sens 1821:173–185
Goli G, Sandak J (2016) Proposal of a new method for the rapid assess-ment of wood machinability and cutting tool performance in peripheral milling. Eur J Wood Prod 74:867–874
Hecker M (1995a) Peeled veneer from Douglas-fir: influence of round wood storage, cooking and peeling temperature on surface rough-ness. In: Proceedings of the 12th International Wood Machining Seminar. Dep. of Wood Science and Technology, Faculty of Agri-culture, Kyoto, pp 92–101
Hecker M (1995b) Die Oberflächen-Rauhigkeit von Messerfurnier und Schälfurnier der Douglasie (Pseudotsuga menziesii (Mirb.) Franco) in Abhängigkeit von Bestandesbehandlung und Furni-ertechnik [The surface roughness of sliced veneer and peeled veneer of Douglas fir (Pseudotsuga menziesii (Mirb.) Franco) depending on stand treatment and veneer technique]. Disserta-tion Forstl. Fak. Univ. Göttingen
ISO 4287 (1997) Geometrical product specifications (GPS)—surface texture: profile method—terms, definitions, and surface texture parameters. International Organization for Standardization, Geneva, Switzerland
ISO 4288 (1996) Geometrical product specifications (GPS)—surface texture: profile method—rules and procedures for the assessment of surface texture. International Organization for Standardization, Geneva
Kilic M, Hiziroglu S, Burdurlu E (2006) Effect of machining on surface roughness of wood. Build Environ 41:1074–1078
Lundberg IÅS, Porankiewicz B (1995) Studies of non-contact methods for roughness measurements on wood surfaces. Holz Roh Werkst 53:309–314
Marchal R, Mothe F, Denaud LE, Thibaut B, Bleron L (2009) Cutting forces in wood machining–Basics and applications in industrial processes. A review COST Action E35 2004–2008: Wood machin-ing–micromechanics and fracture. Holzforschung 63:157–167 Mothe F (1988), Aptitude au déroulage du bois de douglas.
(Douglas fir peeling process ability : Wood heterogeneity effect on veneer quality). Thesis Université Henri Poincaré, Nancy Mothe F, Movassaghi H, Thibaut B (1992) The results of Douglas and
Epicea: some research results. For Enterprise 80:28–36
Neese JL, Reeb JE, Funck JW (2004) Relating traditional surface roughness measures to gluebond quality in plywood. For Prod J 54:67–73
Rohumaa A, Antikainen T, Hunt CG, Frihart CR, Hughes M (2016) The influence of log soaking temperature on surface quality and integrity performance of birch (Betula pendula Roth) veneer. Wood Sci Technol 50:463–474
Sachsse H, Roffael E (1993) Untersuchung der Schälfurner-Eignung von in Deutschland erwachsenem Douglasienholz. [Investigations on the suitability of Douglas fir, grown in germany, for the produc-tion of rotary cut veneer]. Holz Roh- Werkst 51:167–176 Sandak J, Negri M, Tanaka C (2004) Sensors for evaluation of wood
surface smoothness. In: Proceedings of the 2nd international symposium on wood machining. BOKU-University of Natural Resources and Applied Life Sciences, Vienna, pp 343–350 Sandak J, Tanaka C (2003) Evaluation of surface smoothness by
laser displacement sensor 1: Effect of wood species. J Wood Sci 49:305–311
Sogutlu C (2017) Determination of the effect of surface roughness on the bonding strength of wooden materials. BioResources 12:1417–1429. https ://doi.org/10.15376 /biore s.12.1.1417-1429
Tanritanir E, Hiziroglu S, As N (2006) Effect of steaming time on surface roughness of beech veneer. Build Environ 41:1494–1497 Bernard T, Louis D, Robert C, Rémy M, Jacques B, Frédéric M, Pierre-Jean M, Patrick M, Pierre L, Florent E (2016) Wood machining with a focus on french research in the last 50 years. Ann For Sci 73(1):163–184. https ://doi.org/10.1007/s1359 5-015-0460-2
Thoma H, Peri L, Lato E (2015) Evaluation of wood surface rough-ness depending on species characteristics. Maderas-Cienc Tecnol 17:285–292
Vonnet G, Perrin JR, Ferrand JC (1985) Consideration on wood den-sity. Part 4: density and heterogeneity of Douglas fir wood. Holz-forschung 39:273–279
Publisher’s Note Springer Nature remains neutral with regard to