Science Arts & Métiers (SAM)
is an open access repository that collects the work of Arts et Métiers Institute of
Technology researchers and makes it freely available over the web where possible.
This is an author-deposited version published in: https://sam.ensam.eu Handle ID: .http://hdl.handle.net/10985/17002
To cite this version :
Cristopher L. HERNÁNDEZ, Ignacio A. FIGUEROA, Ismeli Alfonso LÓPEZ, Chedly BRAHAM, Patricia CASTILLO, Gonzalo GONZÁLEZ - Microstructure and texture evolution of the Al-20sn alloy processed by equal-channel angular pressing using route C - Materials Transactions - Vol. Volume 56, Issue 1, p.Pages 40-45 - 2014
Any correspondence concerning this service should be sent to the repository Administrator : [email protected]
Microstructure and Texture Evolution of the Al-20Sn Alloy Processed
by Equal-Channel Angular Pressing Using Route C
C. Hernández
1, I. A. Figueroa
1, I. Alfonso
1, C. Braham
2, P. Castillo
3and G. Gonzalez
1,2,+1Instituto de Investigaciones en Materiales, Universidad Nacional Autónoma de México,
Circuito exterior S/N, Cd. Universitaria, A.P. 70-360, Coyoacán, C.P. 04510, Mexico
2Laboratoire Procédés et Ingénierie en Mécanique et Matériaux,
CNRS UMR 8006, ENSAM, 151, bd de Hôpital 75013, Paris, France
3Laboratorio de Microscopía Electrónica, Universidad Autónoma Metropolitana,
Unidad Iztapalapa. San Rafael Atlixco# 186, Col. Vicentina, C.P. 09340, D.F., México
In this work, the microstructure and texture evolution of an Al-20Sn (mass%) alloy processed by Equal Channel Angular Pressing is presented. The evolution of dislocation cells into subgrains and the mechanical response of the deformed alloy have been emphasized. Samples were characterized by transmission electron microscopy, X-ray diffraction (for microstrain and texture measurements) and Vickers microhardness. It was found, that Al grains, suffered the highest degree of deformation during the ECAP process, however, the evidence showed that the deformation was largely heterogeneous, in terms of crystalline domain and feasibly in misorientation angles. The initial copper texture changes throughout the ECAP process forming an incipient shear texture component (111)[11-2]. The heterogeneity of the results obtained from the Vickers microhardness mapping could be associated to the microstructure resulted after the ECAP process.
[doi:10.2320/matertrans.M2014225]
Keywords: aluminum alloys, equal channel angular pressing (ECAP), texture
1. Introduction
Solidification studies of immiscible alloy systems, such as Al-Sn, Al-Pb and Al-Sn-Si are important from both scientific and technical point of view. Immiscible alloy systems are potential candidates for different applications, such as: bearing, superconductors, switch contact material, etc.1) The uniform dispersion that is achieved due to this
property, impacts directly on the mechanical properties and the applications of such alloys.
The growing importance of Al-Sn based alloys for producing self-lubricating bearing materials in automotive industries requires the development of new alloys for improved performance. Although this alloy is well known for that application and there are reports on deformation base on rolling2)or conventional extrusion,3)only few reports are found in the literature related to Al-Sn based alloys processed by Equal Channel Angular Pressing (ECAP).4,5)The ECAP is
a severe plastic deformation (SPD) process that has attracted scientific and, recently, industrial attention because of its effectiveness to produce bulk nanostructured materials with enhanced mechanical properties.6,7) This technique greatly
refines the grain size by accumulating plastic strain into the metal or alloy under study, without changing its cross-sectional shape. The ultrafine-grained materials have shown high strength and moderate ductility.810)
Due to the tribological properties (self-lubrication) of Al-Sn based alloys, it was though that this family of alloys could be a good candidate for the ECAP process. Besides, during the extrusion, Sn could serve as internal (structurally) marker of the ECAP extruded metalflow. For this kind of alloy, we have recently reported the influence of Sn on the micro-structure, microstrain and grain morphology for the
pseudo-binary (with low Si content), Al-xSn (x= 0, 4, 8 mass% Sn) and the binary Al-20Sn alloys, processed by ECAP.2,5)There,
it was found that the formation of subgrains, as the final microstructure, was the result of several ECAP passes. The presence of Sn enhanced the tribological properties of the alloy, but the ECAP capacity for grain refining was reduced. Besides, it was also confirmed that the damping capacity and hardness behaviour were strongly dependent of Sn content.5)
However, when increasing the amount of Sn up to 20 mass%, the residual stresses were relatively low, confirming the effect of Sn as stress reliever. The grain size was refined to a sub-micron scale and a ribbon-like morphology was observed. A marginal increase in the yield strength after thefifth pass was also observed; whilst the ductility remained very similar from 1 to 5 passes.
Based on the above, the objective of this work is to study the evolution of grain refinement throughout the process, focusing on the formation of local misorientation and evolution of subgrains, depending on the ECAP passes. The effect of the process over the grain preferred orientation and microhardness was also assessed.
2. Experimental
2.1 Alloy preparation and extrusion
The alloy Al-20Sn (mass%) was prepared from commer-cial pure elements in an induction furnace followed by air-cooling. As the mixture of Al and Sn forms a simple eutectic in this system, with a very limited solid solution (³0.09 mass% at room temperature), the formation of any inter-mediate phase can be produced. Thus, this system can be considered as a physical mixture (composite) of two phases. The produced ingots were machined into bars of 16 mm© 16 mm© 100 mm, and these bars were processed by ECAP at room temperature. For the ECAP processing, the die set +Corresponding author, E-mail: joseggr@unam.mx
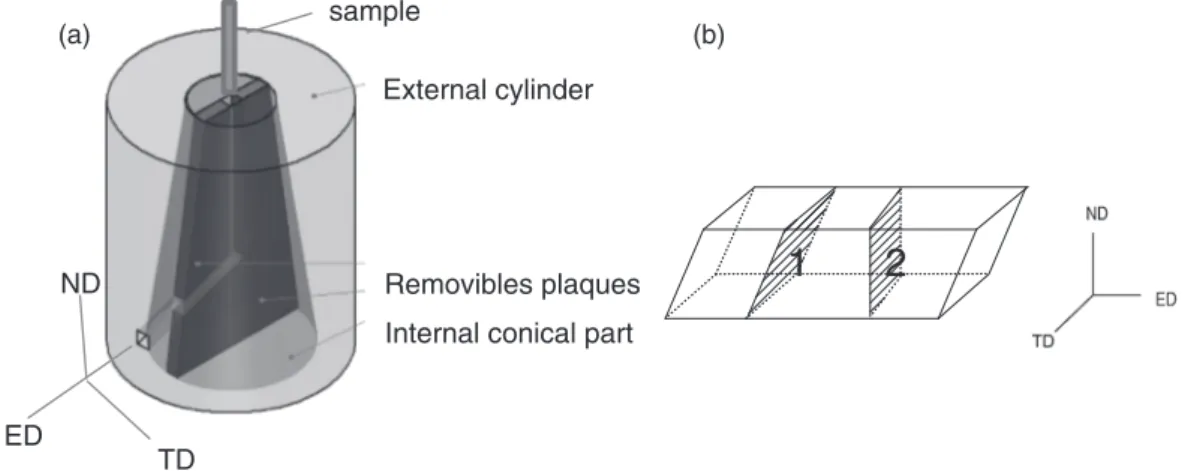
was designed and constructed with an internal angle of the channel,), of 120° and external angle, ¼, of 20°, as shown in Fig. 1(a). For the present set up, the deformation equivalent, ¾ECAP, for one ECAP pass was ¾ECAP= 0.63
and for five passes was ¾ECAP= 3.17. These values were
calculated using the equation proposed by Y. Iwahashi et al.11) The so-called “route C” was used for the process, where the bars are rotated 180° between successive passes or steps of the ECAP. MoS2 was used as lubricant in order to
reduce friction between the sample and walls of the ECAP die set. A hydraulic press of 120 tons was used for this purpose.
According to the bar geometry, three distinctive directions were defined, i.e. ED: extrusion direction, ND: normal direction and TD: transverse direction, as shown in Fig. 1(b). This figure also shows the planes taken for the different characterizations carried out and reported in this work. With the aim of having an equivalent shear plane for such measurements, plane 1 was chosen for the odd ECAP passes (1, 3 and 5) and plane 2 for the even passes (2 and 4). 2.2 X-ray diffraction characterization
The texture analysis of the ECAP-processed Al-20Sn (mass%) alloy samples was carried out with a Ultima IV Rigaku X-ray diffractometer with a cross beam optics (CBO) and CuKa (0.15405 nm), mode in-plane, with range scans¡, 090° and ¢, 0360°. For the post-processing analysis, 3D EXPLORE and MATLAB tool MTEX software applica-tions were used. Since at the in-plane configuration, the defocusing correction is not that significant for alpha values between 0 and 80 degrees, the polefigures studied were not corrected.
The Rietveld refinement was used to evaluate the peak broadening that is normally related to the microstrains that occurs into the grains. For this purpose, a Bruker D8 Advance diffractometer with Cu-K¡ wavelength with a primary K¡2-Ge monochromator and a PSD detector VANTEC 2000 was employed. The peak profile refinement was used to separate the grain size and the microstrain contribution that could affect the peak broadening. The calculations were performed by means of the software “FullProf ” (released 2013), using a pseudo-Voigt
model-TCH to describe the peak profile. The instrumental function was estimated with a standard of LaB6powder.
The details of the calculation that takes into account the crystalline domain size, the microstrain and the intrinsic instrumental effects have been reported previously.4) It is worthy of note that, such effects limit the detection of peak broadening due to grain size and microstrain. For the present XRD configuration, the maximum measured grain size threshold was 100 nm.
2.3 TEM characterization
With the aim of analyzing the dislocation cells at different tilts, Transmission Electron Microscopy TEM analysis was carried out using a JEOL 120EX microscope. High Resolution images related to misorientation of sub-grains generated by the ECAP process were obtained with a JEOL 2100F microscope at 200 kV. It is well known that in route C every ECAP pass reverses the shear direction of the previous one.12) According to that, for this analysis, thin foils taken from plane 1 for odd ECAP passes and plane 2 for the even passes (Fig. 1(b)), were prepared with a focused ion beam apparatus (FIB JEOL JEM-9320).
2.4 Hardness test
In order to analyze the effect of the localized deformation caused by the ECAP process on the hardness, a mapping of the Vickers hardness was done in the whole cross-section area (plane 1). A microhardness tester Shimadzu HMV-2000 with a load of 200 g and 15 s of exposure was used for this purpose. The separation between each indentation was³1 mm and the obtained results were visualized using Mathcad software. 3. Results
3.1 Extrusion
The visible inspection of the extruded samples did not show any visible post-processing defects, such as cracks. However, due to the nature of the process, the original shape of the bar changed to a parallelepiped shaped one. The bottom and top ends of the extruded bar were cut off, after each pass in order to ensure the anvil pressure over a completelyflat surface.
1
2
Removibles plaques Internal conical part External cylinder
(a) sample (b)
ND
ED
TD
Fig. 1 (a) Set up of the ECAP die set, (b) sample geometry, external coordinates and zones where different characterizations were carried out.
3.2 Microstructure characterization
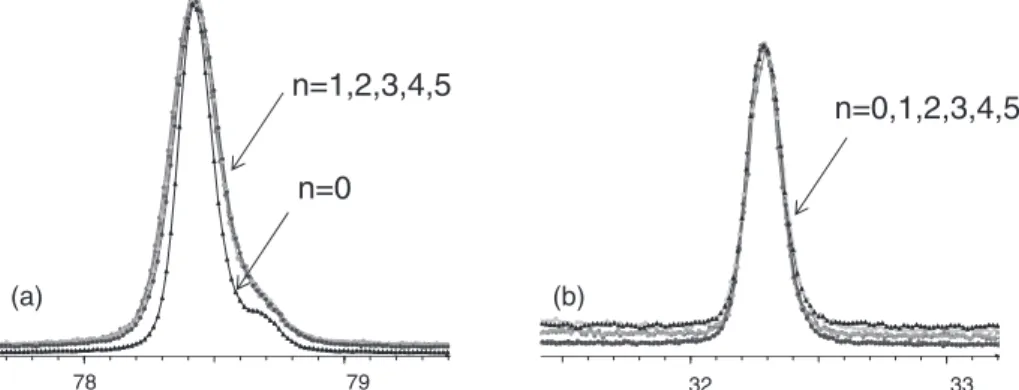
Among the most important internal effects that occur during the ECAP process, the grain refinement and the increase of the micro-strain can be highlighted. As a consequence, the broadening of the XRD peaks is expected. Figure 2(a) shows the plane (311), where the peak broad-ening after thefirst ECAP pass is observed. It is worth noting that the peak broadening effect at passes from n= 1 to 5 is rather marginal, but the effect on the microstructure, as it will be discussed later, is important. On the other hand, Fig. 2(b) shows the (101) plane for Sn. This clearly demonstrates that the width of the Sn XRD peaks does not depend on the number of ECAP passes, since it recrystallizes at room temperature. As the grain size observed by electron mi-croscopy (Fig. 3) exceeds the 100 nm, which, as mentioned above, is the threshold imposed by the instrumental broad-ening, thus the micro-strain was taken as the dominant effect and the contribution of the grain size was not that significant (in terms of reducing the peak width).
The results obtained from the Rietveld analysis, are presented in Table 1. It was observed that the micro-strain increased considerably between 0 and 1 passes but for the subsequent passes remains relatively constant. As expected, the aluminum lattice parameters and therefore peak positions did not change but variation in intensity, due to texture, was observed.
Figure 3 shows the microstructure, observed by TEM, of the planes marked in Fig. 1(b). The microstructure evolved from a coarse grain of several microns for the as-cast condition (Fig. 3(a)), to a more refined grain size with a number of dislocation cells array with different degree of subgrain formation (Fig. 3(b)). Finally, Fig. 3(c) shows that the dislocation cells tended to accommodate in such fashion that new well-defined boundaries were formed, giving place to a subgrain array. The insets of Fig. 3 show the corresponding electron diffraction patterns for the same images. These patterns evolved from a characteristic single crystal pattern to a rings pattern, which reveals the great number of crystallites diffracting.
It is important to mention that, the microstructure is not completely homogeneous and zones with dislocation cells are still observed even at 5 passes, coexisting with zones where large misorientation boundaries exist. In order to illustrate such boundaries, TEM bright field images of these zones are shown in Fig. 4. Here, some dislocation cell zones at different tilt angles obtained after 5 ECAP passes are observed. These dislocation cells are produced by the strain generated by the process itself. The dark areas of Fig. 4 are essentially at the same orientation, therefrom, the misor-ientation of neighboring zones is very low (< 1°). Figure 5 also shows that the misorientation between two adjacent subgrains, having the same zone axis, could be as large as 63
(b) n=0,1,2,3,4,5 (a) n=0 n=1,2,3,4,5 78 79 32 33
Fig. 2 (a) XRD broadening peak of Al (311) as a function of ECAP passes, (b) same effect on Sn (101).
(a) (b) (c)
1
μm
1
μm
1
μm
Fig. 3 TEM images showing the effect of successive passes of ECAP on the microstructure and their corresponding SAD pattern, region selected: 7 µm in diameter. (a) Reference image in the as-cast condition, (b) 1 pass and (c) 4 passes.
degrees (i.e. 2D rotation between the polygons marked with dots in the fast Fourier transform).
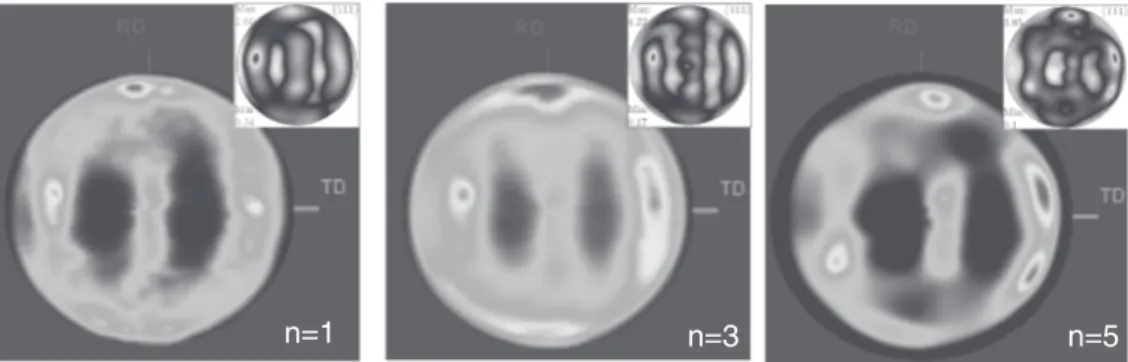
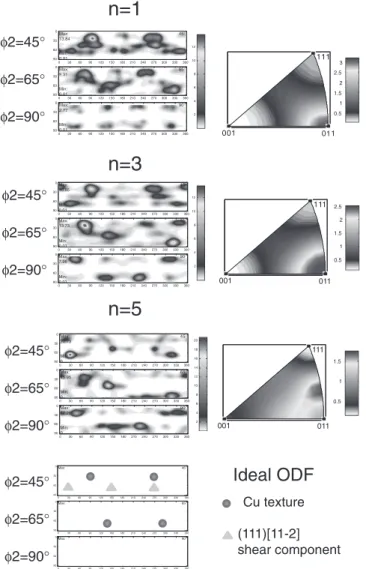
From a statistical point of view, the crystallite orientation can be examined using X-ray polefigures; texture evolution during ECAP process has been studied in the literature and has been indicated as an important factor influencing the mechanical response of the material.1315)The representation of the pole (111) at n= 1, 3, 5 passes is shown in Fig. 6. No pole figure was obtained for n = 0, because the coarse grains existing in the sample provide poor crystallite size statistics. It is important to notice that for route C in ECAP, passes 1,3,5 have an equivalent shear plane, so the odd-pass textures would resemble thefirst-pass texture. A mixture of copper and shear {111}©112ª textures and their respective amount, evolved with the number of ECAP passes, as shown in Fig. 7. Initially the rolling copper texture is predominant, thereafter, a weak shear {111}©112ª texture appears. Inverse poles figures along ND directions are also shown in Fig. 7, they suggest that the crystal [011] and ND directions are parallel for; at least, 3 ECAP passes. However, for the sample processed after 5 passes, the maximum intensity is no longer at the [011] direction, being compatible with the shear {111}©112ª texture and other unidentified minor textures.
From the comparative observation of the ODFs, the continuity can be followed between the texture at n= 1 pass and the final texture at n = 5 passes. Considering the information obtained from TEM, the initial copper rolling texture coexists with the newly formed shear texture, that occurred at n= 5. At the same time, the dislocation cells changed toward sub-grain arrays, forming a heterogeneous
(a)
(b)
(c)
(d)
Fig. 4 TEM images (BF) of some dislocation cells boundaries of a sample subjected to 5 passes with different tilt angles. (a) 0°, (b) 1°, (c) 2° and (d) 3°.
1
2
zone axis [110] zone axis [110] (002) (1-11) (002) (1-11)Fig. 5 HRTEM and FFT of a boundary between two adjacent subgrains.
n=1 n=3 n=5
Fig. 6 Experimental (111) polefigures for n = 1, 3, 5 of ECAP passes, calculated PFs are shown as insert. Table 1 Microstrain, Rs factors and lattice parameters, calculated from
Rieveld refinement as a function of ECAP passes.
¯ = 120° ECAP passes Aluminum refinement 0 1 2 3 4 5 Strain 0.0007 0.0013 0.0013 0.0012 0.0010 0.0013 Bragg R 4.35 4.14 3.90 4.29 3.18 2.10 RF 2.21 2.09 1.96 2.16 1.58 1.06 Lattice parameters (nm) 0.4050 0.4052 0.4051 0.4051 0.4051 0.4051
microstructure. In addition, although further experimental analysis is required to clearly understand the effect of Sn in this process for the alloy in study, the results presented here suggest that this element could have played an important role on the strain heterogeneity that was mentioned above.
It is thought that such heterogeneity could have also influenced the very local mechanical properties. Figure 8 shows a mapping of Vickers microhardness of the samples processed between 1 and 5 ECAP passes. The global microhardness increased as a result of the grain size refinement, although the heterogeneity of those values subsisted even at 5 ECAP passes. Besides the nature of the ECAP process, the heterogeneity of the deformation could also be understood by the contact between the neighboring Al-Al and Al-Sn grain boundaries, during the ECAP process and the subsequent passes. The induced strain on the neighboring Al-Al grains is much higher than that for the pair Al-Sn.
Finally, a plausible explanation of the microstructure heterogeneity presented in this work could also be given in terms of the differences, in strain, produced by the contact between the neighboring Al-Al and Al-Sn grain boundaries, during the ECAP process and the subsequent passes. The induced strain on the neighboring Al-Al grains is much
higher than that for the pair Al-Sn, moreover, the recrystal-lization of Sn at room temperature makes this difference even more pronounced.
4. Conclusions
After the ECAP process the micro-strain of the Al-20%Sn alloy considerably increased between 0 and 1 passes, but for the subsequent passes it remained relatively constant. The microstructure evolved from a coarse grain of several microns to a more refined grain size as the ECAP passes progressed. The dislocation cells tended to accommodate in a way that new grain boundaries were formed, giving place to a subgrain array. A mixture of copper and shear {111}©112ª textures evolved with the number of ECAP passes; to confirm this, the ODFs also showed the continues changes between the texture at n= 1 pass and the final texture at n = 5 passes. The overall microhardness increased as a result of the grain size refinement. The heterogeneity of the obtained micro-hardness values subsisted even at 5 ECAP passes, being compatible with the heterogeneity of the resulting micro-structure.
Acknowledgments
G. Gonzalez would like to thank the funding for the sabbatical year and financial support from CONACYT and PAPIIT through projects No. 166896 and IN110014. Val-uable technical support provided by A. Tejeda, E. Sanchez, J. J. Camacho, C. Flores, O. Novelo, G. Lara, R. Reyes, J. Morales, C. Delgado, J. M. Garcia de León and E. Ortiz are also acknowledged.
REFERENCES
1) L. Ratke and S. Diefenbach:Mater. Sci. Eng. R 15 (1995) 263347.
(a)
(b)
1mm
1mm
Fig. 8 Microhardness mapping (a) 1 ECAP pass, (b) 5 ECAP passes. 0 30 60 90120 150 180 210240 270 300330 360 0 30 60 90 Max: 10.85 45/ Min: 0.01 0 30 60 90120 150 180 210240 270 300330 360 0 30 60 90 Max: 13.73 65/ Min: 0.01 0 30 60 90120 150 180 210240 270 300330 360 0 30 60 90 Max: 7.96 90/ Min: 0.01 2 4 6 8 10 12 0 30 60 90120150180210240270300330360 0 30 60 90 Max: 13.84 45/ Min: 0.01 0 30 60 90120150180210240270300330360 0 30 60 90 Max: 9.31 65/ Min: 0.01 0 30 60 90120150180210240270300330360 0 30 60 90 Max: 2.77 90/ Min: 0.01 2 4 6 8 10 12 0 30 60 90120150180210240270300330360 0 30 60 90 Max: 20.73 45/ Min: 0 0 30 60 90120150180210240270300330360 0 30 60 90 Max: 15.95 65/ Min: 0 0 30 60 90120150180210240270300330360 0 30 60 90 Max: 12.26 90/ Min: 0 2 4 6 8 10 12 14 16 18 20
n=1
n=3
n=5
Ideal ODF
0 30 60 90 120 150 180 210 240 270 300 330 360 0 30 60 90 Max: 45/ 0 30 60 90 120 150 180 210 240 270 300 330 360 0 30 60 90 Max: 65/ 0 30 60 90 120 150 180 210 240 270 300 330 360 0 30 60 90 Max: 90/ Cu texture (111)[11-2] shear component φ2=45° φ2=65° φ2=90° φ2=45° φ2=65° φ2=90° φ2=45° φ2=65° φ2=90° φ2=45° φ2=65° φ2=90° 111 001 011 0.5 1 1.5 2 2.5 3 111 001 011 0.5 1 1.5 2 2.5 111 001 011 0.5 1 1.5Fig. 7 ODFs for n= 1, 3, 5 of ECAP passes and IPFs along ©©NDªª direction.
2) O. Hernández and G. Gonzalez:Mater. Charact. 59 (2008) 534541. 3) K. Xu, A. M. Rusell, L. S. Chumbley and F. C. Laabs:Scr. Mater. 44
(2001) 935940.
4) G. Gonzalez, C. Braham, J. L. Lebrun, Y. Chastel, W. Seiler and I. A. Figueroa:Mater. Trans. 53 (2012) 12341239.
5) C. Hernández, I. A. Figueroa, C. Braham, O. Novelo-Peralta, G. A. Lara-Rodriguez and G. Gonzalez:Mater. Trans. 54 (2013) 977983. 6) H. J. Roven, H. Nesboe, J. C. Werenskiold and T. Seibert:Mater. Sci.
Eng. A 410411 (2005) 426429.
7) R. Z. Valiev and T. G. Langdon:Prog. Mater. Sci. 51 (2006) 881981. 8) R. Z. Valiev:Adv. Eng. Mater. 5 (2003) 296300.
9) M. A. Meyers, A. Mishra and D. J. Benson:Prog. Mater. Sci. 51 (2006)
427556.
10) Z. Horita, T. Fujinami, M. Nemoto and T. G. Langdon: J. Mater. Process. Tech. 117 (2001) 288292.
11) Y. Iwahashi, J. Wang, Z. Horita, M. Nemoto and T. Langdon:Scr. Mater. 35 (1996) 143146.
12) M. Furukawa, Y. Iwahashi, Z. Horita, M. Nemoto and T. Langdon: Mater. Sci. Eng. A 257 (1998) 328332.
13) I. J. Beyerlein and L. S. Toth:Prog. Mater. Sci. 54 (2009) 427510. 14) S. Suwas, R. A. Massion, L. S. Toth, J. J. Fundenberger and B. Beausir:
Mater. Sci. Eng. A 520 (2009) 134146.
15) S. Li, I. J. Beyerlein and M. A. M. Bourke:Mater. Sci. Eng. A 394 (2005) 6677.