Science Arts & Métiers (SAM)
is an open access repository that collects the work of Arts et Métiers Institute of
Technology researchers and makes it freely available over the web where possible.
This is an author-deposited version published in:
https://sam.ensam.eu
Handle ID: .
http://hdl.handle.net/10985/13275
To cite this version :
P. ZUO, R.C. BENEVIDES, M.A. LARIBI, JOSEPH FITOUSSI, M SHIRINBAYAN, Farid BAKIR,
Abbas TCHARKHTCHI - Multi-scale analysis of the effect of loading conditions on monotonic and
fatigue behavior of a glass fiber reinforced polyphenylene sulfide (PPS) composite - Composites
Part B: Engineering - Vol. 145, p.173-181 - 2018
Any correspondence concerning this service should be sent to the repository
Multi-scale analysis of the e
ffect of loading conditions on monotonic and
fatigue behavior of a glass
fiber reinforced polyphenylene sulfide (PPS)
composite
P. Zuo
a,∗, R.C. Benevides
b, M.A. Laribi
a,d, J. Fitoussi
a, M. Shirinbayan
a, F. Bakir
c, A. Tcharkhtchi
a aArts et Métiers ParisTech, PIMM– UMR CNRS 8006, 151 Boulevard de l’Hôpital, 75013 Paris, FrancebValeo Thermique Habitacle, Valeo Powertrain Thermal Systems, 8 Rue Louis Lormand, 78321 La varrière, France cArts et Métiers ParisTech, Dynfluid – UMR CNRS 8006, 151 Boulevard de l’Hôpital, 75013 Paris, France dEcole Nationale d’Ingénieurs de Sousse, LMS, Pôle Technologique, Route de Ceinture, 4054 Sousse, Tunisia
A R T I C L E I N F O Keywords: Poly-phenylene sulfide (PPS) Composite Glassfiber Fatigue behavior Self-heating A B S T R A C T
In this paper, two kinds of PPS/GF composite samples (PPS-0°, PPS-90°) were prepared with two different fiber main orientations related to the injection direction. A wide range of their properties were discussed. Using DMTA analysis, it was shown that the PPS/GF composite under study obeyed the time-temperature equivalence prin-ciple. Moreover, Perez model was verified and gave a good estimation of the viscoelastic properties of the PPS/ GF. Monotonic and fatigue behaviors and fatigue life of PPS/GF were investigated. Fiber's orientation, applied amplitude and loading frequency effects were emphasized. Self-heating effect on fatigue strength was also analyzed. SEM fracture surface observations allowed analyzing, at the local scale, the main deformation me-chanisms occurring during mechanical loading. No evident damage development was observed for both monotonic and fatigue loading. PPS matrix plasticity appeared to be the predominant deformation mechanism until a semi-ductile or semi-brittlefinal failure depending on the loading conditions and local microstructure.
1. Introduction
Thermosetting resin-based composite materials have been ex-tensively used over the past 40 years [1–4]. They provide us a wide range of useful mechanical properties, together with undeniable drawbacks, such as the need of low temperature storage, hand-made draping, irreversible defects of the manufacturing process and also difficult recycling. In the modern society, high-performance thermo-plastic resins offer a promising alternative to thermosetting resins. In-deed, thermoplastic resins offer many advantages over conventional thermosetting resins and they also exhibit a high performance such as chemical resistance, as well as excellent damage and impact properties [5–8]. PolyPhenylene Sulfide (PPS) is a semi-crystalline polymer with an ordered alternating arrangement of phenylene and sulfide atoms. It is widely used as a high performance engineering polymer with a un-ique combination of excellent physical, thermal, and mechanical properties. It is applied in a wide range including electronics and electrical appliances, automotive parts, precision instruments, chemical sectors and aerospacefields [9–12]. Moreover, Poly-Phenylene Sulfide (PPS), as a high performance thermoplastic, is an attractive engineering
thermoplastic which is widely used due to its good tribological prop-erties,flame retardant and resistant to chemical and thermal abilities, as well as having good processing properties [13–19]. To improve the mechanical properties of pure PPS, composites formed using polymer blending,fiber reinforcing and/or fillers are usually used in industry [20–23]. It is well known that, the properties offiber reinforced com-posites depend on several factors such as the characteristics of its matrix andfibers, form and volume fraction of fibers, chemical and physical interaction between fiber and polymer, and processing conditions. Especially the main factor is the compatibility betweenfibers and the matrix [24]. Good interfacial adhesion between fiber and matrix is necessary for obtaining composite with excellent mechanical proper-ties. Recently, many researches were focused onfiber reinforced PPS composites. Ana et al. [25] studied novel carbonfiber (CF)-reinforced poly (phenylene sulfide) PPS laminates incorporating inorganic full-erene-like tungsten (IF-WS2) using melting-blending and hot-press processing. They found that those nanoparticles showed great potential to improve the mechanical and tribological properties of conventional thermoplastic/CF composites for structural applications. Liu et al. [26] explored the interfacial micromechanical performance of carbonfiber
∗Corresponding author.
E-mail addresses:peiyuan.zuo@ensam.eu(P. Zuo),rodrigo.benevides@valeo.com(R.C. Benevides),mohamed-amine.laribi@ensam.eu(M.A. Laribi),
joseph.fitoussi@ensam.eu(J. Fitoussi),mohammadali.shirinbayan@ensam.eu(M. Shirinbayan),farid.bakir@paris.ensam.fr(F. Bakir),abbas.tcharkhtchi@ensam.eu(A. Tcharkhtchi).
(CF) reinforced polyphenylene sulfide (PPS) composites by micro-bond test and concluded the interfacial shear strength increased with in-creasingfiber embedded length below 0.02 mm/s and above 0.04 mm/ s. Vieille et al. [27] investigated the influence of temperature on
me-chanical properties and behaviors of carbon fiber fabric reinforced polyphenylene sulfide (PPS) laminates subjected to different loadings and they exhibited that a temperature up to the glass transition tem-perature (Tg) softens the matrix behavior and reduces mechanical properties (in-plane shear, compressive, flexural and interlaminar shear).
On the other hand, as a good composite candidate in mechanical properties, we pay much attention to the aspect of fatigue behavior of PPS. Especially it is very important to understand the damage me-chanism and relative self-heating phenomenon of PPS under fatigue loading since these researches can give us a great help in industrial utilization. In this aspect, there are a wide range of published re-searches before. Lou et al. [28] studied environmental effects on glass
reinforced PPS composites. They clarified that the loss in properties was caused mainly by the degradation of thefiber-matrix interface. Good fatigue property retentions were observed after the samples were ex-posed to both hot air and water. Mandell et al. [29] researched fatigue behavior of glass and carbon fiber reinforced engineering thermo-plastics PPS. The tensile-tensile S-N fatigue curves showed that PPS reinforced with 40% glassfiber degraded more rapidly than that for PPS reinforced with 40% carbonfibers.
In this paper, two kinds of PPS/GF samples were prepared (PPS-0°, PPS-90°). Here, PPS-0° corresponds tofibers oriented in the mold flow direction while PPS-90° derives from the samples withfibers oriented perpendicularly to it. The main structure for this paper is as follows: firstly, microstructure is characterized by SEM. Therefore, a wide range of tests are applied to exhibit the physico-chemical properties of PPS/ GF composite material. Finally, the most important attention is given to the discussion concerning some aspects of fatigue behavior of PPS/GF composite and the effects of some parameters (e.g. fiber orientation, frequency and amplitude).
2. Materials and characterization methods 2.1. Materials
PPS/GF composite materials with 30% (weight content) short glass fibers are kindly supplied by Valeo Company France in the form of injected plate. The material presents a density of 1.58 g/cm3and water absorption of about 0.02%.
2.2. Characterization methods 2.2.1. Microscopic observations
Microscopic observations and image analysis, using Scanning Electronic Microscope (HITACHI 4800 SEM), were used in the aim to investigate qualitatively the material microstructure and especially fi-bers orientation.
2.2.2. Differential scanning calorimetry (DSC)
The differential scanning calorimetry (DSC) measurements were carried out with the DSC Q 10 V 9.0 Build 275 (TA Instruments, Guyancourt, France). The samples of mass between 10 and 20 mg were placed in hermetic aluminum capsules. The sample was heatedfirst up to 300 °C with a temperature rate of 5 °C/min in the atmosphere of Nitrogen (40 ml/min), in order to eliminate the effect of the thermal history of the material. It was cooled down to 0 °C in order to be re-heated up to 300 °C with the same temperature rate. In this test, the melting point, Tmand the crystallization temperature, Tcof the sample have been measured.
2.2.3. Dynamic thermo-mechanical analysis (DMTA)
Thermo-mechanical (DMTA) tests have been performed on PPS/GF composite samples using DMA Q 800 instrument, from TA Company, in order to measure the main transitions temperatures and to characterize the viscoelastic behavior of the polymer. The tests have been realized at following condition: alternating bending configuration; temperature range 25 °C–250 °C; frequency from 0.1 Hz to 50 Hz; temperature rate 2 °C/min. The sample has a rectangular shape with 35 × 12 × 3 mm3 dimensions.
2.2.4. Thermal gravimetric analysis (TGA)
Thermal mass change of PPS/GF samples was followed using TGA Q500, the temperature program is from room temperature to 800 °C with 10 °C/min in the nitrogen atmosphere (40 ml/min). The original sample mass is 12.32 mg, which is put in the Al2O3crucible (85μL). This test may give an idea about the thermal stability of the polymer. 2.3. Tensile and fatigue devices
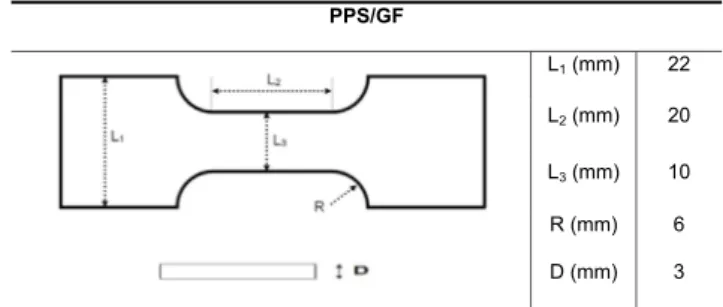
Tensile properties were measured with an INSTRON 5966 machine at room temperature. Dog bone shape samples (seeFig. 1) were used. The displacement rate was 0.5 mm/min. The load cell capacity was of 10 kN.
Tension-tension fatigue tests were performed at different applied maximum stresses on MTS 830 hydraulic fatigue machine. The minimum applied stress is always chosen to be equal to 10% of the maximum applied stress (R = 0.1). In this paper, the results of experi-ments performed at two frequencies 10 Hz and 50 Hz are presented. In order to measure precisely the stiffness reduction due to the first loading stage (initial damage), each fatigue test is preceded by a quasi-static tensile loading-unloading-reloading stage.
During cyclic loading, the rising temperature (due to self-heating) has been measured on the surface of the specimens using an infrared camera (Raynger-MX4). The damage effect has been evaluated through the measurement of the Young's modulus evolution. In this work, the experimental fatigue tests have been performed on the sample with the geometry as shown inFig. 1. Fatigue experiments have been achieved at different load directions, amplitudes and frequencies.
3. Results and discussion
3.1. Characterization of microstructure
Fig. 2(a) is an optical microscopy photo after composite pyrolysis. Image analysis reveals short glassfibers with a diameter of about 15 μm and the length ranging from 70 to 360μm with an average length of about 200μm. This important dispersion of the length of the fibers can be explained by the fact that a large number of thefibers are broken during extrusion and injection by the metal screws.Fig. 2(b) show a typical microstructure of the PPS/GF composite obtained by SEM ob-servation. One can notice that a large number offibers are oriented in the moldflow direction.
PPS/GF L1(mm) 22 L2(mm) 20 L3(mm) 10 R (mm) 6 D (mm) 3
3.2. Physicochemical characterization 3.2.1. DSC analysis
Fig. 3shows the heat-cooling curves of PPS/GF after two cycles. According to the results, it is notable that the second heat-cooling cycle follows thefirst one in the same way and two cycles show almost the same melting point (Tm) and crystallization temperature (Tc). This re-versible effect means that PPS/GF composite material is thermally stable and even heating up to 300 °C, its characteristics don't change. The results show that for PPS/GF composite material, Tm is about 283 °C and Tcis about 244 °C.
3.2.2. TGA characterization
The TGA curve of PPS/GF is shown inFig. 4. The results show that the PPS/GF has no obvious weight loss before 370 °C. From this tem-perature until to 500 °C, the sample losses almost 10% of its initial weight. Then, the kinetic of weight loss changes indicates another
mechanism. At the end of TGA test, all matrixes will be pyrolized and only the mineral glassfibers will remain in the system (almost 60%). In view of these TGA results, one can conclude that PPS/GF owns good thermal stability.
3.3. Thermo-mechanical properties 3.3.1. DMTA measurement
DMTA test is especially performed to study the thermomechanical behavior of the polymer and to determine the diverse transitions and change of physical state of polymers. In this work, DMTA tests have been performed according to alternating bending configuration, with the frequency of 1 Hz. The result of DMTA test is shown inFig. 5. All three curves (E′, E″ and tanδ) show three physical state regions: glassy state, glass transition zone (called alsoα-transition) and rubbery state. From this result, it can be seen that PPS/GF exhibits a glassy state up to 80 °C. In this region the change of E′, E″ and tanδ is not significant. In glassy state, E′ is relatively high (> 3700 MPa). The second zone (be-tween 80 °C and 160 °C) isα-transition zone. It corresponds to glass
Fig. 2. (a) Optical microscopy photo after pyrolysis and (b) typical SEM PPS/GF microstructure.
Fig. 3. DSC results performed on PPS/GF with two heating (a) and cooling (b) cycles.
transition phenomenon. In this zone, E′ decreases drastically from 3700 MPa to a value lower than 800 MPa. E″ increases first and then decreases; showing a pic at 107 °C (α-transition temperature). This value may be considered as glass transition temperature of the polymer. tanδ (E’’/E′) shows the same tendency as E’’. The rubbery state of PPS/ GF, is then in the zone of temperature higher than 160 °C. As it can be seen the value of E′ in this state is low (< 800 MPa) and the sample is relatively soft.
3.3.2. WLF equation
To explore the effect of temperature on viscoelastic properties of PPS/GF, multi-frequencies DMA test was conducted on PPS-90° speci-mens inflexural bending mode and the results are shown inFig. 6. One can note that when increasing frequency, theα-transition temperature, Tα (related to Tg) has an increasing trend to high temperatures. This evolution may be followed by WLF equation [30]:
= − − + − log f fr C1(Ta Tar) C2 (Ta Tar) (1)
where f is the frequency; T is the temperature; Tαr (1 Hz) is the re-ference temperature at rere-ference frequency, fr. C1=B/(2.303 fg) and C2 = fg/Δα are WLF constants with fg, free volume fraction,Δα heat expansion coefficient and B, a constant near to 1.
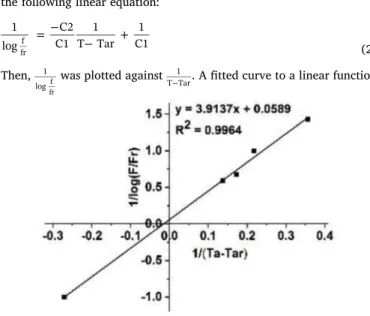
By linear regression method, WLF equation has been transformed to the following linear equation:
=− − + 1 log C2 C1 1 T Tar 1 C1 f fr (2) Then, 1 logf fr
was plotted against
− 1
T Tar. Afitted curve to a linear function
with a correction coefficient (R2
= 0.9964) is shown inFig. 7. The value of C1, C2, fg andΔα are shown inTable 1. This means that PPS/GF composite under this study obeys the time-temperature equivalence principle.
3.3.3. Cole-Cole diagram
The viscoelastic behavior of PPS/GF composite may be shown by Perez model [31,32] using Cole-Cole method. The Cole-Cole diagram presents the variation of G’’ (loss modulus) versus G’ (storage modulus), obtained from the DMTA test on PPS-90° samples of PPS/GF (Fig. 8).
The Perez model gives an expression of the complex Young modulus G* as a function of frequency and relaxation time:
= ′ + ′ = + − + + ∗ ′ ∞ ′ G G i G G G G Q i ω τ i ω τ 1 ( )k ( )k 0 0 (3) whereω, the angular frequency, is equal to 2πf,G andG are respec-tively the relaxed (rubbery state) and unrelaxed modulus (glassy state) andτ is the relaxation time. k, k’ and Q are the parameters of the model. Experimental (the points) and Perez model (continuous curve) Cole-Cole diagrams are shown in Fig. 8. Thisfigure shows that with the identified values of the Perez model parameters shown inTable 2, the experimental Cole-Cole diagram is highly consistent with the chosen model. So, Perez model predict accurately the thermo-mechanical properties of PPS/GF.
3.4. Mechanical properties 3.4.1. Tensile behavior
The results of the stress-strain tensile tests on PPS-0° and PPS-90° specimens at the room temperature are shown inFig. 9and the main characteristics are registered inTable 3. As it can be seen, the value of Young's modulus of PPS-0° is about 6000 MPa, which is higher than that for PPS-90° (4300 MPa). Moreover, because of thefibers orientation, 0° specimens have higher failure stress (104 MPa) than that of
PPS-Fig. 6. Effect of frequency on loss modulus spectrum of PPS/GF compositein the range of 0.1 Hz–50 Hz.
Fig. 7. Linear regression of WLF equation.
Table 1
The values of WLF constants.
Composite C1 C2 fg Δα PP/GF - 90° 17.0 66.4 2.56 × 10⁻² 3.85 × 10⁻⁴
Fig. 8. Cole-Cole experimental diagram (the points) and Perez model (continuous curve).
Table 2
The value of the Perez model constants.
G0(MPa) G ∞(MPa) k k' Q τ (s)
90° (84 MPa).
The results of tensile tests indicate that the reinforcement effect of thefibers remains relatively limited. This may be attributed to the small length of thefibers as shown before.
Moreover, the fracture surfaces after tensile failure, observed by SEM (seeFig. 10) allow the following comments:
•
Thefibers with a diameter 10–15 μm, mostly oriented in the moldflow direction during injection, are pulled out during the last stage of the failure (seeFig. 10(a; c)).
•
It is obvious to conclude a very good adhesion between matrix and fibers, probably due to the presence of a coupling agent. Indeed, fiber pull-out is not consecutive to fiber-matrix interface failure but rather to micro-cracking of the matrix surrounding the interfaces. Hence, all thefibers remain coated by a thin layer of PPS matrix after pull-out.•
Two kinds of broken zones can be distinguished: Thefirst one cor-responds to brittle failure of the matrix which mostly occurs locally between longitudinalfibers (see the dotted circles inFig. 10(a)). The second one shows local semi-ductile failure of the matrix around and between thefibers (seeFig. 10(b) and (c)). This phenomenon seems to be favored when thefibers are miss-oriented versus tensile axis. In order to quantify the possibility of plastic deformation and da-mage development, loading-unloading tensile test with progressive in-crease of the maximum stress have been performed (to be shown in a further publication). It was shown that the non-linear behavior of the PPS/GF composite is essentially due to plasticity (no significant loss of stiffness was observed). Therefore, together with the above SEM ob-servations, one can conclude that, under monotonic loading, the pre-dominant non-linear deformation mechanism is the local plasticity of PPS matrix. Indeed, because of an excellent adhesion betweenfiber and matrix, no progressive damage due tofiber-matrix interface de-bonding occurs as it is classically observed in reinforced thermoplastics [34,35]. Moreover, at room temperature, PPS is far from the transitionsα and β, which implies semi-brittle or semi-ductile behavior depending on the local state of stress. This local plasticity is also limited because of the presence offibers. Finally, stress concentrations around the fibers lead to matrix cracking near the interfaces and to semi-ductile failure or semi-brittle failure between fibers depending on the local micro-structure configuration. The final failure occurs after the coalescence of micro-cracks and pull-out of matrix-coatedfibers.Fig. 9. PPS/GF typical tensile curves.
Table 3
Results of pure PPS, PPS-90° and PPS-0° samples obtained from tensile tests Standard deviation given by 5 repeated tests in each case.
E(MPa) σr(MPa) εr(%)
Pure PPS [33] 3697 82 2.7 PPS-90° 4300 ± 41 84 ± 4.3 3 ± 0.14 PPS-0° 6000 ± 45 104 ± 4.4 2.85 ± 0.24
Fig. 10. SEM micrograph of PPS/GF composite fracture surface after tensile test. (a) Local brittle failure of the matrix between longitudinalfibers (PPS-0°); (b) and (c) local semi-ductile failure around thefiber (PPS-90°).
3.4.2. Fatigue behavior
3.4.2.1. Wöhler curves. Fig. 11 shows the Wöhler curves obtained in tension-tension tests at a frequency of 10 Hz for PPS-0° and PPS-90° specimens at room temperature.
From thisfigure one can have the following comments:
- For PPS-0°, and PPS-90° samples, the Wöhler curves don't show a clear asymptotic value representative of an endurance limit,σend. In contrast to metal materials, this is often observed in the case of thermoplastic composites [36].
- It is obvious that, for PPS-0°, their fibers' orientation shows more resistance against fatigue loading than that for PPS-90°. For ex-ample, under 60 MPa stress amplitude, PPS-90° is broken after 1 × 10⁵fatigue cycles. While for the same amplitude, PPS-0°, failure is observed after more than 1 × 10⁶.
- For both two configurations, the Wöhler curves show two different domains; high and low stress amplitude. In each domain, SN curve can be modeled by a logarithmic linear expression:
σmax= A. Log N + B
In this equation, A and B are the material parameters corresponding to the slope of the curve and the Y intercept, respectively. The slope A means the sensitivity of the fatigue resistance and the intercept B re-presents the apparent tensile strength.
Table 4shows the value of A and B for PPS-0° and PPS-90° related to high and low stress domains.
3.4.2.2. Effect of frequency. 10 Hz and 50 Hz Wöhler curves obtained from fatigue test on PPS-0° specimens are shown inFig. 12. As it can be seen, there is no evident difference between the two curves for the higher applied stresses (above 70 MPa). However, when the applied loading decreases, one can see obviously that samples submitted to higher frequency tends to have lower cycles to failure. As generally observed, with the improvement of frequency, the fatigue curve tends to shift to lower fatigue life. But in the case of PPS/GF it concerns only
the lower range of amplitude. This will be further discussed.
3.4.2.3. Self-heating phenomenon. In order to emphasize the effect of amplitude and frequency, it is generally appropriate to study the self-heating phenomenon under various fatigue conditions. Indeed, during the tensile-tensile fatigue test, the temperature of specimens increases. The intensity of self-heating is generally dependent on the applied stress amplitude and frequency.Figures (13 and 14)show the effect of these
two parameters respectively. As shown inFig. 13(a), the temperature growth for PPS-90° samples is plotted versus the increasing cycle number. As expected, one can observe that self-heating is more pronounced for high values of the applied stress amplitudes. However, the maximum temperature reaches above 32 °C when applying high amplitude (85 MPa) while this value does not exceed 27 °C for amplitude of 65 MPa. Comparatively, for PPS-0° specimens (Fig. 13 (b)), the temperature increases at the beginning while after 4000 cycles, the temperature tends to decrease due to heat exchange with the external atmosphere. However, one can notice that the maximum temperature of self-heating also corresponds to the maximum applied amplitude (about 28.5 °C for PPS-0° at 85 MPa). Thus, one can conclude that self-heating under fatigue test is sensitive to the applied stress amplitude. While PPS-90° specimens develops more obvious self-heating phenomenon than PPS-0° specimens, one can also conclude to the influence of fiber orientation. Indeed, self-heating is due to local deformation of the matrix which is favored when the fibers are miss-oriented.
Fig. 14shows the influence of frequency (10 Hz and 50 Hz) on
self-heating. One can notice that applying a higher frequency (50 Hz) leads to a very fast temperature increases. The maximum temperature reached by a PPS-90° sample at 75 MPa is about 37.5 °C at breaking point where it does not exceed 27 °C for an applied frequency of 10 Hz. The same tendency is observed for PPS-0.
Therefore, one can conclude that:
- The amplitudes and frequencies affect obviously the self-heating phenomenon of PPS/GF composite [37].
- However, contrary to most of thermoplastic matrix based composite materials, the effect of self-heating observed in the condition of the performed experiments of this research work remains relatively limited. Indeed, the maximum temperature rise does not exceed 38 °C. At this temperature the matrix (presenting theα-transition temperature of 107 °C related to glass transition temperature) al-ways remains at glassy state and its mechanical properties are not significantly influenced by temperature (seeFig. 5).
- Moreover, even if at room temperature, the composite is far from the ductile to brittle transition temperature, the fracture of the matrix remains almost brittle, especially because of the effect of the
Fig. 11. Wöhler curves of PPS/GF composite performed on PPS-90° and PPS-0° specimens under tensile-tensile fatigue loading at the frequency of 10 Hz and room temperature, R = 0.1.
Table 4
The values of A and B for PPS-0° and PPS-90° in each domain. Samples A (MPa) B (MPa)
High stress domain Low stress domain High stress domain Low stress domain PPS-0° −12.0 - 6.7 125.7 108 PPS-90° −15.2 - 5.5 131 87.5
Fig. 12. The effect of frequency on the fatigue test results performed on PPS-0° samples, R = 0.1.
crystalline zones and the presence of thefibers.
3.4.2.4. Relative Young's modulus. The relative Young's modulus is generally identified to be an efficient parameter to detect the presence and evolution of damage during cyclic loading. It can also be used in a stiffness-based fatigue failure criterion [38]. The relative modulus is defined as the modulus E at each stage of fatigue test divided by the virgin material Young's modulus (i.e. without prior loading and damaging history), E0. Fig. 15 shows the evolution of the relative modulus under different amplitudes at 10 Hz and 50 Hz. Fig. 15(a) gives a global view of the Young's modulus evolution for an applied frequency of 10 Hz whileFig. 15(b) shows the same result for 50 Hz. For both frequencies, one can note the relative stability of Young's modulus which appears as a long plateau until failure, independently on the applied amplitudes. No significant loss of stiffness is observed: less than
1% at 10 Hz and less than 2% at 50 Hz. In regard toFigs. 5, 13 and 14, this very smooth evolution can be attributed to self-heating. This result is consistent with the conclusions drawn in paragraph concerning the local mechanisms observed in the case of monotonic loading (i.e. no damage development, local plasticity and semi-ductile failure).
3.4.2.5. Fracture surface analysis. In order to understand the influence of fiber orientation, amplitude and frequency on the fatigue life (Figs. 11 and 12), fracture surfaces have been investigated and the SEM observation are shown inFig. 16.
Several observations can be drawn:
- Fracture surface of specimens submitted to high amplitude ((a) and (b)) show more rugged topography than those submitted to low level of stresses. Indeed, a high level of local stresses may result in sudden rupture and brittle failure of matrix aroundfiber clusters, especially whenfibers are normally oriented to the principal stress ((b)).
- Under low applied stress amplitude, one can observe a semi-ductile failure due to the progressive accumulation of local plastic strain during cycling ((c) and (d)). Here again, normal orientation may amplify this effect ((d)).
- The application of higher frequency leads to moreflat and homo-geneous topography, indicating a more generalized plasticity of the continuous matrix leading to premature failure.
Here again, one can conclude semi-ductile or semi-brittle behavior driven by the local plasticity of the PPS matrix. No progressive damage is detected due to a very high strength of thefiber-matrix interface. Indeed, similarly to the monotonic loading case, thefibers are pulled out after local failure of the surrounding matrix without visible fiber-matrix interface debonding.
Fig. 13. Self-heating during fatigue tests (at 10 Hz), on PPS-90° (a) and PPS-0° (b) samples loaded under different amplitudes.
Fig. 14. Self-heating during fatigue tests with different frequencies, on 90° and PPS-0° samples.
4. Conclusion
In this paper, two kinds of PPS/GF samples (PPS-0°, PPS-90°) were prepared by injection molding. A complete characterization has been performed using several experimental methods. Microstructure, phy-sico-chemical and mechanical properties have been explored including fatigue behavior and the different parameters affecting fatigue life. Finally, SEM fracture surface analysis provided a multi-scale inter-pretation of the origin of deformation and failure.
The main results can be summarized as follows:
•
PPS/GF composites obey the time-temperature equivalence prin-ciple.•
Cole-Cole diagram has been successfully modeled by Perez model. It was shown that this model gives a good estimation of the viscoe-lastic properties of PPS/GF composites.•
Due to an excellentfiber-matrix adhesion, no progressive damage is developed, independently on the applied loading type (monotonic or fatigue).•
Even at high applied stress amplitude and high frequency, self-heating phenomenon observed during fatigue is not sufficiently pronounced to impact fatigue life of PPS/GF composite.•
Both monotonic and cyclic behaviors are essentially driven by the PPS matrix plastic deformation. However, at room temperature, the ability of the PPS matrix to develop plastic deformation remains limited.•
Consequently,final failure and fatigue life is highly dependent on the loading conditions (amplitude and frequency) and local micro-structure.- Bi-linear Whöler curves emphasized the influence of the loading amplitude. More brittle failure was observed at high amplitude and low frequency.
- Increasing frequency leads to lower fatigue life and more general-ized plasticity.
- Fiber orientation in the loading direction improves both monotonic and fatigue strength.
Acknowledgement
The authors would like to thank China Scholarship Council (CSC) and the Valeo Company for thefinancial and technical support of this work.
References
[1] Pascault J, Williams R. Glass transition temperature versus conversion relationships for thermosetting polymers. J Polym Sci B Polym Phys 1990;28(1):85–95. [2] Bogetti TA, Gillespie JW. Two-dimensional cure simulation of thick thermosetting
composites. J Compos Mater 1991;25(3):239–73.
[3] Hayes BS, Seferis JC. Modification of thermosetting resins and composites through preformed polymer particles: a review. Polym Compos 2001;22(4):451–67. [4] Gibson RF. A review of recent research on mechanics of multifunctional composite
materials and structures. Compos Struct 2010;92(12):2793–810. [5] Gabrion X, et al. About the thermomechanical behaviour of a carbonfibre
reinforced high-temperature thermoplastic composite. Compos Part B: Eng 2016;95:386–94.
[6] Eftekhari M, Fatemi A. Creep behavior and modeling of neat, talc-filled, and short glassfiber reinforced thermoplastics. Compos Part B: Eng 2016;97:68–83. [7] Lu D, et al. Impact strength and crystallization behavior of nano-SiOx/poly
(phe-nylene sulfide)(PPS) composites with heat-treated PPS. Macromol Mater Eng 2003;288(9):693–8.
[8] Del Saz-Orozco B, et al. Lignin particle- and woodflour-reinforced phenolic foams: friability, thermal stability and effect of hygrothermal aging on mechanical prop-erties and morphology. Compos Part B: Eng 2015;80(Supplement C):154–61. [9] Hill HW, Brady D. Properties, environmental stability, and molding characteristics
of polyphenylene sulfide. Polym Eng Sci 1976;16(12):831–5.
[10] López LC, Wilkes GL. Non-isothermal crystallization kinetics of poly (p-phenylene sulphide). Polymer 1989;30(5):882–7.
[11] Caramaro L, et al. Morphology and mechanical performance of poly-phenylenesulfide carbon fiber composite. Polym Eng Sci 1991;31(17):1279–85. [12] Favaloro M. Properties and processes of linear polyphenylene sulfide (PPS) for
continuousfiber composites aerospace applications. SAE International; 2009. [13] Christopher N, et al. Thermal degradation of poly (phenylene sulfide) and
per-fluoropoly (phenylene sulfide). J Appl Polym Sci 1968;12(4):863–70.
[14] Ehlers G, Fisch K, Powell W. Thermal degradation of polymers with phenylene units in the chain. II. Sulfur-containing polyarylenes. J Polym Sci 1 Polym Chem 1969;7(10):2955–67.
[15] Yu L, Bahadur S, Xue Q. An investigation of the friction and wear behaviors of ceramic particlefilled polyphenylene sulfide composites. Wear 1998;214(1):54–63. [16] Gyurova LA, Friedrich K. Artificial neural networks for predicting sliding friction
and wear properties of polyphenylene sulfide composites. Tribol Int 2011;44(5):603–9.
[17] Zhao Q, Bahadur S. A study of the modification of the friction and wear behavior of polyphenylene sulfide by particulate Ag 2 S and PbTe fillers. Wear
1998;217(1):62–72.
[18] Jiang Z, et al. Study on friction and wear behavior of polyphenylene sulfide com-posites reinforced by short carbonfibers and sub-micro TiO 2 particles. Compos Sci Technol 2008;68(3):734–42.
[19] Yang Y, et al. Morphology control of nanofillers in poly (phenylene sulfide): a novel method to realize the exfoliation of nanoclay by SiO2 via melt shearflow. Compos Sci Technol 2013;75:28–34.
[20] De Baere I, et al. On the tension–tension fatigue behaviour of a carbon reinforced thermoplastic part II: evaluation of a dumbbell-shaped specimen. Polym Test 2011;30(6):663–72.
[21] Zhou S, et al. Effect of carbon fiber reinforcement on the mechanical and tribolo-gical properties of polyamide6/polyphenylene sulfide composites. Mater Des
2013;44:493–9.
[22] Yýlmaz T, Sýnmazçelik T. Investigation of load bearing performances of pin con-nected carbon/polyphenylene sulphide composites under static loading conditions. Mater Des 2007;28(2):520–7.
[23] Liang J-Z. Crystallization of glassfiber-reinforced poly(p-phenylene sulfide) nano-composites. Polym Int 2012;61(4):511–5.
[24] Sliwa F, et al. Mechanical and interfacial properties of wood and bio-based ther-moplastic composite. Compos Sci Technol 2012;72(14):1733–40.
[25] Díez-Pascual AM, Naffakh M. Tuning the properties of carbon fiber-reinforced poly (phenylene sulphide) laminates via incorporation of inorganic nanoparticles. Polymer 2012;53(12):2369–78.
[26] Liu B, et al. Interfacial shear strength of carbonfiber reinforced polyphenylene sulfide measured by the microbond test. Polym Test 2013;32(4):724–30. [27] Vieille B, Aucher J, Taleb L. Carbonfiber fabric reinforced PPS laminates: influence
of temperature on mechanical properties and behavior. Adv Polym Technol 2011;30(2):80–95.
[28] Lou A, Murtha T. Environmental effects on glass fiber reinforced PPS stampable composites. J Compos Mater 1987;21(10):910–24.
[29] Mandell JF, Huang D, McGarry F. Fatigue of glass and carbonfiber reinforced en-gineering thermoplastics. Polym Compos 1981;2(3):137–44.
[30] Williams ML, Landel RF, Ferry JD. The temperature dependence of relaxation mechanisms in amorphous polymers and other glass-forming liquids. J Am Chem Soc 1955;77(14):3701–7.
[31] Alberola N, Bergeret A. Physical modeling of the interphase in amorphous ther-moplastic/glass bead composites. Polym Compos 1994;15(6):442–52. [32] Cavaille J, Perez J, Johari G. Molecular theory for the rheology of glasses and
polymers. Phys Rev B 1989;39(4):2411.
[33] Seppälä J, Heino M, Kapanen C. Injection-moulded blends of a thermotropic liquid crystalline polymer with polyethylene terephthalate, polypropylene, and poly-phenylene sulfide. J Appl Polym Sci 1992;44(6):1051–60.
[34] Fitoussi J, Bocquet M, Meraghni F. Effect of the matrix behavior on the damage of ethylene–propylene glass fiber reinforced composite subjected to high strain rate tension. Compos Part B: Eng 2013;45(1):1181–91.
[35] Arif MF, et al. Multiscale fatigue damage characterization in short glassfiber re-inforced polyamide-66. Compos Part B: Eng 2014;61:55–65.
[36] Fatemi A, Socie DF. A critical plane approach to multiaxial fatigue damage in-cluding out-of-phase loading. Fatig Fract Eng Mater Struct 1988;11(3):149–65. [37] Bellenger V, Tcharkhtchi A, Castaing P. Thermal and mechanical fatigue of a PA66/
glassfibers composite material. Int J Fatig 2006;28(10):1348–52.
[38] Degrieck J, Van Paepegem W. Fatigue damage modeling offibre-reinforced com-posite materials. Appl Mech Rev 2001;54(4):279–300.