HAL Id: hal-01880401
https://hal.archives-ouvertes.fr/hal-01880401
Submitted on 4 Mar 2020
HAL is a multi-disciplinary open access
archive for the deposit and dissemination of sci-entific research documents, whether they are pub-lished or not. The documents may come from
L’archive ouverte pluridisciplinaire HAL, est destinée au dépôt et à la diffusion de documents scientifiques de niveau recherche, publiés ou non, émanant des établissements d’enseignement et de
Effets de l’automatisation de la conduite en situations de
conduite normales et critiques : de l’étude empirique sur
simulateur à la modélisation cognitive.
Matthew Sassman, Jonathan Deniel, Thierry Bellet, Bernard Claverie
To cite this version:
Matthew Sassman, Jonathan Deniel, Thierry Bellet, Bernard Claverie. Effets de l’automatisation de la conduite en situations de conduite normales et critiques : de l’étude empirique sur simulateur à la modélisation cognitive.. Ingénierie cognitique, ISTE, 2018, 2 (1), �10.21494/ISTE.OP.2018.0294�. �hal-01880401�
Effets de l’automatisation de la conduite en situations de conduite
normales et critiques : de l’étude empirique sur simulateur à la
modélisation cognitive.
Effects of vehicle automation in normal and critical driving situations:
from empirical studies on a driving simulator to cognitive modelling
Matthew Sassman1,2, Jonathan Deniel1,2, Thierry Bellet1, Bernard Claverie2³IFSTTAR (LESCOT), Bron, FRANCE ;
4Université de Bordeaux (IPB/IMS/ENSC), Talence, FRANCE
ABSTRACT.With the migration of responsibility from drivers to automation systems in vehicles, there are potential risks to be studied due to “out-of-the loop” issue induced by the automated driving. To investigate these potential risks, two complementary experiments were implemented on a driving simulator. The 1st experiment investigates vehicle automation in highway traffic jam conditions. Main findings indicate that increased automation of Level 4 (compared to L3) was assessed as more useful by the participants, reducing the task difficulty and annoyance. The 2nd experiment focused on critical driving conditions and automation’s effect on participants’ Situational Awareness (SA), their criticality assessment, their ability to resume manual control when necessary, or their confidence in an automated system managing the risk for them. Main findings of this 2nd experiment found several effects of vehicle automation on drivers’ SA and risk assessment, or on their visual scanning behaviours, however this was dependent of the participant’s level of driving experience. Finally, eye tracking data collected during the second experiment were used in a cognitive model (named COSMODRIVE) to simulate some effects of vehicle automation of drivers’ visual scanning. This modeling work is presented in the last section of the article.
KEYWORDS: Automated driving, Acceptance, Perceived Usefulness, Situational Awareness, Risk Awareness, Cognitive modelling.
RESUME.Avec l’automatisation de la conduite et le transfert de la responsabilité du véhicule vers l’automate, il convient de s’intéresser aux risques potentiels induits par la « sortie de la boucle » de l’humain. A cette fin, deux expérimentations ont été réalisées sur simulateur de conduite. La 1ère porte sur l’automatisation du véhicule en conditions d’embouteillages sur autoroute. Les résultats indiquent qu’un niveau d’automatisation plus élevé (L4, comparé à L3) est jugé par les participants comme plus utile, réduisant la difficulté et la pénibilité de la tâche de conduite. La 2nde expérimentation, en situations de conduite critiques, s’intéresse à l’effet de l’automatisation sur la conscience de la situation (CS), l’évaluation de sa criticité, la capacité des participants à reprendre le contrôle manuel en cas de nécessité, et enfin sur leur confiance en un système automatisé gérant le risque à leur place. Les résultats de cette 2nde expérimentation révèlent des effets de l’automatisation sur la CS des conducteurs, sur l’évaluation du risque ainsi que sur les stratégies visuelles, effets néanmoins dépendants du niveau d’expérience de conduite. Dans la dernière section de l’article, les données empiriques collectées au cours de la 2nde expérimentation sont utilisées dans le modèle COSMODRIVE afin de simuler certains effets de l’automatisation de la conduite sur les stratégies d’exploration visuelle du conducteur.
MOTS-CLEFS.: Automatisation de la conduite, Acceptabilité, Utilité perçue, Conscience de la Situation, Conscience du Risque, Modélisation cognitive.
Corresponding Authors
matt.sassman@gmail.com , thierry.bellet@ifsttar.fr , jonathan.deniel@ifsttar.fr , bernard.claverie@u-bordeaux.fr
1 Introduction: background, context and research objectives
As the industry continues to progress towards realizing fully automated vehicles, driving tasks are increasingly relegated to automation systems. Drivers who were previously in full control of the vehicle are slowly switching from a control task to a system monitoring task and will eventually no longer be involved in driving tasks at all ([GAS 12]). As the level of automation found in most cars becomes increasingly self-reliant, there is an increased risk of the drivers slowly drifting further and further out of the loop of control. Indeed, during manual driving, humans continually update their mental representations as and when they dynamically progress in the road environment ([BEL 09]). These mental representations play a key role in drivers’ decision making, in their awareness of the current and future situational risks ([BEL 12]) and finally, in the driving behaviours they will implement in the current driving context. By contrast, during automated driving, human drivers are more or less disengaged of the vehicle control ([SAE 14]; [PAR 00]; [WIC 10]). This may consequently result a drop in their attention allocation to their surroundings and in a potential decreasing in their situation awareness ([KAB 04]; [STA 05]; [MER 12]; [SAL 12]; [DEW 14]; [KYR 17]). This reduced situation awareness and attention allocated to the driving task may negatively impact the drivers’ abilities to resume the manual control of the car in the case of a Take-Over Request (TOR) generated by automated driving systems, such as when automation exceeds its functional limits, or otherwise fails ([LEV 98]) and, ultimately, negatively impacts their abilities to respond appropriately to a point that is unacceptable, or, as recent research has shown, downright dangerous ([ERI 17]).
Another very important issue for vehicle automation designers is about the drivers’ assessments regarding the interests of different levels of automated driving systems compared to the manual driving. Indeed, facing to the new opportunities opened by vehicle automation, it is however essential to take into account prospective users’ acceptance or rejection of this new way of driving. According to models explaining the adoption of a technology, like the Technology Acceptance Model (TAM) of Davis ([DAV 85]) or the Unified Theories of Acceptance and Use of Technology (UTAUT, [VEN 03]), acceptance of new technologies in intimately linked with its perceived usefulness and its (expected or assessed) efficiency compared with more traditional technologies (or manual driving in our case). In the specific context of advanced technologies for vehicles, the Car Technology Acceptance Research Model (CTAM) of Osswald, Wurhofer, Trösterer, Beck & Tscheligi ([OSS 12]) also confirms the central importance of perceived usefulness, which is defined by these authors as the extent to which a person thinks that using this technology will enhance his or her performance. These authors however added other dimensions, like perceived safety and anxiety. ‘Perceived safety’ refers to individuals’ expectations or assessment that using a new aid system will increase their safety and/or their well-being, while ‘anxiety’ is defined as the degree to which a person feels apprehensive, uneasy or aroused by a situation or a technology.
All these potential effects of vehicle automation are however liable to be dependent of the Level of Automation (LoA), as distinguished in the SAE J3016 ([SAE 14], presented in Table 1).
Table 1. SAE Levels of Automation (2014)
Regarding this SAE classification, the central focus of the driving simulator experiments presented in this paper will be the Level 3 of “conditional automation”, when the driving task is performed by an automated systems with however the expectation that the human driver will respond appropriately to a Take-Over Request (TOR), and the Level 4 of “high automation”, when the automated driving system is able to manage all the driving tasks, including critical situations, without any required intervention from the human driver.
The two crucial issues investigated during these experiments are related to the human drivers’ abilities to adequately regain manual control after automated driving (for L3 automation) and about their acceptance and their “feeling” when they experience different LoA, according to the criticality of the driving situation. Indeed, effects of vehicle automation on drivers’ feelings, assessments and abilities may be dependent of both the dangerousness of the driving conditions and the driver’s perceived risk in the situation.
To study these issues, two complementary experiments were implemented on driving simulator to capture their perception, their situation or risk awareness, and their behaviour during manual driving (L0, baseline), when assisted by an L3 automated system generating a TOR, or when assisted by an L4 highly automated driving system that required no input from the driver. With this methodological approach, we will look at how a driver performs in native manual mode driving, much as it exists on roadways today, and compare this to driver performance with increasing levels of automation, where the driver is expected to maintain a
monitoring or interventionist role in how the vehicle operates and deals with critical situations. The roles are fundamentally different and would involve different tactics and actions for handling any situations, particularly in the case of critical situations.
The first experiment is focused on “normal driving conditions” in a traffic jam on a congested highway travelling slower than the posted speed. At this level, the aim was to study the difficulty and the annoyance of the driving task when the human drivers perform it manually, compared with a similar task performed by automated driving systems. In manual mode, the participants were responsible for maintaining continuous control over pedal usage, with regular activation of the brake and accelerator pedals to maintain a safe following distance. In the Level 3 Automation mode, the driver had an audio-visual TOR when the L3 system reached its limits. In Level 4 automated mode, the driver was not required to provide any input, nut rate the system. In addition to difficulty and annoyance, we also study the respective usefulness and acceptance of these automation systems in the traffic jam context.
The second experiment is related to “critical driving conditions” (front collision risk on highway), investigating drivers’ assessments about future automated driving systems (in terms of usefulness and system efficiency), and their feelings after experiencing simulated versions of these systems (including their assessments about the automation’s efficiency when facing to a critical event). In this 2nd experiment, the participants performed the driving task under 3 levels of vehicle automation, similar to Experiment 1: (1) the manual driving condition where everything was managed manually by the driver, (2) the Level 3 automation generated a TOR when the functional limitations of this aid system are reached (i.e. complex traffic situations that the computer cannot handle), and (3) Level 4 automation where the system is able to manage these critical events by itself in a fully automated way, and the participant is a “passive passenger” of the autonomous driving system.
From the cognitive point of view, the main topics investigated during these 2 experiments concerned the impacts of vehicle automation on driver's visual scanning, situation awareness, situational risk assessment, and decision-making when driving.
Based on this collected set of empirical data, the last step will be to progress towards the cognitive modelling and simulation of drivers’ visual scanning, decision making and behaviours with a cognitive simulation model of the car driver developed at IFSTTAR ([BEL 09]; [BOR 16]). The last section of this article will present some results based on this approach and the future perspectives of this this modelling approach to support the virtual human centred design of vehicle automation ([BEL 12]).
2. Method
One of the central objectives of our two simulator experiments is to investigate effects of LoA on driver’s Situation Awareness, defined by Endsley([END 95]) as the perception of the elements in the environment within a volume of time and space, the comprehension of their meaning, and the projection of their status in the near future. From a review of the different Situational Awareness assessment methods ([SAS 17]), we could not find one method that exactly met our requirements. So, in order to get all the information we were interested in capturing, we created a new method, named SAFIR (for Situational Awareness assessment
using Freeze/Identify/Rebuild) to collect a large amount of multifaceted data in order to ensure that future analysis would yield a holistic view of the mental and behavioural processes involved in handling the situations the participants were exposed to in the experiment. This
SAFIR method was initially based on two pre-existing approaches developed at IFSTTAR:
The ICARE Protocol, focused on Situation Awarness assessment (InteraCtive tool for
Assessing drivers’ situation awaREness) ([BEL 09]; [BAI 04]; [BAI 03]) and the CRITIC Method (Common RIsk awareness measurement meThod for Inter-population Comparisons) ([BAN 08]; [BEL 09]; [BEL 12]) dedicated to Risk Awareness measurement. These two tools were based on video movies of traffic situations that are suddenly interrupted. For ICARE, the last image of the video was modified and shown as frozen to the participants. Then, they were asked to detect the change. Right detection indicates a correct participant’s SA regarding the modified event (added, moved on deleted). For CRITIC, participants have to watch videos and to stop them when they felt the situation became critical. At the freeze they had to answer about situation criticality (and other dimension) from Likert scale ranging from 0 (e.g. not critical) to 100 (e.g. highly criticality).
SAFIR, as a new combination of CRITIC and ICARE, sets itself apart from its predecessors due to its inclusion of modifications that allow this tool to work in a 3D rendered environment. Both ICARE and CRITIC were originally designed to work with video footage instead of a dynamic simulated environment. As SAFIR is integrated in the software we use in the simulation of the environment, we create a more immersive and cohesive link between our questions and the act of simulated driving. SAFIR grants us the opportunity to thoroughly investigate how situational awareness, automation, or the criticality of a situation interacts with observable behavioral or cognitive patterns.
In the First experiment discussed in this paper, the SAFIR method and analysis relied primarily on a questionnaire, dealing with more of the qualitative aspect of automation and its effects on drivers. This led to some refinement for the second experiment focusing on critical driving scenarios. By contrast, for this second experiment the protocol at the end of each scenario was executed as follows.
Occlusion: For us to make changes that were not exceptionally easy to track, all 3 screens
of the simulator are blacked out for 750ms. This time frame allowed us enough time to make sure that the participants would have to work from more than simply visual memory when identifying the changes that were made ([PHI 74]) in addition to making sure that the changes were rendered appropriately in the software.
Freeze: When the screens were occluded the scenario froze, and it remained frozen for the
duration of the protocol until the start of the next scenario. Once the occlusion period ended, the participants are asked to identify any changes they registered, and the test administrators rebuilt the image as they report it. This created a persistent image that could be used for inquiry that was built and double checked for accuracy against the operational mental representation that the participant was using during (or shortly after) the occlusion of the screens.
Identify: After pausing the scenario and completing a timed occlusion of the screens,
participants were presented with a static image in first person perspective from the moment just prior to occlusion and asked to identify/reverse any changes they saw.
If there were changes reported, the participant was asked to indicate approximately where they occurred. Participants were prompted to give us the location of the change, as well as details about the vehicle that they believed were changed. As soon as we had this information, we began to rebuild according to the participants’ description.
Rebuild: For the rebuild, we had the participants point out and describe where the
change(s), if identified, had occurred. In order to rebuild, we rendered a mesh of the vehicle, as described by the participant during the identify step. The participant was asked to direct the experimenter in the rebuilding in order to make sure the rebuilt element was appropriately placed. During this process, the experimenter moved the specified vehicle mesh to the specified location. Once the rebuild was complete, it was double checked by the participant, and they will have provided a persistent image for further assessment.
We created a metric by which we scored to the accuracy of the changes made by the participant. In this iteration, the metric was nominal and meant to simply note how accurately they successfully identified and rebuilt the changes (0, 25, 50, 75, 100).
Questionnaire: After the Freeze/Rebuild activity is completed the participants were asked
to complete a Criticality Questionnaire with subjective ratings on a likert-like continuous scale of 0 – 100. The motivation for using such scales was to collect individual’s assessments formulated through continuous numerical values, that are required to support quantitative analyses based on statistical methods (for the justification of this approach from the statistical point of view, see [CHI 09] and [BEL 18]). This questionnaire was defined to get more information about drivers’ risk awareness and their assessments regarding LoA, by considering:
1. The criticality of the situation at the moment of freeze,
2. The criticality of the situation in the next few instants, if it had continued uninterrupted,
3. How well they (for manual driving) versus the automated systems managed the risk in
the scenarios.
We also included a section of questions focusing on perceived usefulness and acceptance of automated systems. These, again, changed with levels of automation, progressively moving from rating how potentially useful an automation system would be in Manual Driving mode, up to review an automated system that handled the situation independent of human interaction.
Additionally, participants were asked an open-ended question about how they expected the situation to evolve over the next few seconds (i.e. Red car will switch lanes and lead car will brake). Again, since context is key for awareness, it is important to have an idea about what their internal representation is, and this question provides further details and context about the participants’ awareness
2.1 Equipment
We used a fixed base driving simulator for this experiment, PSICoSyHM (Plateforme de Simulation Intégrative du COnducteur et des SYstèmes Homme-Machine), which was developed at the LESCOT laboratory at IFSTTAR-Bron. The driving simulator is a bespoke system, using three 27 inch screens for a full 140° visual field, a Logitech G25 steering wheel,
and a Citroen Saxo driver seat. There are cameras focused on the participant’s face and feet, as well as one camera mounted high behind the participant’s head to capture all 140° of screen on the simulator. A Tobii X2-30 eye-tracker was used to capture gaze data of the participants. The software features a virtual environment generated by SiVIC (for Simulateur VéhiculeInfrastructure-Capteur) platform, which was developed by IFSTTAR-LIVIC ([GRU 06]). SiVIC is used to simulate vehicles, sensors, and the environment.
As part of the methodology, we included a joystick for manipulation of the generated vehicle meshes during the rebuilding task. For this we chose a Microsoft Sidewinder Precision 2 joystick.
We had a custom, in-house developed software solution for recording the qualitative data, such as the criticality assessment, the participants’ anticipated course of action, and the SA rating we gave the participants. This software provided Likert scales for reporting, and, when appropriate, boxes for recording qualitative data
2.2 Behavioural measure
With the PSICoSyHM and Tobii equipment setup, we collected data relating to driver input actions on vehicle commands, such as steering and pedal activation, as well as collecting gaze information with the eye tracking system. Only data collected from the second experiment will be presented in this paper.
2.3 Driving tasks
The general driving task to be performed by the participants during our 2 experiments was a car following task. Car following is a reference task in the field of transportation research to assess drivers’ abilities and reaction time to regulate their speed (according to lead car speed variations), which offers continuous measures of the drivers’ visual attention allocated to the road environment and of their driving behaviours performed for vehicle controlling ([BRO 94]).
For both experiments, the driving tasks performed by the participants were similar in the involved driving a virtual car in an urban highway environment with a posted speed limit of 90 km/h. In all scenarios, the driver was informed that they would be following a lead car, which was a white Mini Cooper in all cases. In manual driving condition, participants had to follow a lead car at a safe distance and were prompted to attend to their distance if they drove too close or too far from the lead vehicle. In both automated driving variations, their vehicle was programmed to follow the lead car at an inter-vehicle time distance of approximately 1.8s, a distance used in previous experiments in this lab ([BOR 16]).
The specific driving scenarios were different for the two experiments, either a congested traffic jam, or a critical moment, depending on the experiment, which will be described in further detail later.
In the 1st experiment, the SAFIR method relied primarily limited on the questionnaire section, dealing with the assessments of driving task to be performed and automated systems acceptance and usefulness. For the 2nd experiment, each of the scenarios ended additionally with an occlusion of all screens, at which point we implemented the SAFIR protocol (as
outlined above). The average length of the SAFIR protocol is about 3 minutes from the end of the occlusion until the loading of the next scenario, though this varied at times when more in depth responses were offered by the participants.
At the end of the last scenario in the last block, we offered a debrief and arranged for payment of the participants. The average time to complete the entire experiment from initial data collection interview to final post-freeze question was approximately 4 hours.
2.4 Participants
There were 32 participants involved in both experiment 1 and 2, 16 experienced drivers (6 female, 10 male, avg. age 24) with an average driving experience of 63700 km (from 15.000 to 150.000 total driving experience), and 16 novices (9 female, 7 male, avg. age 20) that had their driving license for less than three years and with an average driving experience of 2700 km (up to 9000km).
3. Results
3.1 Experiment 1: Investigate effects of vehicle automation in normal driving conditions
3.1.1 Objective
This first experiment implemented investigated the Task Difficulty and Annoyance experienced by the car drivers when they perform a manual driving task which involved following a lead car in congested urban highway traffic. These manual driving responses were then compared with responses for 2 types of automated driving systems: (1) an L3 automation system which generates takeover warnings for the drivers in case of unsafe following distance, requiring them to intervene by pressing a button, and (2) an L4 automated driving system which regulates itself, managing the longitudinal and lateral control of the car without any action required of the human driver.
We studied drivers’ behaviours and subjective feelings during manual driving (corresponded to the “current baseline” in terms of effort experienced and/or driving performance) and their expectations towards future driving systems able to manage this normal traffic situation. To this end, a similar questionnaire was applied for the 3 LoA in order to study “how Useful” and “how Acceptable” an automated driving system would be (for manual control) or was (regarding the L3 and L4 systems simulated in the study).
3.1.2 Task to be performed and driving scenarios for Experiment 1
The simulated scenario involved drivers following a lead car with an average approximate speed between 55 and 60 km/h on an urban highway. The average speed for the scenario was less than the posted 90km/h speed limit due to congested traffic conditions, with several cars around the ego vehicle braking down to between 15 to 20 km/h at regular intervals, and then quickly reaccelerating to approximately 60 km/h. Participants were asked to regulate their
position in traffic, following the lead car in the right lane, and asked to maintain safe following distances.
In manual mode, the participants were responsible for maintaining continuous control over pedal usage, with regular activation of the brake and accelerator pedals to maintain a safe following distance. In the Level 3 Automation mode, audio-visual TORs were sent to the driver when the L3 system reached its limits, requiring an intervention from the driver (via a button press, see Figure 1) to support the system's decision to activate an automatic braking in charge to keep a safe following distance with the lead car. In Level 4 automated mode, the driver was not required to provide any input about vehicle regulation, and was assigned to the role of a "passive passenger" of the car, however experiencing the automatic management of the driving situations, as performed by the L4 system.
The vehicle regulation for the automation systems were programmed to maintain 1.8 seconds following distance, based on the Envelope Zones of COSMODRIVE simulation model ([BOR 16]), which provided guidelines for maintaining a safe following distance from the human driver’s point of view.
Figure 1. Interface and buttons for Experiment 1
For each of the 3 driving modes we collected several types of data including questionnaires, driving performance metrics, and eye-tracking. The driving modes were presented in an ascending order from manual control to L3 and L4 automation. We chose this approach to avoid influencing manual responses with strategies used by the automated driving systems. The questionnaires covered subjective responses about Task Annoyance, Task Difficulty, Usefulness of the Driving Aids (expected or assessed). These were rated on a continuous scale of 1-100, apart from change awareness, which was nominal.
3.1.3 Main Results
All participants successfully managed the situation in manual mode, and adapted to the automation systems during the nearly 6-minute scenarios. There were no collisions or errors that resulted in catastrophic failure for the scenarios. It is a common enough scenario that even the novices were able to handle it with no trouble.
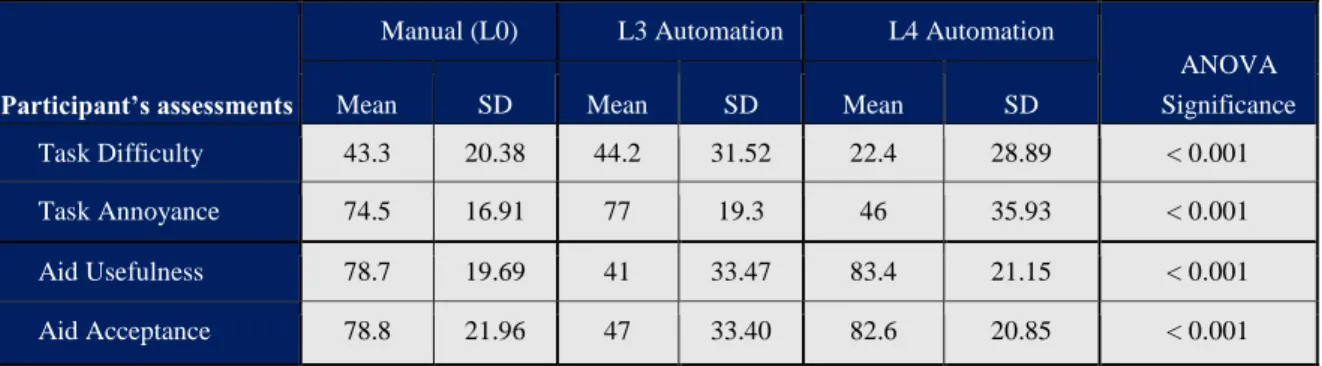
The results we obtained (ANOVA presented in Table 2) showed statistically significant differences between Manual driving, L3 Automation driving, and L4 Automation driving, for
the 4 dimensions investigated in this experiment (i.e. task Difficulty, Annoyance, Usefulness of the assistance and driving aid Acceptance).
Participant’s assessments
Manual (L0) L3 Automation L4 Automation
ANOVA Significance
Mean SD Mean SD Mean SD
Task Difficulty 43.3 20.38 44.2 31.52 22.4 28.89 < 0.001
Task Annoyance 74.5 16.91 77 19.3 46 35.93 < 0.001
Aid Usefulness 78.7 19.69 41 33.47 83.4 21.15 < 0.001
Aid Acceptance 78.8 21.96 47 33.40 82.6 20.85 < 0.001
Table 2. Driving task difficulty & annoyance and Aid usefulness & acceptance, according to the level of automation
Statistical analyses based on Post-hoc tests (Bonferroni) provided more detailed results about these significant differences, regarding both the task to be performed and the driving aid systems:
Regarding the Task Difficulty, performing the driving task with the L4 automation system taking full responsibility for the driving task, the participants reported that the scenario was assessed by the participants as significantly less difficult (22%, p < 0.001) than both Manual driving (43%) and L3 (44%).
Similarly, the Task Annoyance was assessed as significantly (p < 0.001) lower for L4 (46%) than either Manual mode (75%) or L3 automation (77%). This task was assessed as highly annoying in manual and L3, but transferring full responsibility for driving tasks to the more self-reliant automation system significantly lowered the intensity of negative feelings about the scenario.
Regarding Usefulness, L3 automation was assessed as significantly less Useful (41% versus 79%; p < 0.001) than L4 automation. Additionally, the usefulness scores for the higher level automation matched the “expected usefulness” that participants reported during manual driving (79%).
The system Acceptance is significantly (p < 0.001) higher for L4 (83%) than L3 (47%). Again, L4 obtained an acceptance score close to the “expected acceptance” ratings of driving aid systems during manual driving (79%).
Regarding the Driving Experience effects, it must be also noted that the difficulty experienced by the 16 novice drivers in the manual control mode was significantly (p < 0.018) higher than the 16 more experienced drivers (52% and 35% for difficulty scores, respectively) and a similar tendency also appeared towards the L3 automation (54% versus 35%, p = 0.08). By contrast, the Acceptance score obtained by the L4 automation system requiring no input was similarly high for both novices (85% of acceptance) and experienced drivers (80%).
3.2. Experiment 2: Investigate effects of vehicle automation in critical driving conditions
3.2.1 Objective
The second experiment was focused more specifically on how automation can impact driver behaviour and cognition in critical moments during common driving scenarios. In this experiment, participants looked at 4 scenario types which are common traffic situations where the criticality of the situation can rapidly escalate. These scenario types were presented in 4 individual driving mode blocks, with progressive increases in criticality and level of automation for each block. In manual driving tasks the situations are to be handled normally, establishing baseline responses. This is compared with an L3 automated system that requests input from the drivers with a TOR to make a choice about the avoidance manoeuvre, and an L4 automated system that handles the situation without any input required from the driver.
The goal for this experiment was to identify how drivers rate Criticality at the moment of freeze, Future Criticality in the next few seconds after the freeze, how well the situation was managed by either themselves or the automation systems (Self Management or System
Management, respectively), and “how Useful” the participants thought a potential driving aid
systems would be (for manual driving conditions), or “how Useful” and “Acceptable” automated systems were assessed (in the case of management by a L3 or a L4 automation).
Additionally, driver input will be captured and recorded, including steering wheel, brake and accelerator pedal activation, and vehicle location for all elements, including those rebuilt during the SAFIR protocol. We also have eye-tracking software providing us with information about participants’ gaze data related to predetermined areas of interest pertinent to the critical events in the scenarios.
3.2.2 Task to be performed and driving scenarios for Experiment 2
In this experiment, drivers were given the primary task of following a simulated white Mini Cooper on a two-lane urban motorway at an indicated speed of 90 km/h, with occasional increase or decrease in speeds based on traffic conditions. The participants had to manoeuvre their way through several common traffic events, such as braking and passing to manoeuvre around other vehicles. While most of the manoeuvres were routine and mundane in nature, all the scenarios in the critical and post-critical variations ended with an irregular situation that needed to be addressed.
Each participant completed a battery of 16 scenarios, covering 3 levels of criticality, and 3 levels of automation. The scenarios were split into 4 blocks, with each block increasing in both criticality and level of automation. These blocks, or driving modes (DM), were called:
● DM1 = Manual Control/Pre-critical: a critical situation was just beginning to develop ● DM2 = Manual Control/Critical: the critical situation had become apparent to the
participant
● DM3 = SAE level 3 Automation (Button input request/Critical): at a critical moment the participant is prompted to decide for the automation by pressing a button associated with one of three manoeuvre options (swerve left, swerve right, or brake,
see Figure 2). Participant kept both hands on the wheel until prompted for interaction as with level 3 automation systems currently available on the market.
● DM4 = SAE level 4 Automation/Post-critical: the critical situation is resolved by the automation system, while the participant observes and “passively” experiences the system response.
Figure 2. Interface and buttons for Experiment 2
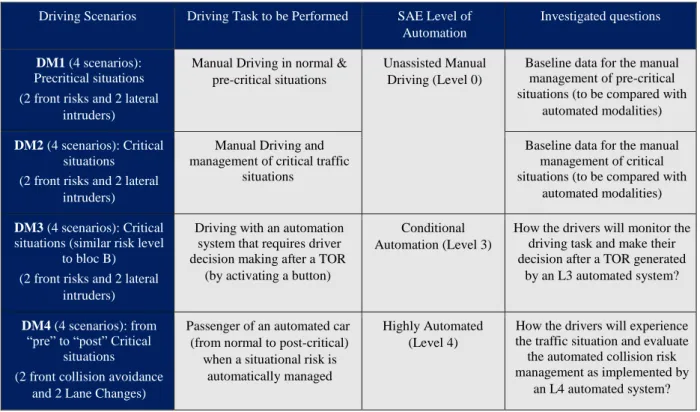
The experiment was divided into 4 blocks, as described in Table 3. Within each of these blocks, there were 4 scenarios of key interest:
1) A stalled vehicle in the right lane requiring an evasive manoeuvre (front risk/lane change)
2) A vehicle that is braking to a stop requiring either equally hard braking, or an evasive manoeuvre to the right, into the emergency lane (front risk/collision avoidance) 3) A vehicle merging into traffic from a motorway entrance (lateral intruder/lane change) 4) A vehicle swerving across traffic from the left lane across to an exit ramp (lateral
intruder/front collision avoidance)
The DM1 and DM2 scenarios established a baseline, L3 investigated how participants made their decision and reacted when receiving a take-over request, while Level 4 investigated how participants’ opinions and metrics change when they transfer full responsibility to the automation and do not need to intervene in any way. Additionally, these scenarios were presented with variations in the vehicles’ colours and positions to avoid any feeling of replication.
At the end of each scenario, in all blocks, participants completed the SAFIR protocol. This was used to evaluate participants’ Situational Awareness (SA) and sets the scene for the questions that follow in a verbal questionnaire protocol. This questionnaire includes questions about situation Criticality at the freeze, anticipated criticality in the near future, Self
Management of manual control the situations or by responding to the TOR for L3
automation, System Efficiency of the L3 or L4 automated systems, and Usefulness of the systems (as expected in manual driving modes or assessed in automated driving modes).
Driving Scenarios Driving Task to be Performed SAE Level of Automation
Investigated questions DM1 (4 scenarios):
Precritical situations (2 front risks and 2 lateral
intruders)
Manual Driving in normal & pre-critical situations
Unassisted Manual Driving (Level 0)
Baseline data for the manual management of pre-critical situations (to be compared with
automated modalities)
DM2 (4 scenarios): Critical situations (2 front risks and 2 lateral
intruders)
Manual Driving and management of critical traffic
situations
Baseline data for the manual management of critical situations (to be compared with
automated modalities)
DM3 (4 scenarios): Critical situations (similar risk level
to bloc B) (2 front risks and 2 lateral
intruders)
Driving with an automation system that requires driver decision making after a TOR
(by activating a button)
Conditional Automation (Level 3)
How the drivers will monitor the driving task and make their decision after a TOR generated
by an L3 automated system?
DM4 (4 scenarios): from “pre” to “post” Critical
situations (2 front collision avoidance
and 2 Lane Changes)
Passenger of an automated car (from normal to post-critical) when a situational risk is
automatically managed
Highly Automated (Level 4)
How the drivers will experience the traffic situation and evaluate the automated collision risk management as implemented by
an L4 automated system?
Table 3. Driving Scenarios and driving tasks to be performed, per SAE level of automation (see Table 1)
3.2.3 Main Results
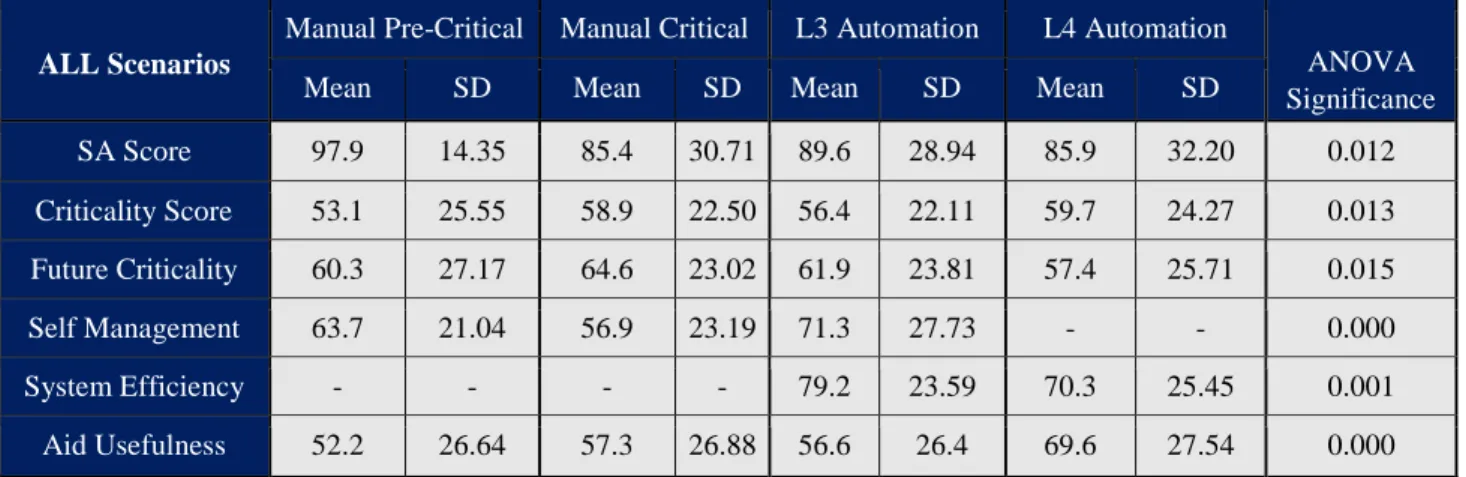
The Table 4 presents the main results regarding the effect of Vehicle Automation (VA) on Drivers’ Situation Awareness and situational Criticality assessment (current or future). Post hoc tests (Bonferroni) indicated that all the differences presented in this table 4 are indeed related to Pre-Critical states of the traffic situation, but do not concern the Critical moment. Essentially, it means that we found no evidence in this experiment indicating either a negative or positive effect of VA on drivers’ SA and Risk Awareness for our critical scenarios. However, one interesting result is that the L4 automation system obtained a significantly higher score (70%) regarding its Usefulness for managing critical driving situation when compared to L3 automation (57%) and both manual conditions (52% and 57% respectively).
Finally, when we look at the eye tracking data, we found interesting results regarding the general behaviour of the two groups as well. It was more particularly the case in L4 automated driving conditions. In these scenarios, experienced drivers spent proportionally more time looking at the Areas of Interest (AOIs) in front of them (Novices allocated 23% of total recorded gaze time against 33% for Experienced drivers; p-value = 0.0115), and not as much time as the novices looking at what was happening behind them (9.6% of total recorded gaze time for Novices versus 5.82% for Experienced; p-value = 0.0028).
ALL Scenarios
Manual Pre-Critical Manual Critical L3 Automation L4 Automation
ANOVA Significance
Mean SD Mean SD Mean SD Mean SD
SA Score 97.9 14.35 85.4 30.71 89.6 28.94 85.9 32.20 0.012 Criticality Score 53.1 25.55 58.9 22.50 56.4 22.11 59.7 24.27 0.013 Future Criticality 60.3 27.17 64.6 23.02 61.9 23.81 57.4 25.71 0.015 Self Management 63.7 21.04 56.9 23.19 71.3 27.73 - - 0.000 System Efficiency - - - - 79.2 23.59 70.3 25.45 0.001 Aid Usefulness 52.2 26.64 57.3 26.88 56.6 26.4 69.6 27.54 0.000
Table 4.Drivers’ Situation Awareness score and Assessments, according to the level of automation
Moreover, when considering the LOA effects on all participants’ visual scanning, more specifically when considering the last 5 seconds of the driving scenarios as illustrated in Figure 3, there was an increase in the percentage of time not looking at pertinent Areas of Interest (i.e. lead car, rear view mirror, merging vehicles, etc…) as automation increased, with the highest off-AOI scores occurring in the L3 automation block. Due to hardware limitations in the experiment, it was impossible to capture data on glances at the visual elements of the automated audio-visual warning system for L3 automation, so this increase in the total time ‘off-AOI’ may be partially caused by participants looking at, and responding to, the system interface.
Figure 3.Visual scanning during the last 5 seconds of the scenarios (all the participants)
Nevertheless, eye-tracking data also showed that in manual modes, participants spent more time looking forward at the AOIs in front of the vehicle (Manual Pre-critical = 32.8% of total recorded gaze time; Manual Critical = 33.2%), while the percentage of time spent looking forward dropped with level 3 and 4 automation (L3 automation = 19.6% of total recorded gaze time; L4 automation = 25.7%). In support of this, we found that the results were reversed if we looked at rearward looking AOIs (Manual Pre-critical = 3.6% of total recorded gaze time, Manual Critical = 6.2%; L3 automation = 9.47%; L4 automation = 8.5%). In other words, it seems that the vehicle automation leads to increases the drivers’ pattern of looking rearward for rebuilding their SA after an automated driving phase, at least in the frame of the driving scenarios we are investigating in this experiment.
Manual (8 Scenarios) Novice Experienced ANOVA Significance Mean SD Mean SD SA score 93.2 23.64 90.1 25.78 NS Criticality score 59.5 23.88 52.5 24.11 0.0201
Future Criticality score 67.1 24.95 57.8 24.71 0.0028
Self management 57.1 21.70 63.4 22.65 0.0233
System Usefulness (expectations) 51.95 28.36 57.45 25.01 NS
L3 Automation (4 Scenarios) Novice Experienced ANOVA Significance Mean SD Mean SD SA score 91. 7 25.96 87.5 31.79 NS Criticality score 62.3 21.25 50.5 21.52 0.00224
Future Criticality score 68.2 22.09 55.6 23.96 0.00239
Self Management (TOR response) 72.9 25.23 69.8 30.14 NS
System Efficiency 81.2 23.93 77.2 23.26 NS
System Usefulness 59.8 24.42 53.4 28.06 NS
L4 Automation (4 Scenarios) Novice Experienced ANOVA
Significance
Mean SD Mean SD
SA score 82.3 36.45 89.6 27.21 NS
Criticality score 64.5 24.21 54.8 23.51 0.02224
Future Criticality score 63.7 25.99 51 23.99 0.00482
System Efficiency 73.7 22.77 67 27.66 NS
Table 5. Comparisons of Novice versus Experienced drivers’ assessments, for manual and automated driving
When considering driving experience effects, we found some interesting differences (presented in table 5). The most consistent of these results was that in every modality, novice drivers scored criticality and future criticality higher than their more experienced compatriots (see tables below for values). With manual driving, more experienced drivers are more confident in their self management, or ability to manage the situation, than novice drivers, and that the less experienced drivers view the L4 automation as more useful to manage the situation, compared to more experienced drivers.
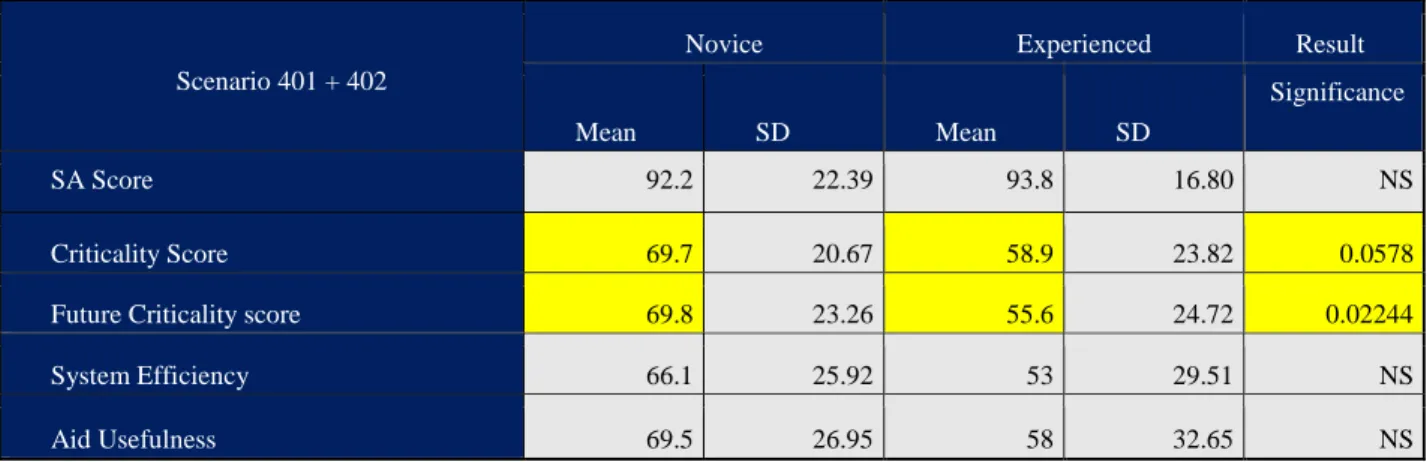
Another interesting result (Table 6) appears when analysing the 4 driving scenarios performed with the L4 automation system. Indeed, for two of these scenarios, the manoeuvres were based on atypical strategies that were less predictable, and riskier in order to avoid a front collision with the obstacle (compared with an automatic emergency braking manoeuvre, or an overtaking manoeuvre, which were implemented in the other 2 scenarios). In the first case, the system opted to accelerate towards the stalled vehicle before implementing a lane change (to the left), and in the second case, it avoids the collision by going into the emergency lane to the right.
Scenario 401 + 402
Novice Experienced Result
Mean SD Mean SD
Significance
SA Score 92.2 22.39 93.8 16.80 NS
Criticality Score 69.7 20.67 58.9 23.82 0.0578
Future Criticality score 69.8 23.26 55.6 24.72 0.02244
System Efficiency 66.1 25.92 53 29.51 NS
Aid Usefulness 69.5 26.95 58 32.65 NS
Table 6. Comparisons of Novice versus Experienced drivers’ assessments, for manual and automated driving
While these two less predictable manoeuvres led to significant differences, with the experienced drivers rating criticality lower, there was no significant difference found for the automated scenarios where the system chose a more predictable response. This difference indicates that novice drivers assess the automation system’s decisions as riskier when it opts to make a less predictable manoeuvres, potentially due to a lower understanding of the situations.
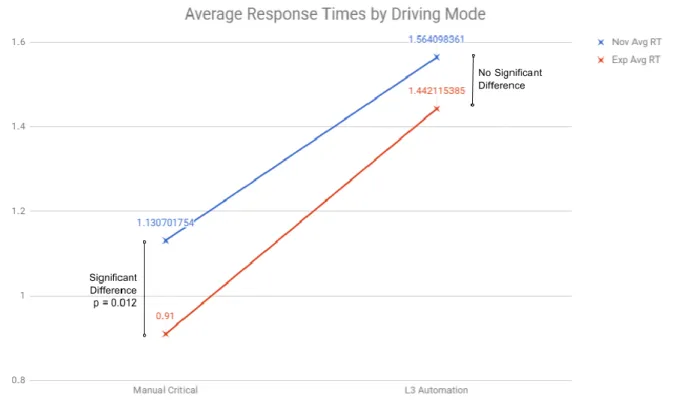
When considering reaction time when faced with a hazard (Figure 4), we matched the criticality at the moment of freeze for the critical Manual control scenarios and the L3 automation scenarios, so that the only change between the two conditions was the level of automation and the required reaction feedback from the driver (i.e. steering and pedal input in
manual driving and responding to the TOR by pressing a button for L3). With the automation, there was significant increases in reaction times for both Novices (Manual: 1.13s; L3: 1.56s; p= 4.71e-07), and Experienced drivers (Manual: 0.91s; L3: 1.44s; p= 6.92e-10). This could be explained by an “out of the loop” effect due to vehicle automation, which would result in participants having a higher reaction time for making their decision and/or acting, regardless of their level of driving experience, when faced with a similar critical event.
Additionally, the reaction time for Experienced drivers (0.91 s) was significantly lower than the novice drivers (1.13 s) in Manual control scenarios (p = 0.012), but with automation, the difference between the two was not significant (Novice: 1.56; Experienced: 1.44; p= 0.11). This result could be explained by the fact that all participants have limited/no exposure to automation systems, while the difference in manual driving experience may have an impact on performance in that modality.
Figure 4. Reaction time after a critical event for Manual Driving vs L3 Automation
4 Discussion
These two experiments, while using a similar methodological approach, covered two very different types of traffic scenarios. One rather mundane task where automation would primarily benefit the drivers in the avoidance of boredom and the negative effects of focusing on a monotonous and repetitive task, and a critical moment where the changes are more dramatic and quick. The SAFIR method protocol is still flexible enough to be used for these two very different kinds of scenarios and still provide good insight.
4.1 Discussion of Experiment 1 results
All these results collected for experiment 1 indicated that, for the Traffic Jam Situation, the L4 automation provides a very helpful and highly accepted assistance, significantly reducing the driving task difficulty and annoyance. Results for usefulness and acceptance also showed L4 being received far better scores than L3 automation. In fact, we saw a scores drop by nearly half from Manual to L3 automation for both metrics.
It is evident in this task that the participants are more than willing to pass the bulk of the responsibility for the driving task to a self-sufficient automated driving system. By contrast, an automation system that automates some, but not all, of the tasks, and requires driver to respond to input requests, does not present any subjective improvement over manual driving for the participants, and fails to meet expectations for a good assistance system.
As the regulation manoeuvres performed by the L4 automation system in this experiment are based on COSMODRIVE model strategies (simulating real human drivers’ activities) these results also indicate that a fully automated driving system able to reproduce real drivers’ behaviour could be an interesting way to support human drivers in an efficient way and to increase its acceptance. By contrast, the L3 automation system that we simulated in this experiment, which generates take-over requests for the driver provide input to the decision-making process, was assessed as not useful and was poorly accepted.
While this information is useful in building up our cognitive modelling objectives, a second experiment - including more detailed data and analysis about drivers' cognitive processes and behaviours - was implemented to further explore LoA effects in critical contexts.
4.2 Discussion of Experiment 2 results
When we look at the results obtained from the 2nd experiment, we can categorize them into 2 main effects: the effects of level of automation and the effects of level of driving experience. Regarding the LoA effects, we found that the L4 automation in this experiment was viewed as significantly more useful at managing critical situations than automation that involved driver input and ended up being viewed as more helpful than participants had anticipated, indicating that the this L4 system was subjectively assessed more useful than any of the participants had expected. Essentially, once the driver is removed from the decision-making process, they gain a significantly better opinion about how useful automation is.
However, we also had several results that indicated certain negative effects that are associated with the driver being “out of the loop” due to vehicle automation. Firstly, we found that these systems lead to drivers’ spending more time looking at mirrors at critical moments
in order to maintain a good level of situation awareness. We also found that there were slower reaction times in L3 automation. Participants ended up taking more time for making their decision and/or for acting, independently of their level of driving experience, when facing to a similar critical event with L3 automation. As this block had approximately the same level of criticality as Manual Critical, we can sufficiently say that increasing automation is the explanation for this increase in reaction time.
When we looked at the effects for level of experience, one of the earliest and strongest findings we had with this experiment was that criticality and future criticality were consistently rated higher in both manual and the L3 automation modalities by novices than more experienced drivers. This is where we saw the clearest, most consistent difference between the two groups. We have ample evidence, presented in tables 5 and 6 above, to support the claim that novices view criticality significantly different than the experienced drivers. Additionally, novice drivers assess decisions by the L4 automation as more risky than experienced drivers when the automation made less predictable manoeuvres. There is strong potential that all of these elevated criticality ratings are due to a lower level of comprehension and understanding of the situations, as they are still relatively novel situations that haven’t been seen enough for the novice users to have created well developed, robust mental representations of the situations.
In addition, we found that Novice drivers were looking around at the situation more than Experienced driver in driving situations where the L4 automation did not require driver input for decision making. These more elevated and diffused/confused/disorganized visual scanning observed among the novice drivers in these L4 conditions could be the result of a poor mental representations of the traffic situation, compared to the experienced drivers. It could explain why novices assess the situation as more critical: while the experienced drivers primarily focus their attention on the main critical event and its management by the L4 system, novice share their visual attention with all other AOI to better understand the situation around them. Due to the time constraint, their SA at the freeze moment would be more confused compared to experienced drivers, and their feeling regarding the situational criticality higher.
5. From empirical studies to cognitive modelling and simulation
5.1 Objective
Beyond implementation of experiments, the last objective of this research was also to use the empirical data collected during these 2 experiments to enhance the COSMODRIVE model (for COgnitive Simulation MOdel of the DRIVEr) developed at IFSTTAR, in order to simulate driving activity as a dynamic ‘‘Perception–Decision–Action” regulation loop managed from drivers’ mental representations ([BEL 09]). As mental models of the traffic situation that correspond to the driver’s situation awareness, these mental representations actively direct the driver’s visual scanning of the road environment, as well as guide their driving behaviour, in order to ensure a continual and dynamic adaptation to the traffic situation.
5.2 Main Results
The collected empirical data that we considered most relevant to this approach were the visual scanning strategies captured with the Tobii eye tracking system during experiment 2, and the driving behaviours associated with decision-making performed by the participants which were recorded on PSiCoSyHM driving simulator.
5.2.1 Modelling and simulation of visual scanning with COSMODRIVE model
Synthetically, there are 2 main ways to model and simulate visual scanning with COSMODRIVE model. The first one (currently implemented in COSMODRIVE, as illustrated in Figure 5 below) is to “replay” eye tracking data previously recorded among real human drivers, by dynamically and progressively implementing the sequence of fixation points performed by the drivers in a given driving scenario.
Figure 5. Replaying visual scanning with COSMODRIVE, from Eye tracking data collected among a real driver
From this first approach (as previously implemented in [BEL 12]), the principle idea is to use the eye tracking data file recorded among a given participant as “input” and to “replay” this data file with COSMODRIVE’s virtual eye. Then, the sequence of fixation points that is generated as “output” by the virtual eye of COSMODRIVE based simulation may be compared to sequences of fixation points observed in real drivers, in order to ensure that it is capable of replicating a variety of human eye tracking performances. Additionally, because the virtual eye allows COSMODRIVE to progressively build its mental representation with the information extracted from the road scene, this replay approach may be also used to progressively “feed” the COSMODRIVE algorithms that integrate the visual information collected by the virtual eye into the mental model. With this information, it is possible to simulate “What” and “When” these visual elements are perceived, and “How” they are finally integrated into the drivers’ Situation Awareness.
The second approach is to model - from empirical data – the “patterns of visual scanning”, by selecting and playing one of these patterns according to the drivers’ situation awareness,
and their risk assessment, in accordance with the cognitive processes they implemented to make their decision.
Currently, this second approach is being used to emulate L3 automation: a specific modelling work was implemented to simulate visual scanning patterns used by the drivers immediately following the TOR to rebuild their situation awareness after the automated driving phase. With the information gained from these visual scanning patterns, which facilitate their reintegration into the loop of control, the drivers have to make the decision to press one of 3 possible buttons, each associated with a specific manoeuvre (braking, lane changing to the Left, or lane changing to the right), in order to activate the most appropriate driving action to be implemented by the L3 system. Two main visual strategies were modelled from our empirical data previously collected, depending if the driver observed or not the audio/visual interface before pressing the button. The next step will be dedicated to the validation of such pattern-based simulations by systematically comparing COSMODRIVE’s visual scanning with the eye tracking data recorded from real drivers during our 2 experiments.
5.2.2 Modelling and simulation of decision-making behaviours
In the frame of our experiments, 6 of the 16 driving scenarios investigated in experiment 2 (2 for manual pre-critical, 2 for manual critical and 2 for L3 automation) dealt with the decision-making between lane change or braking in case of a frontal collision risk occurrence due to a slow or a stopped vehicle. In the COSMODRIVE model, decision-making is based on the “driving schemas” and the “envelope-zones” theories ([BEL 09]). Both of these theories are associated with a cognitive process known as “mental simulation,” which aims to predict the future collision risks with other vehicles, respectively associated with different alternative actions liable to be implemented in a given situation ([BOR 16]). The following figure illustrates this risk assessment based on a cognitive deployment regarding a Lane Change manoeuvre (to be compared by the decision cognitive process with risks computed for alternative strategies like braking).
Figure 6.Simulation with COSMODRIVE of the decision making to manage a front
collision risk (from a Lane Change versus a Braking)
This cognitive process of decision-making is implemented in COSMODRIVE for manual driving, and the development of such simulation functionalities is currently in progress regarding the L3 automation (activation of a button by the driver when receiving a Take Over Request from a simulated ADAS system) as investigated in our 2nd experiment. This
modelling effort is supported by the in-depth analyses of both visual scanning and driving behaviours.
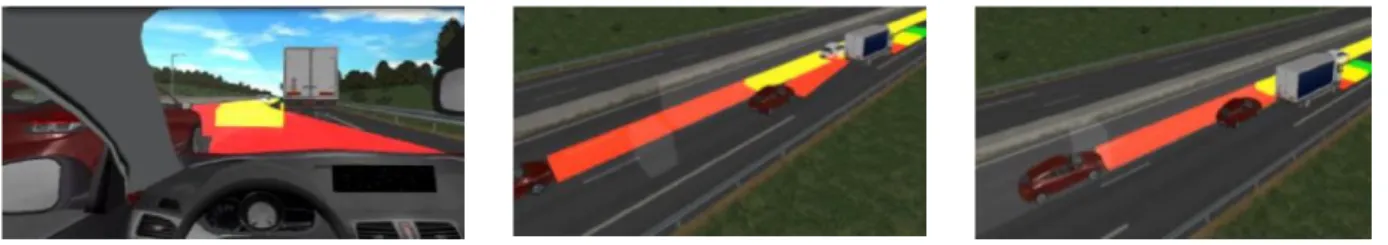
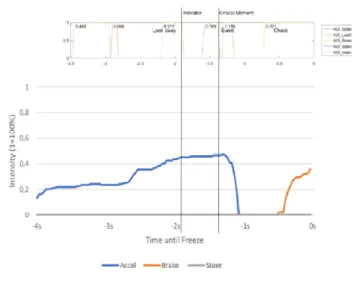
Figure 7, which was created using the data collected in experiment 2, illustrates this approach by considering 2 typical examples of drivers’ behaviours collected for the same driving scenario (i.e. a vehicle entering the roadway and merging into traffic from the right), according to their respective level of driving experience. Regarding the experienced driver (left section), the participant immediately observed the critical event area (AOI “InsertRight”) while lifting off the accelerator pedal, then looking at the lead car (AOI “LeadCar”), and then glancing at the rearview mirror (AOI “Rearview”) while braking. All this sequence was performed in 1 second, and immediately after the detection of the critical event. By contrast, the novice driver (right section) first observed the Lead Car, then detected the critical event (i.e. AOI “Insert-Right”) and observed it while lifting off the accelerator pedal, and then he glanced the rearview mirror while braking, like the experienced driver, but with a global reaction time of more than 1.5 seconds.
A) Example coming from an experienced driver B) Example coming from a novice driver
Figure 7.2 typical examples of visual scanning and actions on vehicle control recorded for the same manual driving scenario performed by an experienced driver versus a
novice driver.
From these types of in-depth analyses (currently in progress), the ultimate aim will be to simulate these kinds of different driving performance, including visual scanning, decision making and driving action implemented, with the COSMODRIVE model.
5.3 Future perspectives about vehicle automation effects modelling and simulation
This type of integrated COSMODRIVE-based simulation of drivers’ visual scanning patterns, cognitive processes, and driving behaviours will be of a great interest in the future to
support the Virtual Human Centred Design of Vehicle Automation and HMI based on eye tracking monitoring functions ([BEL 12]).
The first expected advantage of this virtual design approach is the possibility of using COSMODRIVE as a “virtual model of the future end-users” in the earliest stages of the design process when costly mock-ups or prototypes to support experiments with real drivers are not feasible/available.
The second expected advantage is related to the simulation of human drivers’ errors, or accident risks due to visual distraction in case of unassisted driving, and then to support the identification of particular “instances” of driving scenarios (ie. providing a set of “reference scenarios”) becoming more particularly critical in case of a distracted driver (as simulated and captured by COSMODRIVE’s visual scanning).
And finally, when the monitoring functions are virtually designed and developed, COSMODRIVE-based simulation could be also used to test and improve their effectiveness and their efficiency. This could be done by checking, for instance, if COSMODRIVE would be able to adequately manage the risk in the frame of the previously mentioned “scenarios of reference” when supported by such monitoring functions, or not.
Of course, a lot of effort still needs to be done to reach all these challenging objectives, but the work implemented during our 2 simulator studies has helped us make significant progress towards a future simulation platform able to support the virtual human centred design of vehicle automation.
6. Conclusion
In this paper, we presented two experiments based on similar methodological approach, however covered two very different types of traffic scenarios. One rather mundane task where automation would primarily benefit the drivers in the avoidance of boredom and the negative effects of focusing on a monotonous and repetitive task, and a critical moment where the changes are more dramatic and quick. Finally, the SAFIR method protocol is still flexible enough to be used for these two very different kinds of scenarios and still provide good insight.
With all the results acquired from these experiments, we see more clearly how automation may affect behavioural routines and actions, as well as the cognitive processes like Situation Awareness, risk assessment and decision-making performed by the driver under different levels of automation, and how this can be integrated in a cognitive simulation model like COSMODRIVE. In both experiments we also found that participants preferred higher L4 LOA than L3 automation, regardless of how much driving experience they had amassed. With eye-tracking, we found an increase in the percentage of time not looking at pertinent Areas of Interest as automation increased, with the highest off-AOI scores occurring in the L3 automation block, but this increase in the total time ‘off-AOI’ may be partially caused by hardware limitations in the experiment. It also showed that the percentage of time spent looking forward dropped with level 3 and 4 automation. When considering reaction time with the L3 automation, there was significant increases in reaction times for both novice and experienced drivers compared to manual driving conditions. Finally, regarding driving experience effect, one of the clearest and most prominent findings is that novices consistently
rated criticality and future criticality higher than experienced drivers, in every driving mode, and experienced drivers are more confident in their self management in manual driving than novice drivers. We also noted that when we looked at all participants together, regardless of experience level, there was no clear pattern for Criticality, however, Future Criticality decreased with increasing levels of automation.
In addition, we have yet begun the heavy task of analysing our empirical data for being integrated into the COSMODRIVE modelling framework, but now we have results that will allow us to include differentiating interpersonal and situational factors in the model. The inclusion of these differentiators will aid us in our ultimate objective of creating a more robust and holistic model of the human driver that can be used in the future to model and understand how and why human drivers would react, according to their driving experience, the criticality of the driving situations and/or to the Level of vehicle automation.
Acknowledgements
This research is being conducted within the framework of the Marie Curie Initial Training Network (ITN) HFAuto - Human Factors of Automated Driving Project (PITN-GA-2013-605817).
7. References
[BAI 04] BAILLY B., Conscience de la situation des conducteurs: Aspects fondamentaux, méthodes, et application pour la formation des conducteurs, Thèse de doctorat, Université Lumière-Lyon II, 2004.
[BAI 03] BAILLY B., BELLET T., GOUPIL C., « Drivers’ mental representations : experimental sutdy and training perspectives», in International Conference on Driver Behaviour and Training, 1st, Stratford-Upon-Avon, United Kingdom, 2003.
[BAI 83] BAINBRIDGE L., « Ironies of Automation », Analysis, Design and Evaluation of Man-Machine Systems, pp. 129-135, 1982.
[BAN 08] BANET A., BELLET T., « Risk awareness and criticality assessment of driving situation: a comparative study between motorcyclists and car drivers », IET Intelligent Transport Systems, 2(4), pp. 241-248, 2008.
[BAN 12] BANET A., BELLET T., « Towards a conceptual model of motorcyclists’ Risk Awareness: A comparative study of riding experience effect on hazard detection and situational criticality assessment », Accident Analysis & Prevention, 49, pp. 154-164, 2012.
[BEL 09] BELLET T., BAILLY-ASUNI, B., MAYENOBE P., BANET A., « A theoretical and methodological framework for studying and modelling drivers’ mental representations », Safety Science, 47(9), pp. 1205-1221, 2009.
[BEL 11] BELLET T., HOC J.M.,BOVERIE, S., BOY,G., From human-machine interaction to cooperation: towards automobile co-piloting, 2011.
[BEL 18] BELLET T., PARIS J.C.,MARIN-LAMELLET C., « Difficulties experienced by older drivers during their regular driving and their expectations towards Advanced Driving Aid Systems and vehicle automation. », Transportation research part F: traffic psychology and behaviour, 52, pp. 138-163, 2018.
[BEL 12] BELLET T., MAYENOBE P.,BORNARD J.C.,GRUYER D.,CLAVERIE B., « A computational model of the car driver interfaced with a simulation platform for future Virtual Human Centred Design applications: COSMOSIVIC », Engineering Applications of Artificial Intelligence, 25(7), pp. 1488-1504, 2012.
[BOR 16] BORNARD J.C.,SASSMAN M.,BELLET T., « Use of a computational simulation model of drivers’ cognition to predict decision making and behaviour while driving. », Biologically Inspired Cognitive Architectures, 15, 4150, 2016.
[BRO 94] BROOKHUIS K., WAARD D.D., MULDER B.E.N., « Measuring driving performance by car-following in traffic. », Ergonomics, 37(3), pp. 427-434, 1994.
[CHI 09] CHIMI C.J.,RUSSELL D.L., « The Likert scale: A proposal for improvement using quasi-continuous variables. », in Information Systems Education Conference, Washington, DC, 2009. <http://citeseerx.ist.psu.edu/viewdoc/download?doi=10.1.1.467.646&rep=rep1&type=pdf>
[DAV 85] DAVIS F.D., A technology acceptance model for empirically testing new end-user information systems: Theory and results, Thèse de doctorat, Massachusetts Institute of Technology, 1985.
[DEW 14] DE WINTER J.C.., HAPPEE, R., MARTENS M.H., STANTON N.A., « Effects of adaptive cruise control and highly automated driving on workload and situation awareness: A review of the empirical
evidence. », Transportation research part F: traffic psychology and behavior, 27, pp. 196-217, 2014.
[END 95] ENDSLEY M.R., « Toward a theory of situation awareness in dynamic systems. », Human Factors, 37, pp. 85-104, 1995.