CHARACTERIZATION OF MICROSTRUCTURE AND
MECHANICAL BEHAVIOUR OF HEAT AFFECTED
ZONES IN ROBOTIC ARC WELDING OF AA6061-T6
by
Zeli ARHUMAH
THESIS PRESENTED TO ÉCOLE DE TECHNOLOGIE SUPÉRIEURE
IN PARTIAL FULFILLMENT FOR A MASTER’S DEGREE
WITH THESIS IN MECHANICAL ENGINEERING
M.A.Sc.
MONTREAL, APRIL 24, 2019
ÉCOLE DE TECHNOLOGIE SUPÉRIEURE
UNIVERSITÉ DU QUÉBEC
This Creative Commons licence allows readers to download this work and share it with others as long as the author is credited. The content of this work cannot be modified in any way or used commercially.
BOARD OF EXAMINERS THIS THESIS HAS BEEN EVALUATED BY THE FOLLOWING BOARD OF EXAMINERS
Prof. Tan Pham, Thesis Supervisor
Département de génie mécanique, École de technologie supérieure Prof. Van-Ngan Le, President of the Board of Examiners
Département de génie mécanique, École de technologie supérieure
Dr. Fatemeh Mirakhorli, Member of the jury
National research council of Canada, Saguenay, QC, Canada
THIS THESIS WAS DEFENDED
IN THE PRESENCE OF A BOARD OF EXAMINERS AND THE PUBLIC MARCH 29, 2019
ACKNOWLEDGMENT
I would like to express my sincere appreciation to my supervisor Prof. Tan Pham for his patience, motivation, and extensive knowledge.
I would also like to acknowledge the Libyan Ministry of Education for providing me the opportunity to pursue my master`s studies and for recommending me for the scholarship offered.
I would like to thank Professor Van-Ngan Le and Dr. Fatemeh Mirakhorli for spending time and valuable comments as jury members.
Finally, I would like to thank my family and my friends for supporting me spiritually throughout my studies.
Caractérisation de la microstructure et propriétés mécaniques de la zone affectée thermiquement dans le soudage robotisé à l'arc de AA6061-T6
Zeli ARHUMAH RÉSUMÉ
Le soudage GMAW de l'aluminium AA6061-T6 introduit un changement dans les propriétés mécaniques de la zone affectée thermiquement (ZAT) en modifiant la microstructure obtenue par vieillissement. La variation du cycle thermique de soudage à travers la ZAT produit différentes propriétés mécaniques des sous-zones dans la ZAT. L’objectif de cette étude est de caractériser la variation des propriétés mécaniques dans les sous-zones de la ZAT et de les corréler avec les cycles thermiques de soudage. Dans cette étude, les cycles thermiques de soudage, les propriétés microstructurales et mécaniques des plaques d'aluminium soudées AA6061-T6 ont été étudiées dans deux différentes configurations. Le robot Yaskawa intégrée avec l’équipement de soudage à l’arc Fronius Trans Plus Synergic 4000 et le métal d’apport A4043 ont été utilisés pour le soudage GMAW. Les cycles thermiques de soudage ont été obtenus expérimentalement à partir de différents emplacements de plaques soudées. À l'aide du logiciel SYSWELD, la source de chaleur est ajustée à partir des températures mesurées et de la taille de la zone fondue. Les simulations numériques ont été réalisées pour évaluer la répartition de la chaleur dans les plaques soudées. Le modèle numérique fournit une approximation acceptable comparée avec les températures mesurées. La caractérisation des propriétés mécaniques a été obtenue en utilisant un essai de microdureté sur la coupe transversale de la plaque soudée. La carte 2D est utilisée pour illustrer la microdureté. De plus, le comportement mécanique et la déformation locale dans les sous-zones de la ZAT ont été étudiés à l'aide d'un essai de traction micro-plat avec corrélation d'images numériques (DIC). Les propriétés mécaniques des sous-zones de la ZAT étaient corrélées au cycle thermique de soudage ainsi qu’à la microstructure de la ZAT étudiée expérimentalement. Il a été observé que le cycle thermique de soudage fait une variation importante de la microstructure à travers de la ZAT, qui influence à son tour de manière significative sur les propriétés de la ZAT. La transformation des précipités βʺ vers βʹ et β est la cause de ces changements.
Mots-clés: Zone affectée thermiquement (ZAT), Cycle thermique, Microdureté, Microtension, Corrélation d'images numériques (DIC), SYSWELD, Propriétés mécaniques
Characterization of microstructure and mechanical behaviour of heat affected zone in robotic arc welding of AA6061-T6
Zeli ARHUMAH ABSTRACT
GMAW welding of aluminum AA6061-T6 introduce changes in the mechanical properties of the heat affected zone (HAZ) by changing the microstructure obtained from heat treatment. The variation of the welding thermal cycle across the HAZ produces different mechanical properties in subzones of the HAZ. The purpose of this investigation is to investigate the variation of the microstructure and mechanical behaviour in the HAZ subzones and correlate these subzones with the welding thermal cycle. In this study, the welding thermal cycle, and the microstructural and mechanical properties of welded aluminum AA6061-T6 plates were studied. The plates were prepared and welded in two different configurations using a Yaskawa robot integrated with Fronius Trans Plus Synergic 4000 arc welding equipment and metal filler AA4043. The welding thermal cycle was obtained experimentally from different locations on the welded plates. Using SYSWELD software the heat source was adjusted using the thermal cycle obtained from the experimental work and the size of the welding pool to reproduce the welding thermal cycle. Simulation was performed to observe the heat distribution in two configurations of the welded plate. The numerical model offers an adequate approximation to the welding thermal profile measured during the welding process. The characterization of mechanical properties was obtained using a microhardness test on welding cross section and a 2D map used to illustrate the microhardness at the welding cross section. Moreover, mechanical behavior and local deformation in subzones of the heat affected zone were investigated using digital image correlation (DIC) with a micro-flat tensile test. The mechanical properties of subzones of the HAZ were correlated with the welding thermal cycle as well as with the microstructure of the HAZ that was investigated experimentally. It was observed that the welding thermal cycle controls the variation of the microstructure across the HAZ, which significantly effects the mechanical behaviour of the HAZ. The change of precipitates sequence from βʺ to βʹ and β explains these changes.
Keywords: Heat affected zone (HAZ), Thermal cycle, Microhardness, Micro-tensile, Digital image correlation (DIC), SYSWELD, Mechanical properties.
TABLE OF CONTENTS
Page
INTRODUCTION ...1
CHAPTER 1 LITERATURE REVIEW ...3
1.1 Aluminum alloys ...3
1.2 Properties of aluminum ...4
1.3 Aluminium magnesium silicon alloys (6XXX series) ...4
1.4 Strength in 6XXX ...5
1.4.1 Alloying elements in 6XXX ... 5
1.4.2 Precipitation sequence in 6xxx ... 6
1.4.3 Hardening Mechanisms in Heat-Treatable Alloys ... 9
1.4.4 Precipitation Hardening (Heat Treatment) of Aluminum Alloy 6061-T6 ... 10
1.4.4.1 Solution Heat Treatment ... 11
1.4.4.2 Precipitation Heat Treatment ... 12
1.5 Gas Metal Arc Welding (GMAW) ...13
1.5.1 Welding Thermal Cycle ... 15
1.5.1.1 Thermal Cycle Measurement ... 16
1.6 Heat Affected Zone ...17
1.6.1 Microstructure of the heat affected zone ... 19
1.6.1 Mechanical Properties of HAZ ... 22
1.6.1.1 Correlation between welding thermal history and hardness across HAZ ... 23
1.6.1.2 Mechanical properties characterization of HAZ ... 24
1.7 Summary ...27
CHAPTER 2 EXPERIMENTAL PROCEDURE ...29
2.1 Welding Equipment and Material Used ...31
2.2 Sample preparation before welding ...33
2.3 Welding parameters and configuration ...33
2.4 Welding thermal cycle measurement ...35
2.5 Procedures for characterisation of HAZ ...36
2.5.1 Microstructure characterisation ... 36
2.5.2 Mechanical Characterisation ... 37
2.5.2.1 Microhardness Tests ... 37
2.5.2.2 Micro flat tensile test with DIC transverse to welding direction ... 38
2.5.2.3 Micro flat tensile test for samples extracted parallel to welding direction ... 41
CHAPTER 3 THERMAL ANALYSIS OF TWO GMAW CONFIGURATIONS ...43
3.1 Welding thermal profile ...43
3.2 Sysweld models ...46
3.2.1 Heat source used in SYSWELD ... 47
3.2.2 Mesh and boundary condition ... 49
3.2.3 Calibrating the heat source of the vertical plate ... 50
3.2.3.1 Thermal profile ... 51
3.2.3.2 Comparison between experimental and FE thermal profile ... 53
3.2.4 Adjusting heat source of the horizontal plate ... 54
3.2.4.1 Thermal profile ... 54
3.2.4.2 Comparison between experimental and FE thermal profile ... 57
CHAPTER 4 CHARACTERIZATION OF MICROSTRUCTURE AND MECHANICAL PROPERTIES ...59
4.1 Heat affected zone width ...59
4.2 Microstructure characterization of HAZ ...62
4.2.1 Grain growth in HAZ ... 64
4.3 Mechanical characterization of HAZ in vertically welded plate ...66
4.3.1 Microhardness behaviour across the HAZ ... 67
4.3.2 MFT parallel to the welding line ... 69
4.3.3 Micro-flat tensile test (DIC) ... 74
4.3.3.1 Local behaviour of welded specimen from MFT test with DIC ... 75
4.3.3.2 Local behaviour of HAZ ... 78
4.3.4 Local behaviour of HAZ subzones in welded plate obtained by DIC ... 80
4.3.5 Local Stress–Strain properties obtained using DIC test in welded sample... 81
CONCLUSION ...89
RECOMMENDATIONS ...91
APPENDIX I WELDED SAMPLES EXPERIMENTAL THERMAL PROFILE CAPTURE WITH THERMOCOUPLES ...93
APPENDIX II THERMAL DISTRIBUTION CALCULATED BY SYSWELD ...97
APPENDIX III MICROHARDNESS PROFILE IN TWO CONFIGURATIONS ...99
APPENDIX IV MICROFLAT TENSILE TEST (DIC) ...103
LIST OF TABLES
Page
Table 1.1 Phase transformation during aging of Al-Si-Mg alloys. ...7
Table 2.1 Chemical composition of the base metals ...32
Table 2.2 Mechanical properties of base metal 6061-T6 and filler wire ...32
Table 2.3 Chemical composition of filler wire ...33
Table 2.4 Welding parameters for two plate configurations ...33
Table 2.5 Location of thermocouples for temperature measurement. ...34
Table 3.1 Standard deviation of peak temperature in horizontally welded plate ...43
Table 3.2 Standard deviation of peak temperature in vertical welded plate ...45
Table 3.3 Gaussian 3D conical heat source parameters for vertical plate ...50
Table 3.4 Heating and cooling rate of Exp and FE vertically welded plate ...52
Table 3.5 Difference in% of peak temperatures in vertically welded plate ...54
Table 3.6 Gaussian 3D conical heat source parameters for horizantal plate ...55
Table 3.7 Heating and cooling rate of Exp and FE horizontal plate ...56
Table 3.8 Difference in % of peak temperatures in horizontally welded configuration ...58
Table 4.1 Shows microhardness and peak temperature with the MFT result for each specimen parallel to weld ...70
Table 4.2 Shows microhardness and peak temperature with the MFT result of each specimen parallel to weld ...71
LIST OF FIGURES
Page
Figure 1.1 GP Zone Al-Mg-Si (6xxx) [13] ...7
Figure 1.2 Transmission electron micrograph showing a, c) βʺ (needle-shaped) , and b, d) βʹ (rod-shaped) precipitates [17]. ...8
Figure 1.3 The interaction between the particle and dislocation (a) Orowan looping, (b) particle cutting [18] ...9
Figure 1.4 Main role of the age hardening mechanism [19] ...10
Figure 1.5 Two stages of precipitation hardening in (T6) heat treatment ...11
Figure 1.6 Phase diagram for precipitation-hardenable Mg2Si aluminum ...12
Figure 1.7 Strength vs aging time ...13
Figure 1.8 Schematic of gas metal arc welding process, a) process overall, b) fusion area [23]. ...14
Figure 1.9 a) Welded plate, b) different temperature at different points ...15
Figure 1.10 Precipitation transformation through multistage thermal processing of (Al-Mg-Si) alloy during welding and PWHT [17] ...17
Figure 1.11 Cross-section of (a) direct electric arc welding; (b) indirect electric arc welding ...18
Figure 1.12 Grain size Mechanical properties relation of A356 alloy [33] ...20
Figure 1.13 Microstructure changes through a fusion joining method. a) cooling slope of welding thermal. b) different microstructures in different HAZ subzones [26]. ...21
Figure 1.14 Heat effected zone of 6082-T6 aluminium; a) hardness profile; b) precipitate βʹ during cooling; c) hardness profile after aging [37]. ...24
Figure 1.15 The illustration of the test setup of DIC to characterise the local material properties [38]. ...25
Figure 1.16 Global strain of the specimens estimated with extensometer, local deformation fields characterised using DIC [43] ...26
Figure 2.1 Schematic representation of experimental procedure ...30
Figure 2.2 (a) Welding robot, b) Fronius Trans Plus Synergic power supply ...31
Figure 2.3 (a) Horizontal welding configuration; b) Vertical welding configuration ...34
Figure 2.4 Location of installed thermocouples ...35
Figure 2.5 Extracted specimen from the a) horizontal welded plate, b) vertical welded plate ...36
Figure 2.6 Polished and etched sample for microstructure characterisation extracted from horizontally welded plate ...37
Figure 2.7 Distribution of microhardness indention ...38
Figure 2.8 DIC of machined samples transverse to the weld direction, a) and b) machined specimen, c) and d) the extracted samples. ...39
Figure 2.9 Speckle patterns for DIC ...40
Figure 2.10 Set up of micro tensile test with DIC ...41
Figure 2.11 HAZ extracted micro-tensile specimens parallel to welding line, dimensions in mm, a) and b) machined specimen, c) and d) the extracted DIC samples. ...42
Figure 3.1 Experimental thermal profile recorded by four TCs on each side of welding line in horizontally welded plate ...44
Figure 3.2 Experimental thermal profile of vertical plate ...45
Figure 3.3 SYSWELD simulation process ...47
Figure 3.4 Conical Gaussian volumetric heat source model ...48
Figure 3.5 Mesh for simulation (with 1mm size in the HAZ, and 3mm outside the HAZ)...49
Figure 3.6 Thermal distribution at the moment when the heat source was in the center of the part. ...50
Figure 3.7 Simulated thermal profiles at the same locations as the 4 thermocouples ...51
Figure 3.9 Thermal profile of vertical plate, a) thermal profile comparison between experimental results and finite element simulation of points at different distances from the welding center line, b) peak temperature comparison ...53 Figure 3.10 Thermal profile of 4 nodes in the horizontally welded
configuration corresponded to the location of TCs ...55 Figure 3.11 Thermal distribution in horizontal welded plate ...56 Figure 3.12 Melting zone ...57 Figure 3.13 Thermal profile of horizontal plate, a) thermal profile comparison
between experimental and finite element simulation from points at different distances from the welding center line, b) peak temperature comparison ...58 Figure 4.1 Comparison between HAZ of optical image (discolouration)
of welding cross section and FE result. ...60 Figure 4.2 HAZ width characterised by microhardness profile on
sample cross section in horizontal plate ...60 Figure 4.3 Size of HAZ in vertical welded sample ...61 Figure 4.4 Base metal of 6061-T6, a) coarse second phase particles
distributed randomly, b) grain size of base metal. ...62 Figure 4.5 Light optical micrographs of microstructure of FZ and PMZ;
a) grains in FZ, b) low melting phases segregated on the grain boundary, c) The interface between the HAZ and fusion zone showing fine microscopic hot cracks, d) high magnification of figure (c) ...63 Figure 4.6 The relationship between average of grain growth and peak
temperature across the HAZ ...65 Figure 4.7 Light optical micrographs of recrystallization and grain growth;
a) zone adjacent to FZ, b) gradual change of grain size ...66 Figure 4.8 Correlation between thermal cycle and microhardness values in HAZ ...67 Figure 4.9 Correlation between grain size, microhardness, and
peak temperature across the HAZ. ...68 Figure 4.10 Cutting arrangement for the machined sample ...69
Figure 4.11 Microhardness measurement locations in the MFT samples ...70 Figure 4.12 Stress- strain for different specimen extracted from different HAZ,
a) Test 1, b) Test 2 ...72 Figure 4.13 Tensile properties in different zones, a) Test 1, b) Test 2 ...73 Figure 4.14 Global response (stress-strain) curves for welded sample
and parent metal ...74 Figure 4.15 Illustration of distribution of local in-plane strain acquired using
DIC equivalent to different strains (corresponding to 24.mm specimen gauge length) for two specimens ...75 Figure 4.16 Average value of ԑXX and ԑYY in transverse weld direction for
three stages of stress/strain condition. a) 126 MPa_0.5%, b) 202 MPa_2.4% and, c) 225 MPa_5.1% illustrating local in plane strain
localisation zones ...77 Figure 4.17 Illustration of distribution of local in-plane strain acquired using
DIC equivalent to different strains (corresponding to 24.mm specimen gauge length) in the HAZ ...78 Figure 4.18 Average value of ԑXX and ԑYY in transverse weld direction for
three stages of stress/strain condition. a) 160MPa-0.9%, b) 210 MPa-4.1% and c) 225 MPa-5.1% showing local in plane strain concentration zones ...79 Figure 4.19 (a) Local strain-time for different locations on the welded sample,
b) shows the location of local strain investigated (BM & HAZ & FZ) ...81 Figure 4.20 (a) Stress-local strain in different locations obtained by DIC
for welded sample, (b) close-up of figure (a). ...82 Figure 4.21 Average stress-strain behaviour (DIC measurements) for welded
joint, fracture planes in HAZ (Z1 and Z2) compared with base metal thermal cycle distribution across gauge length of DIC test specimen ...83 Figure 4.22 Thermal history of extracted samples for DIC test,
a) fusion zone, b) HAZ. ...84 Figure 4.23 Correlations between mechanical properties and peak
temperature profile along FZ and HAZ ...85 Figure 4.24 Correlations between mechanical properties and peak
LIST OF ABREVIATIONS
BM Base metal
BOP Bead on plate
DIC Digital image correlation Exp Experimental FEM Finite element method
FZ Fusion zone
GMAW Gas metal arc welding HAZ Heat affected zone MFT Micro flat tensile test MAG Metal inert gas OM Optical microscopy PMZ Partially melted zone
TS Travel speed of welding torch TEM Transmission electron microscopy WD Welded direction
WFS Wire feeding speed WCL Welding center line Z Zone
LIST OF SYMBOLS G Temperature gradient HV Vickers hardness I Arc amperage k0 Bessel function k Thermal conductivity
MPa Mega Pascal
nm Nanometer
Q Heat input
R Distance from heat source
T Temperature
TC Thermocouple
T0 Initial temperature
T6 Heat treatment
t Time
UTS Ultimate tensile strength
V Arc voltage
v Velocity of heat source
W Width of subzone Wt % Weight percentage YS Yield strength α Thermal diffusivity β Mg2Si precipitate Ɛxx Strain in X direction Ɛyy Strain in Y direction ΔH Change in hardness η Efficiency
INTRODUCTION
Aluminum and aluminum alloys have been broadly used in many different applications such as the aviation and automotive industries, as well as used as an alternative to steel because of their mechanical properties, low-weight and good corrosion resistance properties [1]. These properties have encouraged the spread of aluminum alloys which has made it the second most used metal in manufacturing after steel. Alloying elements and heat treatment affect the strength and process-ability of aluminum alloys, these alloys such as 6xxx & 7xxx have had their strength enhanced by precipitation-hardening and this increases the scientific and manufacturing interest especially in the aluminum alloy 6xxx series due to its extrudability and mechanical properties.
The 6xxx series aluminum alloys which contain mainly (Al-Si-Mg-Cu) have many advantages: for instance, good strength to weight ratio, extrudability, weldability, and good corrosion properties. It obtains its strength from a precipitate of Magnesium silicide (Mg2Si)
phase during heat treatment. Since the heat plays the main role in producing the alloy’s properties, welding heat input causes major changes in the metallurgy of the heat affected zone [2]. Observations on the microstructure and mechanical behaviour of the welded specimen showed that to obtain optimum mechanical properties it is crucial to obtain homogeneously distribution of Mg2Si precipitates and to control their size. Heating and
cooling rate are the main variables to be controlled; for maintaining the fine grain structure and homogeneous distribution of Mg2Si precipitates, hence the welding as joining process of
aluminum alloys gains great importance.
Welding is a conventional manufacturing method for aluminum that has been widely used for many different applications. Gas metal arc welding (GMAW) is a joining technique utilised to manufacture aluminum parts and is a complicated method that involves different phenomena such as thermal, mechanical and metallurgical-chemical changes. A comparison between welding methods shows that; GMAW has several benefits such as producing high quality welds, flexibility, low cost, and the potential for full automation that results in high manufacturing efficiency.
Developments in welding processes have made aluminum alloys a target candidate for welding in manufacturing. Advanced automatic welding robots have minimised the heat input, and the thermal history variation along the welding line as a consequence of instability of welding speed.
Heat treatable aluminum alloys suffer significant loss of their mechanical strength caused by the welding thermal cycle. It introduces changes in the microstructure that lead to changes in the final mechanical properties of the area that is adjacent to the welding line (HAZ). These changes significantly depend on the thermal cycle and the base material properties. The variation of the welding thermal cycle introduces a different extent of metallurgical changes that lead to variations in the mechanical properties across the HAZ; these changes may be characterised in subzones based on the temperature attained in each zone.
An investigation is desirable to study the mechanical behaviour and microstructure of the HAZ and correlate it with the variation of the welding thermal profile. This study focuses on characterising the mechanical properties of welded aluminum alloy AA6061-T6 by robotic GMAW welding. The present investigation includes five chapters. The first chapter presents the theory and the literature review about the properties of aluminum alloy 6XXX series, GMAW robotic welding process, welding thermal cycle, and heat affected zone as a key point about the subject. The second chapter is reserved for the experimental procedure used in this study and its outcomes. The third chapter presents the numerical simulation of heat distribution and calculation of material properties for two welding configurations using Sysweld software. The fourth and fifth chapters contain the results and discussion in which welding thermal profiles obtained from two different configurations are presented visually by graphs and compared with the simulation result obtained from the Sysweld software. Moreover, the influence of welding thermal history on microstructure and mechanical behaviour was examined using microhardness and micro-tensile test with DIC to observe the local mechanical response in different zones within the HAZ. Finally, a correlation between welding thermal history, microstructure and mechanical properties in the HAZ was established. All the results observed were deliberated using the physical metallurgy in terms of the characterisation the mechanical properties of the HAZ.
CHAPTER 1 LITERATURE REVIEW
Investigation of the welding thermal cycle and characterization of the mechanical properties and microstructure for welded aluminum are an important consideration. Much research has been established to characterise the mechanical behaviour of the HAZ. Different methods have been used to correlate between the welding thermal cycle, microstructure and mechanical properties. This chapter will examine a range of aluminum alloys and the properties of these alloys in summary. This will be followed by the strengthening in heat treatable aluminum alloys. Also, the GMAW process will be described as well as the problems associated with aluminum welding, with a particular focus on 6xxx series aluminum alloys. A summary of previous studies about the influence of thermal history on microstructure and mechanical behaviour of welded aluminum will be provided to explain the phenomena that underlie the microscopic transformation of aluminum alloy during the fusion welding process.
1.1 Aluminum alloys
Aluminum alloys can be divided to non heat-treatable alloys such as the 1xxx, 3xxx, 5xxx series and heat-treatable alloys such as the 2xxx, 6xxx, 7xxx series. The mechanical properties of heat-treatable alloys such as the 6xxx series (Al-Mg-Si) alloys can be improved by heat-treatment, while non-heat-treatable alloys can be work hardened to improve their strength [3, 4].
Cold working can be used to improve the properties of non heat treatable alloys. These alloys are 1xxx series which are pure aluminum, 3xxx series which are known for their high formability, 4xxx series which have good fluidity, and 5xxx series which have good corrosion resistance and moderate strength. In heat-treatable alloys, the structure of the alloy is stabilised by heat treatment and consequently its strength is increased. 2xxx alloys are used
in the aviation industry and for high temperature applications. Due to high strength of 6xxx series alloys are appropriate for extrusion with moderate properties, non-corrodibility and high weldability. 7xxx series alloys have high strength but their strength drops to unacceptable levels after fusion welding and they are susceptible to hot crack. Due to their strength, heat-treatable alloys are commonly used in many different applications [1]. The main interest of this study is the heat-treatable AA6061-T6 alloy, which gains its mechanical properties from a heat treatment that precipitates fine particles of Mg2Si [5, 6].
1.2 Properties of aluminum
There are many properties that attract researchers to focus on aluminum alloys. These properties can be summarised as follows [7]:
• Low density compared to steel; aluminum has only one third the density of steel, • High resistance to a wide range of liquids, atmospheric gases and weather, • Used as decorative material owing to high reflectivity,
• Its strength can be equal to that of normal construction steel,
• The high elasticity of aluminum can be an advantage under shock loads, • Under low temperatures aluminum alloys preserve their toughness, • Aluminum has good malleability and can be rolled to very thin foils,
• High conductivity to heat and electricity; approximately 50 % to 60 %, and 63% respectively of copper [8].
1.3 Aluminium magnesium silicon alloys (6XXX series)
The high strength aluminum alloys are used in many different applications. 2xxx and 7xxx aluminum alloys are used widely in the aviation industry and the automotive industry. 6xxx series aluminum alloys are of particular interest to the aviation industry (such as fuselage casings) and automobile manufacturing (for frames, bumpers and panels) because of its desirable combination of properties. There are many advantages of 6xxx aluminum alloys
including medium to high strength, extrudability, and good weldability. The weather resistance of 6xxx alloys is higher than 7xxx alloys, which are traditionally used in the aviation industry. 7xxx and 2xxx alloys are susceptible to intergranular attack. Moreover, 6xxx alloys are inexpensive and are particularly important to the aviation industry which relies on 2xxx and 7xxx alloys [9].
The component responsible for the high strength of 6xxx alloys is magnesium silicide Mg2Si.
Depending on the alloy designation, it may contain a small amount of manganese, zinc, copper and chromium. 6xxx series alloys are used widely in the welding fabrication industry, they are used mainly in extrusion, and are merged with various structural components [10]. 6xxx alloys are susceptible to weld cracking, therefore, it is recommended to weld them using filler material with arc welding. Hot cracking can be avoided using filler metals that contain high proportions of silicon such as AA4043 filler. In 6xxx heat-treatable alloys, the changes in microstructure and mechanical properties are complex and mainly depend on the welding conditions applied [3, 7].
1.4 Strength in 6XXX
Aluminum-silicon-magnesium alloy is one of the heat treatable alloys. Its strength after heat treatment can be increased threefold compared to its properties prior to heat treatment. There are two main factors that influence the strength in aluminum 6xxx: the alloying elements and the heat treatment stages or age hardening of the alloy.
1.4.1 Alloying elements in 6XXX
The principal elements responsible for strengthening the 6xxx series alloys are magnesium and silicon. 6xxx alloys acquire their strength during heat treatment, mainly from the precipitation hardening phase, Mg2Si. The 6061-T6 alloy also includes traces of some other
elements such as manganese, chromium, copper and iron, which provide many favourable properties to the alloy.
The material properties depend upon the formation of metastable, completely coherent and stable semi-coherent and incoherent precipitates during aging as shown in Table 1.1. The table illustrates three important transformations that affect the strengthening of the alloy [10]. There are several previous studies that link the reliance of engineering strength on microstructure, specifically the characteristics, dimensions and forms of precipitates.
1.4.2 Precipitation sequence in 6xxx
Precipitation hardening is the arrangement of tremendously small dispersed particles of a second phase in the main phase matrix, which is achieved by heat treatment. The chemical composition of Al6061-T6 shows that the alloy is formed with a definite Mg:Si ratio (1.73:1) to form the quasi-binary Al-Mg2Si system, and it increases its strength by precipitation of
metastable βʺ before the equilibrium β Mg2Si phase. Therefore, understanding the phase
transformation sequence during artificial aging is critical for a comprehensive understanding and to estimate the effect of the welding thermal history on the mechanical behavior of the alloy [11].
In general, the precipitation sequence of alloys containing Al-Mg-Si can be separated into the following phases: α (SSS) → GP zones → βʺ → βʹ → β.
Table 1.1 Phase transformation during aging of Al-Si-Mg alloys Phase Coherency Remarks
GP zone βʺ βʹ β Coherent Coherent Simi-coherent Incoherent Spherical
Needle shape with round cross-section and completely coherent in aluminum matrix
Rods with ellipsoidal cross-section and generally coherent but end of rods is incoherent to the matrix
Plates; totally incoherent to aluminum matrix
The overall precipitation sequence was summarised by Miao [12] with the crystal structures, morphology and metastable phases as shown in Table 1.1. During heat treatment, it first forms α (SSS), the super saturated solid solution which forms after quenching. The atoms then form Guinier-Preston (GP) zones (also called clusters) as presented in Figure 1.1.
Figure 1.1 GP Zone Al-Mg-Si (6xxx) [13]
Needle along three orthogonal ˂100˃ directions
[100]
[010] Rod along [100]
During artificial aging, the βʺ phase starts to form as fine needle shaped precipitates which contribute to the peak strength of the alloy. Continuing the artificial aging results in a growing βʺ and form βʹ phase which represents rod-like precipitates (circular cross section). The crystal structure in this phase is more defined and less cohesive with the matrix of the solvent. The growing of βʹ results in an equilibrium β phase (Mg2Si) which is typically
formed as plate [14] as shown in Figure 1.2.
There is a fine line that separates the three phase transformations and a short timespan between the precipitation hardening and the over-aging of the material. Exposing the material to a temperature for longer than required during artificial aging can result in the precipitates growing too large, dispersed, and becoming totally incoherent to the material matrix [15, 16]. This transformation causes the material to lose strength and become softer.
Figure 1.2 Transmission electron micrograph showing a, c) βʺ (needle-shaped), and b, d) βʹ (rod-shaped) precipitates [17]
1.4.3 Hardening Mechanisms in Heat-Treatable Alloys
The properties of an age heat-treatable alloy are determined by the interplay of the distributed precipitate phase with dislocation. The interaction between the dislocations and the distributed particles will raise the critical resolved shear stress (RSS). Depending on how the dislocation penetrates the precipitated particles, two groups can be formed: Dislocation can loop around the particle or cut the precipitates [18].
Figure 1.3 The interaction between the particle and dislocation (a) Orowan looping, (b) particle cutting [18]
In case of particle looping (known as Orowan looping), the dislocation loops out, and then divides from the looped area leaving one loop around the precipitate as shown in Figure 1.3.a. The loop is shaped around each particle when the dislocation passes the particle. This type of mechanism becomes beneficial when the particles have small diameters and the space between them is small. In contrast, particle cutting occur if particles are small and coherent, when the dislocations glide right through the particle and not are stopped at the particle-dislocation contact as shown Figure 1.3 b.
b Particl Area= A Top view (b) Glide plane (a) (t3) (t2) (t4) d A B
During the artificial aging procedure, the particle cutting mechanism works owing to small particles that precipitate first. As heat treatment continues, the precipitate size grows and looping around the particles becomes easier [19]. The role of hardening during the different stages of age hardening is shown in Figure 1.4.
Figure 1.4 Main role of the age hardening mechanism [19]
1.4.4 Precipitation Hardening (Heat Treatment) of Aluminum Alloy 6061-T6
The term age hardening is used when the material’s strength develops over time. Precipitation hardening of Al6061-T6 is accomplished by two stages; the first stage uses solution heat treatments and the second stage uses precipitation heat treatment, as shown in Figure 1.5 and Figure 1.6 [20].
1.4.4.1 Solution Heat Treatment
The first step of the precipitation hardening procedure is solution heat treatment. The aluminum silicon magnesium solution is heated to a specific temperature, T0, within the α
phase and held until all the β phase (Mg2Si) is totally dissolved. The supersaturated solid
solution is then quenched to room temperature T1 after quenching a supersaturated solid
solution (SSS) of magnesium, silicon, and some other elements formed in aluminum matrix at room temperature.
After this process, the alloy is referred to as T4 temper. The alloy after quenching is said to be a supersaturated solid solution SSS with respect to solute β in solvent α, and the alloy is comparatively soft and weak [20].
Figure 1.5 Two stages of precipitation hardening in (T6) heat treatment Time Solution heat treatment Precipitation heat treatment Quench Te m perature T2 T1 T0 T4 T6
1.4.4.2 Precipitation Heat Treatment
The second stage in the T6 precipitation hardening process is precipitation heat treatment. During this stage, the supersaturated α phase solution is heated to an intermediate temperature between 175˚-195˚C, for a specific period of time within the α + β phase region. Three different time-temperature cycles can be used for aging: one hour at 200˚C, five hours at 175˚C, or eight hours at 165˚C. The three cycles can accomplish the same result T6 [19].
Figure 1.6 Phase diagram for precipitation-hardenable Mg2Si aluminum
During the primary aging time, microscopic clusters, or GP zones, of Mg2Si atoms form at
countless positions in the α phase, as shown on the strength-aging diagram in Figure 1.7. As aging time increases, the constant diffusion of Mg2Si causes the zones to increase their size
The precipitated particles go through two phases, signified as βʺ and βʹ, before the equilibrium phase β forms as finely dispersed particles of Mg2Si. The βʺ phase shows the
peak strength of the aged alloy, which is conserved upon cooling to ambient temperature at the suitable aging time [20].
Figure 1.7 Strength vs aging time
1.5 Gas Metal Arc Welding (GMAW)
Gas metal arc welding (GMAW) is a conventional fusion joining method, which is commonly referred to as metal inert gas (MIG). There are other kinds of aluminum welding methods including: plasma arc welding (PAW), laser-beam welding (LBW), stud welding (SW), gas tungsten arc welding (GTAW), and friction stir welding (FSW).
GMAW and GTAW fusion joining are commonly used to weld aluminum alloys [21]. To facilitate the welding and avoid hot cracking, filler metal is used. Different alloys are compatible with different filler metals depending on the alloying elements in the welded alloys. In the 1940's, GMAW was invented for joining aluminum and other materials. Generally, GMAW is appropriate for thick materials [22].
βʺ βʹ β-Mg2Si Over-Aged Yield Stren gth (ksi ) Aging Time (Hours) Peak Aged
Figure 1.8 Schematic of gas metal arc welding process, a) process overall, b) fusion area [23]
The GMAW method uses inert gas to protect the welding bead. Robotic GMAW welding was used for this investigation owing to its wide range of applications. Moreover, steady welding velocity facilitates the capturing of the welding thermal cycle, since it is eliminating the variation in the thermal cycle along the welding line. Three key factors control the procedure for GMAW of aluminum: the availability of equipment, the welded material thicknesses, and the alloy content [23]. The schematic in Figure 1.8 shows the GMAW process.
1.5.1 Welding Thermal Cycle
Thermal cycle in welding is the variation of temperature over time. It affects the microstructure and the mechanical properties of the welded material. During fusion welding, interaction among the parent metal and the heat source causes a rapid heating and melting in a small volume of the metal during a short time. In the welding pool, the high temperature causes the loss of alloying elements by evaporation, and the absorption of gases such as hydrogen. The properties of the material in the HAZ and fusion zone depend upon the alloy composition and the past processing history of the base and filler material along with the thermal history experienced during welding. As a moving heat source (welding arc) approaches the closest distance to the location of interest, first temperature increases, then gradually decreases. Each point in the material has a different weld thermal cycle as a function of its location relative to the moving heat source as illustrated in Figure 1.9.
a)
b)
Figure 1.9 a) Welded plate, b) different temperature at different points B
A
Location of heat source &
welding direction Points of interest
Weld thermal cycle of location (A)
Tem
perature °C
Welding Time s Weld thermal cycle
There are many analytical solutions used to calculate the thermal cycle and heat distribution. Rosenthal’s solution is used for two and three-dimensional heat flow to calculate the thermal cycles in the workpiece during welding as shown in Equations (1.1) and (1.2).
= ˳ ( 1.1)
= ( 1.2)
1.5.1.1 Thermal Cycle Measurement
Welding temperature can be recorded using different techniques such as thermocouples, non-contact method infrared radiation (IR), or temperature indicating paints. Thermocouples are one of the most reliable methods for recording the thermal profile of welding, used with ceramic tubes to protect the thermocouples from welding spatter especially when the thermocouples are attached near the welding line. Many studies have been conducted to measure the thermal history of welded joints and cooling curves [16, 24].
Because the IR method is based on radiation and requires no physical contact with the workpiece, it is suitable to measure the temperature in the weld pool (fusion zone). In a study conducted by Guoli, the welding temperature profile of AZ31B alloy welded by GTAW was measured by IR, and thermocouples were used to measure the cooling curves. In his study the peening method was used to attach K-type thermocouples to the workpiece, and the thermocouples were connected to the INV306DF data acquisition throw amplifier. A data logger was adjusted to record 10 readings per second, and the result was found to be reliable [25].
Another investigation was carried out by Ambriz to measure the thermal profile during the welding of aluminum alloy using indirect electric arc welding method. In the study, K-type thermocouples were used. The result of the study was that the cooling slopes of the thermal profile correlated with the TTT diagram to explain the transformation that occurred and this predicted the material behavior in the HAZ [26]. V. Malin [27] used temperature indicating paints to capture the welding thermal cycle for AA6061 during GMAW-P. He reported that the maximum reliable temperature recorded was 371°C and he extrapolated until reach the solidus temperature.
1.6 Heat Affected Zone
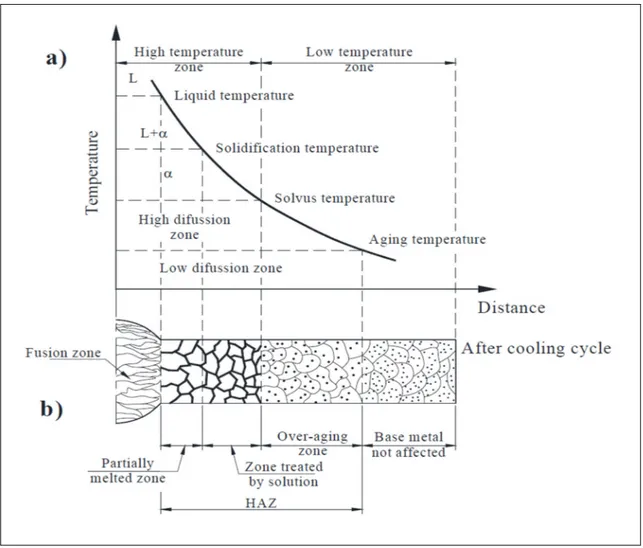
The heat affected zone (HAZ) is the region between the melted zone (nugget) and the unaffected material of base metal. The HAZ is exposed to the most variation in temperature as it is rapidly being heated and cooled. This variation is a function of the distance from the fusion zone. The variation in the thermal cycle introduces variation in the microstructure and mechanichal properties across the HAZ [28, 29].
Figure 1.10 Precipitation transformation through multistage thermal processing of (Al-Mg-Si) alloy during welding and PWHT [17]
Because the temperature during the welding process is not high enough to melt the HAZ, it contains a mix of recrystallization and over aged materials [30]. Typically, increasing the heat input will result in growth of the HAZ size and will degrade the mechanical properties across the HAZ as shown in Figure 1.10. Quenching the welded material to increase its hardness will causes the HAZ to become distorted, as a result the metal must be introduced into its intended uses in as-welded condition. In a study conducted by Ambriz [31], he reported the effect of arc welding on AA6061-T6 microstructure and mechanical properties. The previous study by Ambriz reported that the cause of hot cracking during GMAW was owing to the very high thermal expansion of the aluminum alloys, as well as their wide range of solidification temperatures. The weld was performed on AA6061-T6 alloy using the indirect electric arc (IEA) method, which involves a single weld pass with feeder strips positioned on top of the workpiece. This technique successfully decreased the heat input during the welding which decreased the HAZ size as illustrated in Figure 1.11 . This method requires the base metal to be preheated before welding.
(a) (b) Figure 1.11 Cross-section of (a) direct electric arc welding; (b) indirect electric
arc welding
Ambriz studied the effect of material preheating to 50ºC, 100ºC, and 150ºC on the mechanical properties of the HAZ. He determined that the HAZ size was reduced for both
the 50ºC and the 100ºC preheating treatments, but with the 150ºC preheating treatment it was larger than what would be obtained using single V direct electric arc welding. In Figure 1.11 above, the difference in the HAZ cross-sections of the two welds can be seen.
Hirose [32], performed a study of the heat affected zone in laser welding using AA 6061-T6. More heat input during the welding process caused a lower hardness value in the heat affected zone; consequently, a welding technique with low heat input is desired. In the Hirose study, laser welding with a CO2 laser and TIG welding were performed on a 1-mm thick
piece of AA6061-T6. Hirose reported that the heat affected zone for laser welding was roughly 1/7 to 1/4 of the size of that obtained using TIG welding. Moreover, for laser welding the hardness of the HAZ was almost fully recovered with artificial aging.
1.6.1 Microstructure of the heat affected zone
When the heat affected zone is exposed to the welding thermal cycle, it results in recrystallization, recovery, grain growth and precipitation reaction. The area close to the fusion zone forms large equiaxed grains. In non-heat treatable alloys, the recrystallization process causes the most of the loss of strength that occurs. However, in heat treatable alloys such as 6xxx, grain growth contributes only slightly to overall strength loss as in Figure 1.12. This problem can be mitigated by using grain pinning dispersoids. Figure 1.12 shows that there is no significant effect of grain growth on mechanical properties for heat treatable alloy A356 until the grain size exceeds an average size of 1mm.
Figure 1.12 Grain size Mechanical properties relation of A356 alloy [33]
In heat-treated alloys such as Al-Mg-Si, the thermal cycle introduces severe strength loss. This strength loss is due to the transformation of β" precipitates involving dissolution or coarsening to βʹ or β when exposed to the welding thermal cycle [34]. When the temperature surpasses the solvus temperature in the HAZ, the precipitates βʺ completely dissolve and in cases where the temperature is lower than the dissolving temperature, the precipitate grows and forms βʹ or β.
Figure 1.13 Microstructure changes through a fusion joining method. a) cooling slope of welding thermal. b) different microstructures in different HAZ subzones [26]
The formation of dissolution of the precipitate leads to decreased strength in the HAZ. In the heat affected zone that is located far from the FZ boundary, where the peak temperature does not surpass the solvus temperature, the precipitates suffer either partial dissolution or coarsening. Dissolution and coarsening will differ across the HAZ as a function of thermal cycle peak temperature.
1.6.1 Mechanical Properties of HAZ
The welding thermal cycle causes a degradation of the mechanical properties of the material that is adjacent to the fusion zone. Because the mechanical behaviour depends on the microstructure of the HAZ, many studies have been carried out to determine the effects that welding has on the mechanical properties of the welded materials. In AA6061-T6, the needle shape βʺ precipitate is the main phase that contributes to hardening, and because βʺ is very small (20 - 100 nanometers in length, and 6 nanometers in diameter), it can only be observed via transmission electron microscopy (TEM). However, the contribution to the hardening can be measured using microhardness and tensile strength tests[35].
In a study by V. Malin [27], tensile and hardness tests were performed on a workpiece of AA6061-T6 that had been welded using gas metal arc welding GMAW with a filler wire AA4043. A Knoop microhardness test with a 100-garm load was used to generate a microhardness profile. The hardness measurements were taken transverse to the weld line, and in increments of 0.9 mm and 1.8 mm from the weld line. The study reported that the microhardness profiles in the heat affected zone were around 70% of the base material hardness. Malin also used a helpful representation of hardness distribution across the HAZ to characterise the subzones of the HAZ. Moreover, the average hardness values in these subzones were correlated with the thermal gradient and width of the HAZ. Hardness average across subzones was expressed as:
= (1.3)
where ΔH is the change in hardness values at the borders of the zone, and W is the width of the subzone [27]. During welding, the exposure to high temperature causes grain growth in the HAZ, making it softer and more susceptible to failure. However, in the previous study there was no attempt to measure the grain size in the HAZ and correlate it to thermal cycle
and mechanical properties. The study reported that the yield strength of the AA6061-T6 material before welding was 305MPa, which decreased to an average value of 206MPa after welding. Moreover, seven specimens out of the 12 tested in the study failed in the HAZ. The failure location ranged from 10.16 mm – 11.85 mm from the fusion line.
1.6.1.1 Correlation between welding thermal history and hardness across HAZ
The change in HAZ hardness is caused by the welding thermal cycle, therefore variation in the thermal cycle will cause variation in hardness across the heat affected zone [36]. The correlation between welding peak temperature and microhardness of a gas metal arc process on welded joints was studied by V.Malin. Microhardness and peak temperatures were measured across the welded joints, which were also subjected to tensile tests. The study reported that there is a relationship between the peak temperature and the average hardness value in the HAZ.
It was noted in the investigation by Myhr and Grong [37] as illustrated in Figure 1.14 a, b and c) that the thermal slopes have direct correlation with the mechanical properties of the HAZ. A lower thermal gradient correlates to lower tensile strength in the welded joint. It was also found that the minimum hardness in the HAZ occurred in the region subjected to a temperature between 240°C and 380°C. Two main factors were identified that affect the loss of strength and hardness in the HAZ. The first factor is the peak temperature of the critical zone (zone exposed to a peak temperature range of 240°C - 380°C) and the second factor is the time of its exposure to this critical temperature.
Figure 1.14 Heat effected zone of 6082-T6 aluminium; a) hardness profile; b) precipitate βʹ during cooling; c) hardness profile after aging [37]
1.6.1.2 Mechanical properties characterization of HAZ
The comprehensive properties of the welded material are subject to the distribution of mechanical behaviour across the HAZ. Therefore, it is important to characterise the local mechanical behaviour of subzones in HAZ. An extensometer can measure the average strain over a larger gauge length but not the local variation in strain. Digital image correlation
Har
dness
Distance from fusion line
HAZ
Base Metal
Partly reverted region
Fully re verte d regi on Peak Temperature 220°C 500°C (a) Tem perature Time C-curve for precipitation of βʺ (Mg2Si) 375°C Weld thermal cycle (b) Har dness
Distance from fusion line
Resulting hardness profile Contribution from natural ageing Peak Temperature 220°C 430°C (c)
(DIC) can be used to characterise the local mechanical behaviour and obtain local stress strain curves in different zones within the HAZ [38].
DIC is a technique that applies correlation analysis to study digital images produced while a specimen is under traction test. This method involves capturing repeated images with a high resolution camera while simultaneously applying a load to evaluate the local deformation and characterise the local behavior of the material under incremental loads as shown in Figure 1.15 [39].
Figure 1.15 The illustration of the test setup of DIC to characterise the local material properties [38]
An investigation of the influence of thermal cycle on mechanical behaviour of subzones in the HAZ, must begin with a classification of non-homogenous subzones within the heat affected zone [40, 41]. Many investigations have been conducted in this field to characterise the mechanical properties of GMAW, laser welding and FSW using transverse tensile weld
sample loading and assuming iso-stress conditions. The stress strain results determined by mapping the local strain captured using DIC corresponds to global stress as shown in Figure 1.16 [42, 43].
Lockwood [44] examined the local behaviour of a friction stir welded joint of aluminum alloy AA2024 numerically and experimentally. Measurements of local field deformation were performed on tensile samples using the DIC method. The results obtained for different weld zones were used to establish a 2D finite element model. Evaluation of the model outcomes and the experimental outcomes were used to evaluate the viability and validity of the model.
Figure 1.16 Global strain of the specimens estimated with extensometer, local deformation fields characterised using DIC [43]
A study by Reynolds [45] used a tensile test specimen extracted from the welded region and used the DIC method to determine the mechanical properties of FSW welded joint of aluminum AA5454-O and AA5454-H32. The study characterised the mechanical behaviour
of the material by carrying out a tensile strength test transverse to the weld. The stress strain behaviour of the welded sample was analysed by assuming that the deformation occurs under iso-stress conditions and the weld was a composite material.
Lakshminarayanan [46], studied the influence of single pass welding performed by GMAW, GTAW, and FSW on the mechanical behaviour of welded samples 6.4mm in thickness. The base metal of the butt joint was AA6061-T6 aluminum alloy, and AA4043 was used as filler material. The three joints were compared using microhardness, microstructure, and tensile tests, and fracture surface morphology. The investigation showed that FSW joints have fine microstructure in the weld zone and are superior in terms of mechanical properties to GMAW and GTAW.
1.7 Summary
This literature review was conducted to analyse the influence of welding thermal history on the mechanical behaviour and microstructure of the material. First, the physical metallurgy of aluminum, and aluminum joining processes were investigated in short. Then different investigations were reviewed examining welding thermal cycle, and problems caused by welding including change in microstructure, hardness and mechanical properties response. Finally, analyses of the characterisation of mechanical behaviour of the heat affected zone consisting of experimental investigations were reviewed. This investigation is required to examine the thermal history, microstructural, and mechanical correlations during welding procedures to characterise the mechanical behaviour of the HAZ.
CHAPTER 2
EXPERIMENTAL PROCEDURE
The objective of this experimental investigation was to characterise the microstructure and mechanical properties of the HAZ and correlate them with the welding thermal cycle of 6061-T6, as shown in the flowchart in Figure 2.1.
A robotic welding system was used to perform a gas metal arc welding (GMAW) weld on 6061-T6 plates. Thermocouples integrated with data acquisition were used to capture the welding thermal cycle. SYSWELD software was used to simulate the GMAW of AA 6061-T6 to evaluate the temperature distribution in the HAZ. The thermal profile obtained by experimentation was used to calibrate the heat source. The microstructure transformation of the HAZ was calculated.
Transverse cross-section specimens extracted from the welded samples were used to characterise the microstructure of the HAZ and to generate a microhardness profile for the HAZ and base metal. To characterise the variation of mechanical properties across the HAZ, local stress–strain curves across the HAZ were obtained by transversely loaded DIC sample. More details about each process and characterisation are explained in the following sub sections.
2.1 Welding Equipment and Material Used
As GMAW is a continuously fed wire process, it can easily be mechanised. The welding torch can be used at different welding currents, which are limited only by the welding power source. (GMAW), also known as (MIG), was the method used to generate all the welds in this study.
A DX-100 Yaskawa robot integrated with a standard Fronius Trans Plus Synergic 4000 welding power supply was used for this investigation as illustrated in Figure 2.2 a) and b). The system provides a smooth and steady arc with a pulsed current output and transfers the filler metal to the arc in fine droplets. The flexibility of robotic welding operation means that steadier weld quality can be obtained with fewer defects.
Figure 2.2 a) Welding robot, b) Fronius Trans Plus Synergic power supply b a
Material used
Plates of AA6061- T6 aluminum alloy sizes of (205mm x 50mm x 6mm) and (200mm x 50mm x 10mm) as shown in Figure 2.3 a) and b) were used in this study. The nominal chemical composition of the base material is listed in Table 2.1.
Table 2.1 Chemical composition of the base metals
Al Cu Cr Fe Mn Mg Si Zn Ti
Base Metal (AA 6061)
98.6% 0.15% 0.004% 0.7% 0.15% 0.8% 0.4% 0.25% 0.15%
The T6 designation shows that the plates were solution heat treated and artificially aged to enhance their mechanical properties. The mechanical properties of the plates are provided in Table 2.2.
Table 2.2 Mechanical properties of base metal 6061-T6 and filler wire Type of Material YS (MPa) UTS (MPa) Elongation (%) Hardness (VHN) BM (6061-T6) 276 310 18 107 FW (AA4043) 70 145 22 47 Filler metal
AA4043 filler metal was used with a diameter of 1.2mm. The chemical composition of welding wire illustrated in Table 2.2 contains 5% silicon. This alloy is well known for its fluidity. Using AA4043 as a filler modifies the Si weight percentage in the fusion zone and as a result, the fusion zone is shifted to a composition that is less sensitive to hot cracking.
Table 2.3 Chemical composition of filler wire
Al Cr Cu Fe Mn Mg Si Ti Zn
Filler wire (A4043)
Bal --- 0.3% 0.8% 0.05% 0.05% 5% 0.2% 0.1%
2.2 Sample preparation before welding
All required precautions were taken to avoid defects in the welding process such as lack of penetration, lack of fusion, and porosity. The surfaces of the specimens were cleaned using wire brush to remove the oxide surface film on the plate surfaces and were degreased using acetone. These samples were used directly after preparation to generate bead on plate welds.
2.3 Welding parameters and configuration
The welding parameters were selected for BOP experiments to form a pulsed GMAW arc with spray transfer mode. This mode provides full depth penetration, low porosity, no splatter and good cosmetic appearance which will discussed in the following chapters. Table 2.4 shows the welding parameters that were used in two plate configurations.
Table 2.4 Welding parameters for two plate configurations
Welding parameters Shield
Gas Feeding wire WFS
mm/s Voltage V Ampere A Welding speed mm/s
Welding
angle Argon AA4043
Horizontal 271 23.2 174 15.2 15º 12 L/min 1.2mm
(a) Horizontal (b) Vertical
Figure 2.3 a) Horizontal welding configuration; b) Vertical welding configuration
Table 2.5 Location of thermocouples for temperature measurement Horizontally welded plate Vertically welded plate
X = distance from weld start
Y = distance from welding center line
Table 2.5 and Figure 2.3 show the location of thermocouples (TCs) in two welding configurations. Each sample has 4 TCs on each side of the welding line.
x y Thermocouples T1 to T8 TC1 TC2 TC3 TC4
2.4 Welding thermal cycle measurement
GRAPHTECH GL220A data acquisition system and thermocouples type K with diameter of 0.5mm were used to measure the temperature across the HAZ. The datalogger was set to record 10 readings per second from each thermocouple. Thermocouples were installed using a TW163/V variable energy TCs welding unit. Eight thermocouples were installed with four on each side of the welding line as shown in Figure 2.4.
Figure 2.4 Location of installed thermocouples
The thermocouples record the temperature at the first point along the two wires. If any other intersection is there along the thermocouple wires, the thermal cycle measurement will not be accurate. Ceramic tubes are used to maintain the distance between the thermocouple wires and to protect the thermocouples from splatter. Table 2.5 shows the distance of each thermocouple from the welding line.
4 Thermocouples on each side, covered by ceramic tubes
2.5 Procedures for characterisation of the HAZ
In order to examine the influence of welding thermal history caused by GMAW on microstructure and mechanical behaviour, an optical microscopy observation of the base metal structure, fusion zone and HAZ was performed. The mechanical characterisation of these regions was obtained by microhardness and micro-tensile tests using the DIC method.
2.5.1 Microstructure characterisation
The characterisation of microstructural was performed on test samples from each weld. Specimens of a cross section transverse to the welding line were prepared, as illustrated in Figure 2.5. The sample was sectioned with a META-CUT water-cooled abrasive cutter. The first 30 mm of the weld was discarded to avoid unsteady-state conditions.
(a) (b) Figure 2.5 Extracted specimen from the a) horizontal welded plate, b) vertical welded plate
Next, the specimens were mounted and polished using a PACE TCH NANO 2000T polishing machine. The polishing was performed using grades of silicon carbide paper, from 400 up to 2400 grit, then followed by 3 μm, 1 µm and 0.05 µm size polishing pads in sequence.
Acetone and dried hot air were used to clean the samples in between polishing steps as shown in Figure 2.6. To prepare the specimen for optical microscopy, samples were etched with Caustic Sodium Fluoride Etch (93 mL water, 2 g NaOH, 5 g NaF). Specimens were examined with an Olympus Lext 4100 light microscope to observe the presence of defects and the main microstructural characteristics of the GMAW zones: base metal, heat affected zone, partially melted zone, and fusion zone. Intercept technique used to measure the change in grain size cross HAZ.
Figure 2.6 Polished and etched sample for microstructure characterisation extracted from horizontally welded plate
2.5.2 Mechanical Characterisation
Microhardness and micro flat tensile tests using the DIC technique were performed on specimens extracted from welded samples to characterise the mechanical properties of the FZ, heat affected zone and base metal.
2.5.2.1 Microhardness Tests
Microhardness measurements were carried out on the mounted specimen at room temperature in a cross section transverse to the welding line to cover all zones affected by the thermal cycle and the parent metal. Automatic microhardness Clemex CMT used to measure
the hardness with a dwell time of 15 sec and load of 100 g according to ASTM E92 standard procedure for Vickers hardness testing of metallic materials.
The parameters were kept constant for all indentations with 250µm distance between each indentation. The microhardness measurement was analysed as a function of its distance from the bead center. A 2D map was generated to cover all zones in the cross-section and to investigate the hardness distribution. Figure 2.7 below shows the indentation distribution.
Figure 2.7 Distribution of microhardness indention
2.5.2.2 Micro flat tensile test with DIC transverse to welding direction
Digital image correlation is an image analysis method where a series of images is compared to a reference image at various stages of a stress strain test. This correlation method confirmed a high accuracy of local deformation measurements, demonstrated mainly by speckle pattern and illumination [47].
Micro-tensile specimens transverse to the welding line were extracted from a welded plate and used in this investigation. A diagram of micro-tensile samples is shown in Figure 2.8. Dog-bone sub-size tensile samples were machined from the welded plates using a CNC machine. The specimen machined normal to the welding line is shown in Figure 2.8.
(a) (b)
(c) (d) Figure 2.8 DIC of machined samples transverse to the weld direction, a) and b) machined
specimen, c) and d) the extracted samples
A 24 mm gauge length was chosen to cover different areas of the sample such as the BM, HAZ, PMZ, and FZ. A series of specimens were extracted from the machined part using precision cutting machine. The extracted samples were approximately 1mm thick with care taken to avoid any deformation or sequencing errors. Figure 2.8 illustrates the cutting arrangement for the machined sample.
Speckle with high contrast pattern is critical to accurately determine the local deformation of the sample. The speckle patterns were produced using black and white paint and a mini air brush gun to obtain a very fine pattern as illustrated in Figure 2.9. The fine speckle pattern minimises noise and increases track certainty. The mechanical properties of the base metal were determined using a coupon extracted from the base metal as shown in Figure 2.8.
Welding line
1
10 24
Figure 2.9 Speckle patterns for DIC
Micro flat tensile tests were performed using a 10 kN tensile machine (Weisse & Kamrath) under crosshead velocity control (approximately 2.1× 10⁻⁴. s−1). The displacement was
documented to within 1μm of accuracy, and non-contact laser extensometers were used to measure elongation during the test. A high resolution camera was used to record images (at a rate of 1 image per second) simultaneously during the tensile test as shown in Figure 2.10. GOM correlation software was used to calculate the in-plane displacement [48]. The displacement calculated from the image correlation was used to obtain the in-plane local strain field.
Figure 2.10 Set up of micro tensile test with DIC
2.5.2.3 Micro flat tensile test for samples extracted parallel to welding direction
Micro flat tensile specimens parallel to the welding line were extracted from the welded plate and used in this investigation. A diagram of the flat micro-tensile samples is given in Figure 2.8. Dog-bone sub-size tensile specimens were machined using CNC as shown in Figure 2.11. Different samples were extracted from different subzones in the HAZ, and every specimen presents a different thermal history based on its distance from the FZ.
Micro tensile machine Laser Extensometer
(a) (b)
(c) (d) Figure 2.11 HAZ extracted micro-tensile specimens parallel to welding line,
dimensions in mm, a) and b) machined specimen, c) and d) the extracted DIC samples Welding line 10 24 3 1


![Figure 1.8 Schematic of gas metal arc welding process, a) process overall, b) fusion area [23]](https://thumb-eu.123doks.com/thumbv2/123doknet/7313808.210216/36.918.130.723.165.694/figure-schematic-metal-welding-process-process-overall-fusion.webp)
![Figure 1.15 The illustration of the test setup of DIC to characterise the local material properties [38]](https://thumb-eu.123doks.com/thumbv2/123doknet/7313808.210216/47.918.157.831.457.863/figure-illustration-test-setup-characterise-local-material-properties.webp)
![Figure 1.16 Global strain of the specimens estimated with extensometer, local deformation fields characterised using DIC [43]](https://thumb-eu.123doks.com/thumbv2/123doknet/7313808.210216/48.918.133.713.513.900/figure-global-strain-specimens-estimated-extensometer-deformation-characterised.webp)


