Cost monitoring in dairy farms to promote the value chain of fresh milk in North Vietnam
218
0
0
Texte intégral
(2)
(3) Copyright Aux termes de la loi belge du 30 juin 1994 sur le droit d’auteur et les droits voisins, seul l’auteur a le droit de reproduire partiellement ou complètement cet ouvrage de quelque façon et de quelque forme que ce soit ou d’en autoriser la reproduction partielle ou complète de quelque manière et sous quelque forme que ce soit. Toute photocopie ou reproduction sous autre forme est donc faite en violation de ladite loi et de ses modifications ultérieures..
(4)
(5) DEDICATION To my beloved family: my parents, my husband and my children.
(6)
(7) ACKNOWLEDGMENTS In order to finish the thesis and get this success, I have received many supports and encouragement from many people and institutions that I would gratefully like to acknowledge. I sincerely thank Professor Lebailly for what he has done for me during my research period. He had created an opportunity and also opened the door for me to enter the world of science, and to research this thesis. He has always oriented me to the right way in the research. He guided me through a suitable research methodology in accordance with the specific conditions of my country. He commented and corrected my thesis patiently and fully. For me, he is not only my promoter, but also my devoted father who helped me, encouraged me in many difficult times along the way of getting the PhD. Deep in my heart, I always remember his grace and will try to become one of his good students. I would like to thank Professor Tran Huu Cuong, my co-promoter. He has created a motivation for me to study abroad, encouraged and helped me from the first step on the path of this research. Together with Professor Lebailly, he has supported me in the process of implementation of my thesis. He is not only my promoter, but also a good colleague, who is always willing to share with me the difficulties that I encountered during the period of study. I would also like to thank Professor Philippe Burny for his kindly assistance. He helped me to understand how the agencies such as AWE, CRA-W, etc. support dairy farmers and how the farmers in Wallonie manage and monitor their farms. He also helped me during my time in Belgium as a very good friend, share practical research experience with me and give me necessary aids whenever I need. During my research period in Belgium, I also received valuable help from various individuals and organizations. I would like to thank Professor Thomas Dogot for giving me many useful advices and consultation; thank François Terrones Gavira for coming with me to the study sites around the Walloon region; thank Nadin, Anne, and Christine for helping me when I studied at the Gembloux. I also thank AWE, CRA-W and dairy farmers in Wallonie for spending time and helping me to understand how to manage and monitor farms. I would like to thank my friends and colleagues in the Department of Business Management and in the Faculty of Accounting and Business Management, Hanoi University of Agriculture that has encouraged and enabled me to participate and complete this thesis. My thanks are given to the management board and staffs of Moc Chau dairy plant; and dairy farmers, especially family of Mr. Pham Van Te and Mr. Nguyen Ba Ngoc in Moc Chau District, Son La province for helping me in the process of researching there. I would like to express my deep gratitude to the University Commission for Development (CUD) for the scholarships that they gave me for my doctoral studies. Thank Professor Dang Vu Binh, Vu Dinh Ton, Joseph Dufey, Mr. Dick Molderez, Madames Maryvonne Aubry, Valérie Voyeux and Lindsay Lebeau for helping me in the procedures for scholarship. Finally, I would like to thank my whole family: my husband and children, my parents-in-law, brothers and sisters-in-law, my parents, my brothers and sister for helping me and giving me the courage to research and complete the thesis. I am very thankful for all of you..
(8)
(9) Bui Thi Nga (2013). Cost monitoring in dairy farms to promote the value chain of fresh milk in North Vietnam. (PhD in English), Belgium, University of Liège – Gembloux Agro- Bio Tech, 172 p, 38 tables, 48 figures Summary In Vietnam, the consumption of dairy products has increased dramatically in recent years due to rising incomes. To meet this growing demand, and reduce imports, the Vietnamese Government has encouraged milk production. In this context, our research is primarily interested in the distribution of value added among the actors within the fresh milk chain observed in the province of Son La. Our study demonstrates that value added within the fresh milk chain was unequally distributed among actors in the chain in the bias orientation to the non-farmers (nonproducer). The key feature in the chain was the dairy farmers, but they were also the most vulnerable actors of the chain. Given the balance of power among the actors, the most appropriate method to promote the added value for dairy producers is to help a better control on their production costs by improving the management at the dairy farm. In the second part of the work, we are inspired from foreign experience in this field to define an accounting system for technical-economic monitoring of dairy cattle adapted for the situation of Vietnamese farmers. This system has been tested in Moc Chau in an experimental dairy farm to provide data regarding the efficiency and profitability of operations. Dairy farmers were interested in the proposed monitoring system because it allows them to know the level of performance and to compare it to the others. They were interested in revenue generated from costs control. The major constraints in the application of this monitoring in selected farms were the lack of capacity and knowledge from producers. In conclusion, our study provides an appropriate model for the establishment of a management system of milk production. The most suitable model is to set up an independent agency. The cost of this monitoring was estimated, and scenarios for sustainability have been proposed. Contributing to lower costs through a better understanding of technical and economic performance of farmers, the service management operations will improve the competitiveness of locally produced milk with imported products..
(10)
(11) Bui Thi Nga (2013). Coût surveillance dans les fermes laitières pour promouvoir la chaîne de valeur de lait frais dans le Nord du Vietnam. (Doctorat en anglais). Belgique, Université de Liège - Gembloux Agro-Bio Tech, 172 p, 38 tableaux, 48 figures. Résumé Au Vietnam, la consommation des produits laitiers a connu une hausse spectaculaire au cours des dernières années suite à l’augmentation des revenus. Afin de répondre à cet accroissement de la demande et de diminuer les importations, le Gouvernement vietnamien a encouragé la production laitière. Dans ce contexte, notre recherche s’est tout d’abord intéressée à la répartition de la valeur ajoutée au niveau des maillons de la filière observée dans la province de Son La. Notre étude démontre que la valeur ajoutée de la chaîne du lait frais est répartie de façon inégale entre les acteurs de la chaîne au bénéfice de l’aval de la filière. Le maillon essentiel de la chaîne se situe au niveau des producteurs laitiers, mais ces derniers apparaissent comme les plus vulnérables de la chaîne. Compte tenu des rapports de force au niveau des acteurs, la méthode la plus appropriée pour promouvoir la valeur ajoutée pour les producteurs laitiers est de les aider à mieux maîtriser les coûts de production en améliorant la gestion de l’exploitation laitière. Dans la deuxième partie du travail, nous nous sommes inspiré des expériences étrangères en la matière afin de définir un système comptable de suivi technico-économique des troupeaux laitiers adaptés à la situation des éleveurs vietnamiens. Ce système a été testé à Moc Chau dans des exploitations laitières expérimentales afin de fournir des données relatives à l’efficacité et à la rentabilité de l’exploitation. Les producteurs laitiers se sont montrés intéressés par le système de monitoring proposé car il leur permet de se situer au niveau des performances et de se comparer. Ils sont intéressés par les bénéfices supplémentaires obtenus suite à la maîtrise des coûts. La contrainte majeure dans la généralisation du système de suivi retenu dans les fermes est liée au manque de capacité et de connaissance des producteurs. En conclusion, notre recherche propose un modèle approprié pour la mise en place d’un système de gestion des performances laitières au départ d'une agence indépendante. Le coût de ce monitoring a été estimé et des scénarios pour sa viabilité ont été proposés. En contribuant à une diminution des coûts par une meilleure connaissance des performances technico-économiques des éleveurs, ce service de gestion des exploitations devrait améliorer la compétitivité du lait produit localement face aux produits importés..
(12)
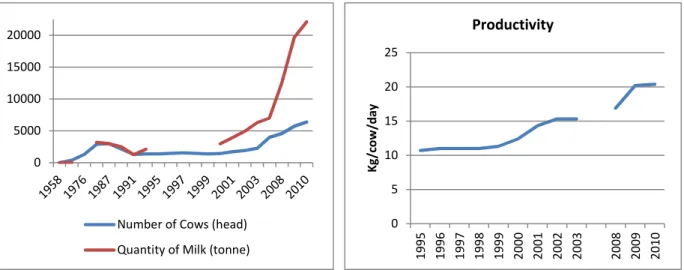
(13) TABLE OF CONTENTS INTRODUCTION, OBJECTIVES, EXPECTED RESULTS AND SCOPE OF THE STUDY ................................................. 9 INTRODUCTION ................................................................................................................................................ 9 OBJECTIVES OF THE STUDY ............................................................................................................................. 11 GENERAL OBJECTIVE............................................................................................................................................... 11 SPECIFIC OBJECTIVES .............................................................................................................................................. 11 EXPECTED OUTPUTS AND SCOPE OF THE STUDY ............................................................................................ 12 EXPECTED OUTPUTS ............................................................................................................................................... 12 SCOPE OF THE STUDY ............................................................................................................................................. 12 PART 1 FRESH MILK VALUE CHAIN IN NORTHERN VIETNAM........................................................................... 13 CHAPTER 1 LITERATURE REVIEW AND THEORETICAL FRAMEWORK ............................................................... 15 1.1 LITERATURE REVIEW: VALUE CHAIN AND ITS PROMOTION .................................................................... 15 1.1.1 Conceptual definitions ................................................................................................................... 15 1.1.2 Roles of the value chain approach ................................................................................................ 23 1.1.3 Promotion of the value chain ........................................................................................................ 23 1.2 THEORETICAL FRAMEWORK ................................................................................................................... 29 1.2.1 Value chain theory......................................................................................................................... 29 1.2.2 Economy of scale ........................................................................................................................... 31 1.1.1 Basic factors of farm production ................................................................................................... 33 CHAPTER 2 METHODOLOGY OF THE STUDY AND SITUATION OF DAIRY PRODUCTION IN VIETNAM ............... 35 2.1 METHODOLOGY OF THE STUDY .............................................................................................................. 35 2.1.1 Selection of study sites and survey samples .................................................................................. 35 2.1.2 Method for collecting data ............................................................................................................ 37 2.1.3 Method of analysis ........................................................................................................................ 39 2.1.4 Definition and calculation of economic and financial indicators................................................... 41 2.1.5 Analytical framework .................................................................................................................... 50 2.2 SITUATION OF DAIRY PRODUCTION IN VIETNAM.................................................................................... 57 2.2.1 Basic socioeconomic and agro-ecological characteristics of Vietnam .......................................... 57 2.2.2 Brief history of dairy development in Vietnam .............................................................................. 62 2.2.3 Herd holding pattern ..................................................................................................................... 63 2.2.4 Dairy production ............................................................................................................................ 64 2.2.5 Milk market ................................................................................................................................... 65 2.2.6 Prospects for dairy production in Vietnam .................................................................................... 68 2.2.7 Flow of services and institutions involved in the dairy industry in Vietnam .................................. 69 CHAPTER 3 FRESH MILK VALUE CHAIN IN NORTHERN VIETNAM .................................................................... 71 3.1 ANALYSIS OF THE FRESH MILK CHAIN IN NORTHERN VIETNAM .............................................................. 71 3.1.1 General information about the study site ..................................................................................... 71 3.1.2 Milk chain in Moc Chau ................................................................................................................. 76 3.1.3 Milk distribution channel............................................................................................................... 78 3.1.4 Value added by dairy farmers ....................................................................................................... 79 3.1.5 Economic calculation and value added by collecting sectors ........................................................ 97 3.1.6 Economic calculation and value added by the dairy processing company (dairy plant) ............... 98 3.1.7 Economic calculation and value added by distributors ................................................................. 99 3.1.8 Milk value chain .......................................................................................................................... 100 3.2 ACTOR ANALYSIS ................................................................................................................................... 101 3.3 DISCUSSION .......................................................................................................................................... 104.
(14) PART 2 METHODOLOGY FOR THE APPLICATION OF A COST-MONITORING SYSTEM AND MANAGEMENT OF DAIRY FARMS IN VIETNAM .......................................................................................................................... 105 CHAPTER 4 MONITORING SYSTEM AND MANAGEMENT OF DAIRY FARMS AROUND THE WORLD, FOCUSING ON THE WALLOON REGION OF BELGIUM ............................................................... 107 4.1 MONITORING SYSTEM AND MANAGEMENT OF DAIRY FARMS ............................................................. 107 4.1.1 Management and farm management......................................................................................... 107 4.1.2 Management of dairy farms ....................................................................................................... 109 4.1.3 Monitoring system of dairy farms ............................................................................................... 109 4.2 EXPERIENCE OF MONITORING AND MANAGEMENT OF DAIRY FARMS AROUND THE WORLD, FOCUSING ON THE WALLOON REGION ............................................................................................................................ 110 4.2.1 Experience of monitoring dairy farms in European countries ..................................................... 110 4.2.2 Monitoring and management system in dairy farms within the Walloon region ....................... 114 4.2.3 Monitoring and management system in dairy farms in the Netherlands ................................... 118 4.2.4 Monitoring and management system in dairy farms in New Zealand ........................................ 122 4.2.5 Monitoring and management system of dairy farms in Australia .............................................. 126 4.3 LESSON LEARNED FOR VIETNAMESE DAIRY FARMERS .......................................................................... 130 CHAPTER 5 METHODOLOGY FOR THE APPLICATION OF THE COST-MONITORING SYSTEM AND MANAGEMENT ON DAIRY FARMS IN VIETNAM ................................................................................... 133 5.1 FARMS CHOSEN TO APPLY A MONITORING SYSTEM ............................................................................. 133 5.1.1 Farms chosen............................................................................................................................... 133 5.1.2 Requirements for a form to record farm transactions ................................................................ 134 5.2 CONTENT OF THE MONITORING SYSTEM.............................................................................................. 135 5.2.1 Monitoring of input ..................................................................................................................... 135 5.2.2 Monitoring of processing activities on farms .............................................................................. 136 5.2.3 Monitoring of outputs ................................................................................................................. 138 5.3 SHORT-TERM COST MONITORING AND MANAGEMENT ON FARMS .................................................... 139 5.3.1 Objective...................................................................................................................................... 139 5.3.2 Establishment of a system for collecting information ................................................................. 139 5.3.3 Training farmers on how to record the information ................................................................... 144 5.3.4 Recording the information .......................................................................................................... 144 5.3.5 Processing and analyzing the information .................................................................................. 146 5.4 LONG-TERM MONITORING IN FARMS................................................................................................... 146 5.4.1 Objectives .................................................................................................................................... 146 5.4.2 Decision making based on monitoring system and management on farms ............................... 147 CHAPTER 6 RESULTS OF THE APPLICATION OF COST MONITORING ON NORTHERN VIETNAM DAIRY FARMS ...................................................................................................... 149 6.1 INTEREST OF DAIRY FARMERS DURING PERIOD OF APPLICATION OF COST-MONITORING SYSTEM ..... 149 6.1.1 Methodology to get results ......................................................................................................... 149 6.1.2 Interest of the dairy farmers ....................................................................................................... 153 6.2 DIFFICULTIES AND LIMITATIONS IN APPLYING THE MONITORING SYSTEM IN VIETNAM ...................... 156 6.2.1 Difficulties and limitations........................................................................................................... 156 6.2.2 Recommendations ....................................................................................................................... 159 6.3 FUTURE APPLICATION OF THE COST-MONITORING SYSTEM ................................................................ 161 6.3.1 Model for future application of cost monitoring on farms .......................................................... 161 6.3.2 Future application of the monitoring system on dairy farms in Vietnam.................................... 162 CONCLUSIONS AND RECOMMENDATION ..................................................................................................... 171 CONCLUSIONS ................................................................................................................................................ 171 RECOMMENDATIONS ..................................................................................................................................... 172 REFERENCES ................................................................................................................................................. 173 ANNEX ......................................................................................................................................................... 183.
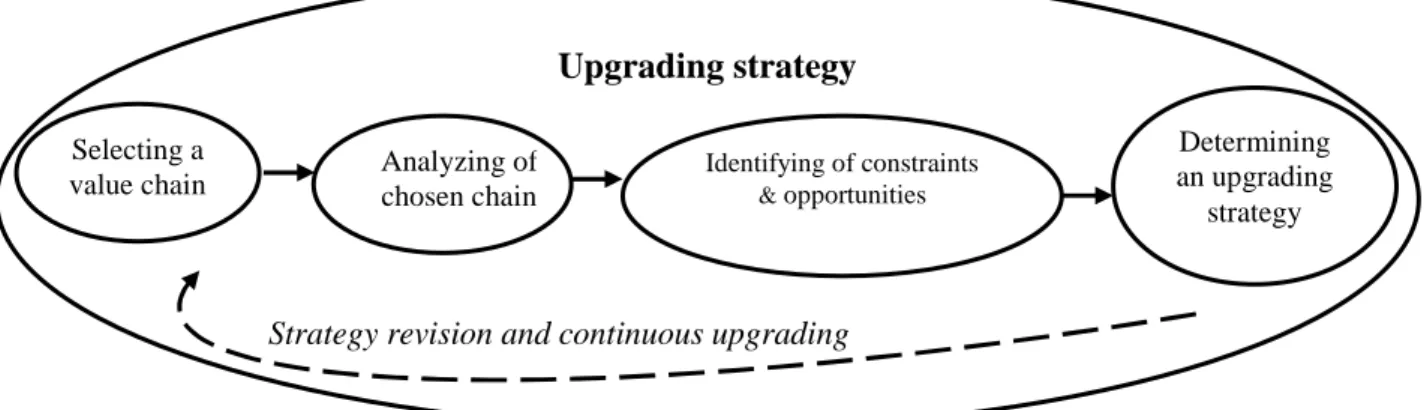
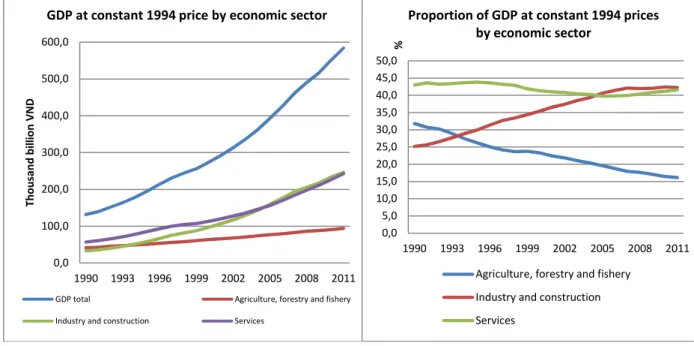
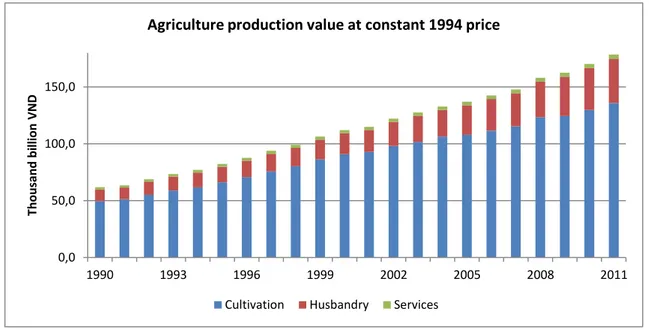
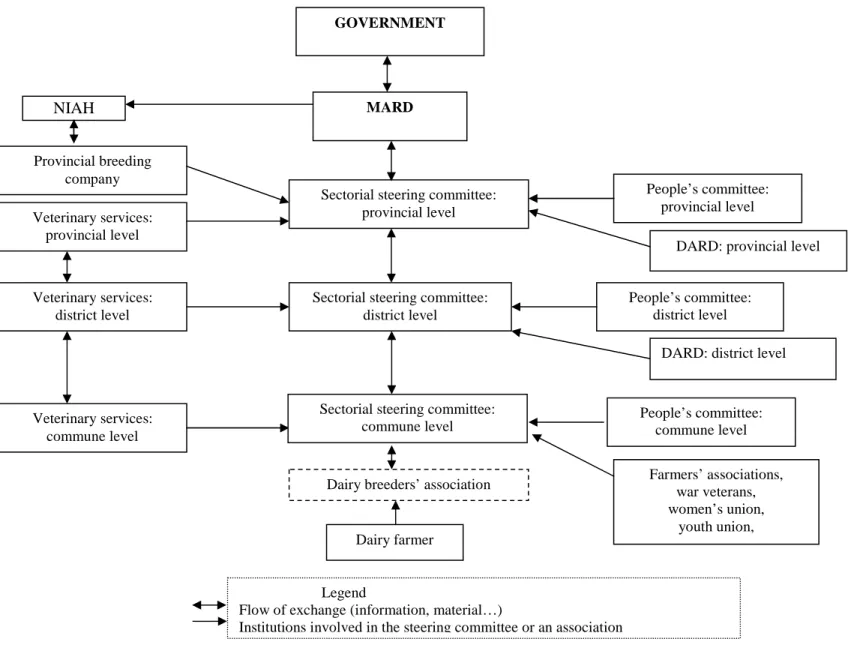
(15) LIST OF FIGURES Figure 1. Figure 2. Figure 3. Figure 4. Figure 5. Figure 6. Figure 7. Figure 8. Figure 9. Figure 10. Figure 11. Figure 12. Figure 13. Figure 14. Figure 15. Figure 16. Figure 17. Figure 18. Figure 19. Figure 20. Figure 21. Figure 22. Figure 23. Figure 24. Figure 25. Figure 26. Figure 27. Figure 28. Figure 29. Figure 30. Figure 31. Figure 32. Figure 33. Figure 34. Figure 35. Figure 36. Figure 37. Figure 38. Figure 39. Figure 40.. Porter Generic Value chain – Popular visualization.......................................................... 16 Illustration of a supply chain............................................................................................. 19 Process of Value Chain analysis ........................................................................................ 24 Value chains upgrading strategy....................................................................................... 26 Value chain promoting strategy ....................................................................................... 27 Stages of the value chain .................................................................................................. 29 Illustration of economies of scale ..................................................................................... 32 The study site .................................................................................................................... 36 Analytical framework of the study ................................................................................... 51 Technical method for on-farm experiment ...................................................................... 52 Conceptual framework ..................................................................................................... 55 Economic growth .............................................................................................................. 58 Proportion of GDP at constant 1994 prices by economic sector ..................................... 58 Agricultural production in Vietnam 1990-2011 at comparative prices of 1994 ............... 61 Numbers of major animals in Vietnam 2000–2010 .......................................................... 62 Dairy production in Vietnam............................................................................................. 64 Milk consumption in comparison with the increase in income 1996–2006..................... 65 Milk consumption 1990–2010 .......................................................................................... 65 Milk consumption versus production per capita in Vietnam ........................................... 66 Imported quantity of milk in Vietnam .............................................................................. 66 Major milk exporters to Vietnam in first 9 months of 2012 ............................................. 67 CAGR of milk products in Vietnam ................................................................................... 69 Flow of services/ information/inputs in the dairy industry in Vietnam ........................... 70 Milk production in the region ........................................................................................... 72 Milk production in the region ........................................................................................... 72 Numbers and proportion of dairy cattle by production unit in Moc Chau....................... 74 Milk production by unit .................................................................................................... 74 Proportions of the herd by age ......................................................................................... 75 Basic actors and stakeholders in the Moc Chau milk chain .............................................. 76 Milk distribution channel .................................................................................................. 78 Numbers of dairy cows and farms in Belgium and Wallonia .......................................... 114 Dairy herd size in Belgium and Wallonia ........................................................................ 114 Quantity of milk provided in Belgium ............................................................................. 115 Quantity of milk provided in Wallonia ............................................................................ 115 Situations of using an accounting system at dairy farms in Wallonia ............................ 116 Impressions of the organizational structure of the NRS................................................. 122 Number of dairy farms in Australia and Victoria state ................................................... 127 Number of cows in Australia and Victoria state ............................................................. 127 Demand for applying a monitoring system in farms ...................................................... 133 Requirements for the form ............................................................................................. 134.
(16) Figure 41. Figure 42. Figure 43. Figure 44. Figure 45. Figure 46. Figure 47. Figure 48.. Presenting margin of results to the dairy farmers (farm 8)............................................ 150 Presenting costs to the dairy farmers (farm 10) ............................................................. 150 Dairy farmer’s evaluation of the monitoring system application ................................... 154 Dairy farmers’ evaluation of the monitoring method .................................................... 154 Dairy farmers’ evaluation of the content of the monitoring system.............................. 155 Most important variables for farmers ............................................................................ 155 Difficulties and limitations in applying the monitoring system on farms ....................... 156 Expected organizational structure of the monitoring agency ........................................ 164.
(17) LIST OF TABLES Table 1. Table 2. Table 3. Table 4 Table 5. Table 6. Table 7. Table 8. Table 9. Table 10. Table 11. Table 12. Table 13. Table 14. Table 15. Table 16. Table 17. Table 18. Table 19. Table 20. Table 21. Table 22. Table 23. Table 24. Table 25. Table 26. Table 27.. Table 28. Table 29. Table 30. Table 31. Table 32. Table 33. Table 34. Table 35. Table 36. Table 37. Table 38.. Value chain analysis processes of some main theories .....................................................30 Major economic indicators of Vietnam .............................................................................58 Productivity of employed population by some kinds of economic activity.......................60 Major data on dairy production in Moc Chau ...................................................................72 Surveyed farm size .............................................................................................................79 Major information of the surveyed farm...........................................................................80 Lengths of time for milk bulking at the farms....................................................................81 Ages of farm holders ..........................................................................................................82 Monthly income of dairy farm ...........................................................................................82 Land area ...........................................................................................................................83 Milk yield per ha of land ....................................................................................................84 Average milk productivity on farms...................................................................................85 Milk yield per farm .............................................................................................................86 Grass production per ha/year ............................................................................................87 Cost of maize silage production.........................................................................................89 Bought feed for one dairy cow/year in Moc Chau ............................................................90 Other costs for a dairy cow/year .......................................................................................91 Fixed cost and depreciation in dairy farms ........................................................................92 Costs of raising a cow per annum ......................................................................................93 Costs of one kg of milk on the farm ...................................................................................94 Average revenue of a farm per annum (in VND) ...............................................................95 Value added by dairy farmers ............................................................................................96 Value added by milk collectors ..........................................................................................97 Economic calculation and value added by the dairy plant ................................................98 Economic calculation and value added by milk distributors .............................................99 Major figures of milk production in the Netherlands 2009–2011 ...................................119 Average production figures from black-and-white and red-and-white herd books (completed lactations between 01-09-2010 and 3-8-2011)............................................119 Milk production in New Zealand......................................................................................123 The monitoring program..................................................................................................125 Australian dairy 2010/2011 .............................................................................................126 Requirements for a form by farmers ...............................................................................134 Monitoring of farm inputs ...............................................................................................135 Monitoring of processing activities on farms ..................................................................136 Monitoring of output in farms .........................................................................................138 Daily record book for dairy farmers.................................................................................140 Record book for dairy farmers (half year or yearly) ........................................................140 Description of the monitoring agency’s working framework ..........................................164 Benefits of monitoring on farms......................................................................................168.
(18)
(19) LIST OF BOXES AND MODELS Box 1. Additional turnover count on 1 kg of milk ........................................................................100. Box 2.. Cost count on 1 kg of milk .................................................................................................100. Box 3.. Value added distribution along the fresh milk chain (count on a kg of milk) ...................101. Box 4.. Actor analysis of the fresh milk chain in northern Vietnam..............................................102. Box 5.. Presenting and analyzing results of the farms (farm 1) ....................................................150. Box 6.. The dairy farmer feedback form .......................................................................................152. Model 1. Dairy farm monitor method ...............................................................................................128.
(20)
(21) ABBREVIATIONS AND ACRONYMS ACDI/VOCA. Agricultural Cooperative Development International / Volunteers in Overseas Cooperative Assistance. AgriBank. Bank for Agriculture and Rural Development of Vietnam. AI. Artificial insemination. IWEPS. Institut Wallon de l’Évaluation, de la Prospective et de la Statistique (Belgium). ASODIA. Association Sud-Ouest pour le Développement International Agricole. AWE. Association Wallonne de l’Élevage (Belgium). BTC. Belgian Development Agency. CAGR. Compound annual growth rate. CCA. Commodity chain analysis. DARD. Department of Agriculture and Rural Development of Vietnam. FDI. Foreign direct investment. GDP. Gross Domestic Product. GSO. General Statistics Office of Vietnam. GTZ. Deutsche Gesellschaft für Technische Zusammenarbeit (GTZ). HDI. Human Development Index. HF. Holstein Friesian. JICA. Japan International Cooperation Agency. M4P. Making market systems work better for the poor. MARD. Ministry of Agriculture and Rural Development of Vietnam. MCM. Moc Chau Dairy cow joint stock company (Vietnam). MCMA/CEA. Ministère des Classes d’économie agricole. MPI. Ministry of Planning and Investment of Vietnam. MRW. Ministère de la Région Wallonne. NIAH. National Institutes of Animal Husbandry of Vietnam. SME. Small-and Medium-sized Enterprises. USD. United States Dollar. VA. Value added. VCCI. Vietnam Chamber of Commerce and Industry. VietGAHP. Vietnam Good Animal Husbandry Practices. VND. Vietnamese Dong. WUR. Wageningen UR (University & Research Center). Moyennes. et. de. l’Agriculture/Centre.
(22)
(23) INTRODUCTION, OBJECTIVES, EXPECTED RESULTS AND SCOPE OF THE STUDY INTRODUCTION By the end of 2012, Vietnam’s population numbered 88.78 million, of which 59.97 million live in rural areas, accounting for 67.48% of the total; 44.86 million were women. Of the country’s workforce, 70.3% live and work in rural areas.1 Creating jobs, generating income, and improving the living standard for people in rural areas are of considerable concern in Vietnam. Agricultural growth is central to poverty reduction in rural areas.2 Therefore, it plays a significant role in the sustainable development of the country. In recent years, agricultural production in Vietnam has changed. It is no longer a riceproducing monoculture. Types of businesses and production have been diversified, as have crops and livestock raising. In particular, dairy farming and milk production have become relatively effective components of an expanding agro-industry. It is also an important branch within the policy of restructuring the agricultural economy. A large market for milk exists in Vietnam. And milk consumption in Vietnam is increasing rapidly.3 However, the dairy industry in Vietnam currently meets only 22 percent of the domestic demand (in 2012); the shortfall in demand for dairy products has been met by imports from overseas suppliers and producers.4 This situation makes Vietnam dependent on the foreign market. In addition, there is some distortion in the milk market in Vietnam which, in turn, leads to fluctuations in the price of milk. In such a context, farmers are easily vulnerable. It also leads to reduced production effectiveness throughout the chain. Promotion of the milk value chain through cost monitoring on farms is a move that would contribute to rural development within the country. Firstly, this initiative would contribute to economic development and to sustainable development. It would help increase the earnings of stakeholders in the chain. That would help develop the local economy, enlarge the market, and improve business conditions.5 Secondly, farm performance and effectiveness would be improved. With a good costmonitoring system, farms would be assisted to operate more efficiently. This would provide a basis for more effective labor distribution, land use, and exploitation of capital. Thirdly, it would help dairymen to develop themselves through creative initiative and increased knowledge, as well as generate more employment and earnings in the agricultural sector.6 Achieving those goals involves an activity that provides a nutritious, healthful food daily. The end result will be to enable the milk industry to become more independent in the sense of not relying so much on foreign input.. 1. GSO, 2013. 2. Humphrey, 2006. 3. Nancy, 2008. 4. MARD, 2013. 5. GTZ-SME, 2008. 6. Andreas, 2008.
(24) Numerous earlier studies have concentrated on this value chain. In Vietnam, an economic and technical cooperation program funded by the German government (GTZ-SME) helped Vietnam to establish and improve a value chain of ornamental trees in Nam Dinh province, tourism in Danang, rattan handicraft production in Quang Nam, coffee in Dak Lak, safe vegetable growing in An Giang, avocadoes in Dak Lak, pangasius fish farming in An Giang and longan fruit in Hung Yen. These programs have proven that promoting the value chain is meaningful for the development of the farmers. The action creates employment for them, increases their income, enhances their knowledge, and improves their living standard.7 However, in a comprehensive value chain in general and that of milk in particular, farmers who produce and distribute products are forced to bear the largest share of the cost but their corresponding earnings are the lowest and their growth rate lower, especially when it comes to value added. A case study to estimate the cost of a value chain of rice in Vietnam and Cambodia showed that farmers bore 56.1% of the total cost, with a profitability margin of only about 20%.8 Intangibles such as the distribution and marketing phases, often account for a larger share of the final price of a good than do its manufacturing costs.9 One research project analyzed the stakeholder costs and benefits in a tea value chain in Vietnam10 and found similar results. The farmers had to invest the most but earned the least in terms of proportion of benefit. The highest proportion of benefit came to the retailers. Farmers who joined the export market earned the most in comparison to those who sold in the domestic market. The Mekong Delta Development Research Institute11 analyzed the pangasius fish value chain and reported that there was an unequal distribution of benefits. Farmers always got the lower proportion of value added in comparison to collectors, retailers, and export manufacturing companies. Statistics showed that farmers got only 19.4% of the total benefits, retailers 2.1% and export manufacturing companies 78.5%. The research recommends that in order to achieve sustainable development, farmers must be in the center of development and be given due consideration. Although there are many studies about value chains, it seems that none of them has tackled promotion the fresh milk value chain in northern Vietnam. Nor has there has not been any doctoral research on this issue. Besides, milk is a fresh food, highly subject to spoilage and hence waste. Dairymen are affected by the harsh natural conditions of Vietnam such as high temperatures, humidity, and heavy seasonal rains. Thus, they are confronted with increased risk and vulnerability. In addition, it seems that there is an unequal distribution of earnings among actors in the dairy value chain, in which the producers seem to be losers. Questions have been asked: Is there any way to improve the earnings of dairymen? What should be the approach? To improve the earnings of the dairymen, one way is to promote the value of the whole chain. There are many methods to promote a value chain: (i) strengthen private business linkages and associations to cooperate better across production stages, increase competitiveness of the whole chain and improve the quality, reliability, and volumes of supply; (ii) enhance collaboration between public agencies and the private sector to enhance the socio-economic 7. GTZ-SME, 2008. 8. WB/GDS, 2007; Lebailly et al., 2007. 9. Kaplinsky, 2000; Lebailly et al., 2007. 10. Ipsard, 2007; Lebailly et al., 2007. 11. Can Tho University, 2007. 10. Introduction, objectives, expected results and scope of the study.
(25) and environmental conditions and impose a positive impact on the overall business and investment climate; (iii) strengthen services in the value chain to provide adequate quantity, quality, and price-effectiveness for essential services (such as input delivery, maintenance, transport, or advertising), along with delivery of additional information, improved technology, higher skills, better logistics and product innovation; and (iv) monitor and manage to track implementation progress, evaluate performance, identify the impact of initiatives and reinforce the prospects for achieving better results.12 Given the current state of affairs in Vietnam, in order to enhance the fresh milk value chain with emphasis on the welfare of dairy farmers and their getting added value from it, the most suitable method is seen to be helping them to exploit effectively internal factors on farms and to improve their performance with support from external sources. This study entitled Cost monitoring in dairy farms to promote the fresh milk value chain in north Vietnam fills a critical need.. OBJECTIVES OF THE STUDY General objective This study aims to promote benefits and value added for dairy farmers in north Vietnam in particular and for dairymen in general through applying a cost-monitoring system on farms for better operation and performance and to improve equality among all actors in the milk chain.. Specific objectives The study intends to: • Get insight into the characteristics of the fresh milk value chain in northern Vietnam, the role and function of actors in the chain, as well as explore the linkages among actors and stakeholders. • Define the flows of milk, the information pattern, the distribution of added value among fresh milk chain actors in northern Vietnam; • Determine the main problems and key obstacles that must be overcome to enhance dairy farmer earnings and equality throughout the chain. • Research the method of applying a monitoring system in some countries, especially in the Walloon region of Belgium, and define the methodology for applying a cost-monitoring system on farms in Vietnam. • Apply on some dairy farms in northern Vietnam an experimental cost-monitoring system. • Highlight the positive implications of promoting the fresh milk value chain through costmonitoring on farms in northern Vietnam.. 12. GTZ-SME, 2008. Introduction, objectives, expected results and scope of the study. 11.
(26) EXPECTED OUTPUTS AND SCOPE OF THE STUDY Expected outputs 1) A systematic theory of the milk value chain for the use of policymakers in Vietnam’s agricultural sector. 2) An examination of the natural and socio-economic aspects of the fresh milk value chain and their impacts on the production processes of dairymen in northern Vietnam. 3) Scientific articles on the topic. 4) Model of a cost-monitoring system for dairy farms, which can contribute to increase performance and effectiveness of the farms in Vietnam. 5) Recommendations to dairymen and policymakers about the potential positive effects of promoting the fresh milk value chain through cost monitoring in farms. 6) Documents for researchers, lecturers, and students and future study on promotion of the value chain through cost monitoring in farms.. Scope of the study Promoting the fresh milk value chain through cost monitoring on farms being a very broad subject, the study concerns itself with: (i). The chain of fresh cow’s milk production, focusing on dairy farmers in Moc Chau district, Son La province, in Vietnam because, until now, Vietnam is a country that depends heavily on imported milk. Fresh milk is usually always just delivered to domestic customers. (ii) The vertical chain with horizontal supports will be investigated. (iii) Concentration mainly on improving benefits for and the welfare of dairy farmers who are the most vulnerable actors in the chain.. 12. Introduction, objectives, expected results and scope of the study.
(27) PART 1 FRESH MILK VALUE CHAIN IN NORTHERN VIETNAM.
(28)
(29) CHAPTER 1 LITERATURE REVIEW AND THEORETICAL FRAMEWORK This chapter begins with a review of literature on the value chain and promotion of the value chain. Some basic definitions such as value chain, fresh milk value chain, and relevant concepts will be reviewed. Then the role of the value chain approach will be presented, followed by promotion of the value chain. The chapter concludes with some theories regarding the value chain.. 1.1 LITERATURE REVIEW: VALUE CHAIN AND ITS PROMOTION 1.1.1 Conceptual definitions Changes in international trade, including reduced transport costs, advances in telecommunications technology, and lower policy barriers have fueled a rapid increase in global integration. The international flows of goods and services, capital, technology, ideas, and people offer great opportunities to boost growth and reduce poverty by stimulating productivity and efficiency, providing access to new markets and ideas, as well as expanding the range of consumer choice. At the same time, these changes have created new challenges, including inequality, along with the need to increase the quality and sophistication of goods and services, and cost-effective approaches to compete with regional and international competitors (Bolnick B., Camoens A., & Zislin J., 2005; Kaplinsky and Morris, 2000).13 The development and business communities involved in the agriculture and agribusiness sectors have recently shown a tremendous resurgence of interest in promoting value chains as a way to add value, diversify rural economies, and contribute to increased rural household incomes. Value chains are increasingly recognized as a means to reduce the prevalence of rural poverty (Martin W. et al., 2007).14. 1.1.1.1 Value chain Value chain is a concept from business management, which was first introduced and described in 1985 by Michael Porter (Porter, M. E., 1996).15 It comes across firstly as a chain of activities that are operated in a specific industry in which products pass through all activities of the chain in order, and at each stage the product gains some value. It is illustrated as in the following figure:. 13. Bolnick B., Camoens A., & Zislin J. 2005. p. 14; and Kaplinsky and Morris (2000), p1. 14. Martin W. et al. (2007), p 1. 15. Porter, M. E. (1996). What is strategy? Harvard Business Review, November–December, 61–78.
(30) Figure 1. Porter Generic Value chain – Popular visualization16 Source: Porter, 1985.. Primary activities will create value added in the chain, including: (i) inbound logistics: receiving, warehousing, and inventory of input materials; (ii) operations: main activities transform the input into final output and create value added; (iii) outbound logistics: activities required to disseminate the finished product; (iv) marketing and sales: provide products to the customer; (v) service activities: maintain and boost the value of the product. The support activities facilitate primary activities considered as overhead and include procurement, technology development, human resources management and firm infrastructure. Porter’s research shows that enterprise competitiveness can be analyzed by looking at the value chain which includes different detailed activities, and the chain of activities gives the products more added value than the sum of each independent activity relative to the product. After being introduced, the value chain was considered as a powerful analysis tool for strategic management and became an approach to achieve a comprehensive view of the interlocking stages engaged in producing goods and services, from the provision or acquisition of raw materials to final consumption. However, this theory was mainly used to support the process of decision making and executive strategies. Porter supposed that the term value chain applied mostly to the business unit, not to the divisional level or corporate level; it was limited just to micro aspects (firms) excluding the macro aspects, while recently it has been applied to many global chains for many different goods and services.17 He also didn’t include the socioeconomic effect when analyzing the value chain. Developing this theory, many scientists have studied and used the value chain as a tool for research. They defined a value chain as the full range of activities required to bring a product or service through the different phases of production, including physical transformation, the input of various producer services, and response to consumer demand (Kaplinsky R. and. 16. http://en.wikipedia.org/wiki/Value_chain. 17. Many studies of value chains have been done, as seen in the bibliography. 16. Chapter 1. Literature review and theoretical framework.
(31) Morris M., 2000).18 As such, value chains include the vertically linked interdependent processes that generate value to the consumer. The focus of the value chain is on relationships among the various actors involved in the chain and on their implication for development (Humphrey and Schumitz, 2002). The literature on value chains emphasizes the importance in the quasi-hierarchical type of governance, distinguishing between coordination by buyers (buyer-driven chains) and those in which producers take the key role (producer-driven chains) (Gereffi, 1994). However, it seems that buyer-driven chains are coming to the fore due to the increasing concentration of retailing in developed countries (Dolan and Humphrey, 2000) According to other scientists, the idea of a value chain is very simply focused upon the activities needed to turn raw materials into finished products and sell them, as well as on the value added at each link (Gereffi, 1999; Kaplinsky and Readman, 2001; UNIDO, 2002). It embraces the socioeconomic system of interdependent actors performing a sequence of valueadding activities required to bring a product from conception to consumption (Kaplinsky, 2000; Gereffi et al., 2001; Schmitz, 2005; Kula et al., 2006; Altenburg, 2006; GTZ, 2007, Molina, 2010). The global value chain is a new perspective. It is assumed that individual companies rarely undertake alone the full range of activities to bring a product/service from conception to the market, but it involves a chain of activities divided between distinct enterprises. These enterprises may often be located at different places. When the enterprises involved in a value chain are found in different countries, it is called a global value chain. Value chains naturally represent the linkages of different producers and marketing companies who work together to pursue one or more end markets. Participants sometimes collaborate to enhance the overall competitiveness of the final product, but may also be completely incognizant of the relationship between their operation and other upstream or downstream participants. Value chains help to pull together all the factors of production (land, labor, capital, etc.), as well as all economic activities (input supply, production, processing, handling, transport, etc.) to create, sell, and deliver a product to a certain destination (John C. K., 2006).19 GTZ supposed that value chain is an economic system composed of operators, operational service providers and their business linkages at the micro level, and support service providers at the meso level (GTZ, 2007).20 All operators that add value to a particular marketable product on its way from raw material to the last consumer are considered part of the value chain. The system boundary of a value chain is defined by the final product, and the value chain itself comprises those producers and enterprises that perform functions necessary to bring the product to market. According to the sequence of functions and operators, value chains consist of a series of chain links (GTZ, 2007).21 As a summarization of the foregoing definition, this study defines: Value chain as including various actors and stakeholders collaborating vertically and horizontally with each other to bring a product or service through the different phases from input supply to the final product with the aim of increasing the value added for all actors and relevant stakeholders along the chain. 18. Kaplinsky, Raphael and Michael Morris, 2000, p 4. 19. John C. K. (2006), p8. 20. GTZ (2007), module 1, p2. 21. GTZ (2007), p 6. Chapter 1. Literature review and theoretical framework. 17.
(32) Thus, value chain consists first of vertical direct functions such as: primary production, collection, processing, distribution of products and services done by various actors to bring a raw material to the point of retailing the final product. Second, there are horizontal supporting functions such as input supply, financial services, transport, packaging, advertising, etc. to lead to achieving the goal of maximizing the value added and equality for each actor and relevant stakeholders along the chain.. 1.1.1.2 Fresh milk value chain This paper attempts to take an in-depth look into the fresh milk value chain to discover its nature. In this paper, the fresh milk value chain refers to the various stages through which fresh milk produced on dairy farms passes from the farm to the final consumer. It will be considered as: • A sequence of related business activities (functions) from the provision of specific inputs required to keep the dairy cattle to milk production, collection (bulking and cooling), pasteurizing and packaging, right up to the final sale of fresh milk to consumers (the functional view of a value chain). • The set of operators performing these functions, including the dairyman (milk producer), the milk collector, the milk processor (dairy plant), and finally the traders and distributors of fresh milk. These operators are linked by a series of business transactions in which fresh milk is passed on from the initial milk producer to end consumers.22. 1.1.1.3 Relevant concepts and different connotations of the value chain concept Since the 1970s, many economists have studied the relationships between firms. Value chains have become a significant concept in their approach. However, the meaning and connotation of the value chain differ, depending on the researcher’s disciplinary focus. Some style themselves as logisticians (from a management perspective), while others refer to themselves depending on their impact on specific locations, and again, others focus on technological aspects. Although there are many different ways of looking at the value chain concept, it can be seen as comprising five main categories. + The management science perspective Strategic management focuses upon the differences between core and non-core competencies and explains the choices of firms: the make-or-buy decision. Firms need to consider the costs and benefits of in-house production versus outsourcing in a dynamic perspective (Quinn, Hilmer, 1994; Mahoney, 1992; Altenburg, 2007). If they choose to buy inputs from outside, they have to consider future situations such as risks, cost arisings, etc. The forward linkage was introduced to reduce risk and cost for firms. Boundaries of firms appear when firms enhance the trade of products and services across boundaries. New forms of nonmarketable coordination between core firms and associated producers appear to make standards and procedures compatible and reduce transaction costs. The supply chain is introduced in the literature by developing the debate of make-or-buy choices and linking them to issues of location choice and logistics. It is used internationally to encompass every activity involved in producing and delivering a final product or service, from the supplier to the customer (Feller, Andrew et al., 2006). It is a generic label for the 22. 18. My point of view in the analytical framework. Chapter 1. Literature review and theoretical framework.
(33) input-output structure of value-added activities, beginning with raw materials and ending with the finished product. Its activities transform natural resources, raw materials and components into a finished product that is delivered to the end customer (Nagumey, 2006).23 There are relationships between suppliers for the final product, linkages within the enterprises, and conjunctions with the customers.24 (Chen, Paulraj, 2004). Internal supply chain. Suppliers. Purchasing. Production. Distribution. Customers. Figure 2. Illustration of a supply chain. There is a two-dimensional flow in a supply chain: flow of materials and information from the suppliers to the customers and, conversely, flow of information and back hauls. The elements in the supply chain include suppliers, manufacturers (producers), providers, and final customers. The primary focus of supply chains is cost-efficiency, while value chains focus more on value creation, innovation, product development, and marketing. While both concepts describe the same network of companies that interact to deliver goods and services, the value chain is essentially about value. The issue is not so much about which approach is superior or preferable, since both can deliver improved business performance and productivity gains for the chain’s participants. It is noted that practitioners often focus on reducing costs and marginal inefficiencies in supply at the expense of focusing on interventions that could lead to bigger additions of value. Offshoring is defined “as a specific form of cross-border outsourcing” (Altenburg, 2007).25 From the early 1970s, some offshoring in the garment industry became relevant for developing countries because of their substantially lower labor costs. This trend reaches into many other sectors and regions. When business processes were outsourced, many complex knowledge-intensive activities arose, such as which criteria help or hinder the unbundling and international dislocation of production processes (Gassmann, 1997) or which competitiveness factors determine the probability to attract foreign direct investment of the host countries (Altenburg, 2007). + Linkage and chain concepts in development studies Perroux and Hirschman were the most influential people on many aspects of studies of the value chain and linkages concepts. Their main idea is that production within a firm will create a demand for future investment – backward linkage – of the input suppliers. And the output from one firm can be the input for another firm, which means it will stimulate the production of other firms – forward linkage (Altenburg, 2007). Their ideas very strongly affected 23. Anna Nagurney (2006): Supply Chain Network Economics: Dynamics of Prices, Flows, and Profits, Edward Elgar Publishing, 2006, ISBN 1-84542-916-8. 24. Chen, I. J., Paulraj, A. (2004): Towards a theory of supply chain management: the constructs and measurements. In: Journal of Operations Management, 22/2: 119-150. 25. P8. Chapter 1. Literature review and theoretical framework. 19.
(34) regional and industrial policies in the 1960s and 1970s to develop forward linkages between heavy industry with the processing industry. Similarly, import substitution policies contribute to protecting domestic production as it creates a crucial market for the development of input suppliers (backward linkage). Transnational corporations became a favorite object of studies concentrated on backward linkages with local small and medium enterprises at that time. One of the main contributions to the value chain theory is the filière approach (commodity chain analysis – CCA) by French scientists (Fabre, 1994; Raikes P., M. Friis-Jensen and S. Ponte, 2000; Altenburg, 2007). This approach focused on issues of physical and quantitative technical relationships and was used to describe the flow of physical inputs and services to the production of a final product. It also gives attention to income generation and distribution in the commodity chain, disaggregates costs and incomes between local and internationally traded components and analyzes the role of the chain on the national economy and its contribution to GDP. Further, it analyzes the interplay of objectives, constraints, and results from each type of stakeholder in the chain and recommended individual and collective strategies. At first, filières tended to be viewed as having a static character, reflecting relations at a certain point in time. The term has been applied to the domestic value chain, thus stopping at national boundaries (Kaplinsky and Morris, 2000).26 However, it then quickly spread to export commodity production. It considers the way to increase the efficiency of a value chain by improving activities of public marketing institutions and diminishing transaction costs when they deal with farmers. It focuses on the measurement of input-output relations, price, and value added at different phases of the production chain and tries to find the key actor who drives the whole chain (Raikes, Jensen, Ponte, 2000). This approach was mainly technical and concentrated on physical flows and prices (Altenburg, 2007). The global approach was first introduced by Gereffi (Gereffi and Korzeniewicz, 1994) to examine the ways in which firms and countries are globally integrated and to assess the determinants of global income distribution. They decompose total value chain earnings into the rewards that are achieved by different parties in the chain and understand how firms, regions, and countries are linked to the global economy. The global commodity chain (Gereffi and Korzeniewicz, 1994) focused on the coordination of globally dispersed, but linked, production systems. Gereffi has shown that many chains are characterized by a dominant party (or sometimes parties) who determines the overall character of the chain, and as lead firm(s) becomes responsible for upgrading activities within individual links and coordinating interaction between the links. This is a role of ‘governance,’ and here a distinction is made between two types of governance: those cases where the coordination is undertaken by buyers (‘buyer-driven commodity chains’) and those in which producers play the key role (‘producer-driven commodity chains’). The global value chain concept was developed from the global commodity chain. In addition to the notions about the input-output structure of commodity chains and their spatial distribution, it focused upon the governance structure of value chains. Key actors, the lead firms or power of value chains has the “capability to define and impose the parameters of contracts and subcontracts in their supply chain” (Altenburg, 2007).27 The level of impact in the value chain depends on the type of organization. In institutional economics, the difference occurs between market, network, and hierarchies. According to the density of coordination and degree of power asymmetry, three different types of network26. Kaplinsky and Morris (2000), p7. 27. P11. 20. Chapter 1. Literature review and theoretical framework.
(35) based governance are defined between two extremes of markets and hierarchies. Market linkages could exist with repeat transactions leading to low costs of switching to new partners for both parties. In the modular value chains, “suppliers make products to customer’s specifications” and “take full responsibility for competencies surrounding process technology, use generic machinery that limits transaction-specific investments, and makes capital outlays for components and materials on behalf of customers” (Altenburg, 2007).28 In the network of relations value chains, there are complex interactions between buyers and sellers, which often create mutual dependency and high levels of asset specificity. Quite different from the network of relations, in the network of captive value chains, small suppliers are transactional dependent on and get a high degree of monitoring and control from larger buyers. In the final extreme network hierarchy, the governance form is characterized by vertical integration with the dominant form of managerial control flowing from managers to subordinates, or from headquarters to subsidiaries and affiliates. Gereffi distinguished between buyer- versus producer-driven chains. A buyer-driven chain is a chain in which buyers are more powerful and achieve the largest gains from the respective production. On the other hand, in a producer-driven chain, producers are the key actors who drive the whole chain. The main difference in these chains is the governance pattern. These points of view are debated to be rigid and simplistic because of unclear distribution and discontinuous renegotiation as well as varying patterns of governances within the same product category (Altenburg, 2007). + Subsector and industry level analysis Subsector analysis was first introduced in the 1960s and became widespread in the agricultural marketing field of agricultural economics (Shaffer, 1973; Haggblade and Gamser, 1991; Holtzman, 2002; Altenburg, 2007) and then was applied in the development of smalland medium-size enterprises in many other sectors (Boomgaard et al., 1992). In this analysis, almost all key concepts of the value chain were used with a similar meaning. Agrifood systems include different actors such as individuals, enterprises, institutions, activities, etc., who perform distinct activities through the different stages of production to bring a product or service to consumers (Baker, 2006). This concept is almost overlapped by the concept of the value chain. In some cases, subsector analysis seems to have a broader meaning than value chain analysis, for example, it analyzes the impact of change in food consumption pattern and the relation between food production and rural livelihood. Industry level analysis focuses mainly on researching the industry-specific policy and its implementation in order to promote economic growth. It does not pay attention to the interfirm relation between suppliers and customers, the linkages, the flow between chain actors or value-added distribution. It examines upstream and downstream operations as major conditions for the core industry’s competitiveness. This perspective analyzes mainly the external factors for promoting economic growth such as industry-specific policy issues, land market issues, and unequal enforcement of policies among formal and informal enterprises. The limitation in this approach is inadequate policy analysis. In-depth industrial analyses are needed to find out constraints at the industry level, where causality links can be conclusively determined (Palmade, 2005; Altenburg, 2007). Developing these analyses, the World Bank’s Foreign Investment Advisory Service (FIAS) approached value chain analysis by measuring production time and costs at different stages of the value chain, then finding criteria for this metrics against international competitors and 28. P12. Chapter 1. Literature review and theoretical framework. 21.
(36) prioritizing policy interventions accordingly. It is “to detect policy and market failures rather than pro-active strengthening of individual firms or groups of firms” (Altenburg, 2007). + Network concepts The Global Production Network (GPN) approach (Ernst, 1999; Ernst and Kim, 2001) refers to the value chain as the flows of a production process which is organized vertically, horizontally, and diagonally in complex and dynamic configurations (Altenburg, 2007). They add social and institutional variation to the chain and focus on additional factors, which are not really included in the sequence to the process of creating added value. The concept National Innovation Systems (NIS) describes the embedding of firms in networks with two distinctive characteristics: focus on innovation rather than production; emphasis on domestic rather than global systems (Lundvall, 1992). It contains a system of actors working with each other to increase the innovation performance of a national economy. It defines the collaboration between the internal organizations of firms, inter-firm relationships, and relationships between institutions and firms. It includes some other elements of the chain such as institutions. It studies in depth the dynamics of innovation and learning. It contributes to the value chain theory by adding a variety of nation-specific factors: market conditions, managerial and technological competencies of enterprises, public infrastructure and regulations, norms and values, and the intensity and effectiveness of interaction between knowledge-using and knowledge-producing entities that are subject to external influences. It helps to widen the research perspective on the value chain. + Systemic competitiveness and the cluster concept The German Development Institute introduced the concept of systemic competitiveness in the 1990s (Esser et al., 1994; Altenburg, 2007). It argues that competitiveness of firms is based upon the quality of inter-firm relations and national systems of norms, rules and institutions that define economic incentives. It proposes a heuristic framework to analyze the political and economic determinants of successful industrial development, which distinguishes between four levels: The micro level within the firm and inter-firm networks, the meso level, the macro level of generic economic conditions, and the meta level, referring to underlying sociocultural structures. Clusters are composed of collections of firms and institutions that perform many of the functions segmented and described in value chains (Martin W. et al., 2007).29 They describe both horizontal and vertical links between the various businesses and other organizations that are instrumental in producing a product (or closely related products) or delivering a service. The literature on clusters stresses the benefits of enterprise agglomeration and geographic proximity, placing relatively more emphasis on the local environment (both policies and institutions, public and private) and the context in which it operates. The concept “chain” emphasis on regional environment is secondary, at best. Value chain literature tends to put less emphasis on external relations, while cluster analysis often omits the distribution of value generation among links on a chain. All the concepts discussed underscore the importance of linkages to gain value and advantages to compete on global markets. Thus, value chain is the term primarily analyzed in this paper as it is inclusive and incorporates supply, value addition, transactions, and market linkages.. 29. 22. Martin W. et al. (2007), p 9. Chapter 1. Literature review and theoretical framework.
(37) 1.1.2 Roles of the value chain approach The value chain is a good approach for small firms in developing countries to obtain information on upgrading and access to the global market (Pietrobelli and Rabellotti, 2004). It has also been used as a tool for small and medium-size enterprise (SME) development, with new methods of linking SME suppliers and service providers to the value chains of lead processors or marketers (GTZ-SME, 2008). Businesses have been using value chain analysis and implementation principles for years to formulate and implement competitive strategies. Corporations use it as a tool to improve their performance. The value chain has been reinforced as a tool for core competencies, comparative and competitive advantage, outsourcing, vertical and horizontal integration, and best practices (Martin W. et al., 2007).30 Value chains could be considered as a means for introducing new forms of production, technologies, logistics, labor processes, and organizational relations and networks (Ivarsson and Alvstam, 2005; Jacques H. T, 2011).31 Businesses use collaborative value chain concepts to identify efficiencies and competitiveness both within and among firms, acting on opportunities to build win-win linkages and collaboration. Technological developments that permit high levels of information sharing have reinforced the realization of businesses regarding value chain efficiencies, especially in supply management. Recently, governments and donors have come to realize that upgrading the performance of individual firms may have a little impact. They have shown significant interest in value chain analysis and implementation in their effort to devise interventions that reposition entire industries, build business competitiveness, and spur economic growth. Governments and donors can use value chain-based approaches as robust tools to protect threatened links, facilitate upgrading of others to generate greater returns, and to promote foreign direct investment (FDI) programs (Martin W. et al., 2007).32 The value chain has also been used by many international organizations in the development sector as a means of identifying poverty reduction strategies by upgrading along the value chain (Mitchell, J., Coles, C., and Keane, J. 2009). Despite these roles, the value chain approach has been argued to have some shortcomings. First, there is confusion due to overlapping terminology and concepts as it has ideas similar to those in economic organization. Second, although many case studies have been conducted, a clear definition of the concept is still missing. This leads to a constraint in the generalization of results. According to many authors, the definition of the concept is often unclear whether the result of particular chain studies can be applied to more general conditions or not. Finally, the third deficiency is along the same lines, an insufficiently defined theoretical framework (Gereffe et al., 2001).33. 1.1.3 Promotion of the value chain 1.1.3.1 Value chain analysis Value chain analysis identifies dynamic linkages between productive activities and transcends traditional economic and industry sectors by showing where value is added to a production 30. Martin W. et al. (2007), p10. 31. Ivarsson and Alvstam (2005); Jacques H. T (2011), p53. 32. Martin W. et al. (2007), p10-11. 33. P2-3. Chapter 1. Literature review and theoretical framework. 23.
Figure


+7


Documents relatifs
In this paper we provide a complete description of all bivariate polynomials that satisfy the Jacobi identity over infinite integral domains1. Although this description depends on
D’autres symptômes peuvent être retrouvés: le classique acouphène pulsatile, associé à un souffle perçu au niveau du globe oculaire; une exophtalmie; une diplopie par
To analyse the evidence, we first measured dynamism of rice VC upgrading in the 15 West African countries through four outcome in- dicators: (i) number of investments in
• Examining the BoS, including the management plan drawn up by the GI collective organization, making comments and giving their approval before it is transmitted to NOIP by the
What shapes the governance of the dairy value chain in Vietnam? Insights from Ba-Vì milkshed (Hanoi)
The local dairy value chain is dominated by smallholders and characterized by contractual relations between private milk collectors and industrial, semi-industrial, and cottage
We performed two sets of experiments. The first set related to OCSP-Stapling support in web browsers. We checked if the OCSP Stapling and Must Staple approaches were
The results of the study revealed farmers produce and different marketing different qualities of milk to two main buyers under the constraints of high input
However until now the process of servitization has been applied only onto the us- age phase of the product (e.g. services for remote machine maintenance, offering an airplane
