Purified bovine WC1
+gd T lymphocytes are activated by
staphylococcal enterotoxins and toxic shock syndrome
toxin-1 superantigens: proliferation response, TCR Vg
profile and cytokines expression
Youssef Fikri a, Olivier Denis b, Paul-Pierre Pastoret c, Jean Nyabenda a
a Unity of Cellular Immunology, Pasteur Institute Brussels, Rue Engeland 642, B-1180 Brussels, Belgium b Unity of Mycobacterial Immunology, Pasteur Institute Brussels, Rue Engeland 642, B-1180 Brussels,
Belgium
c Department of Immunology and Vaccinology, Faculty of Veterinary Medicine, University of Liège, B-4000
Liège, Belgium
KEYWORDS: Bovine gd T cells; Cytokines; Superantigen; T cell receptors
ABSTRACT
In this study, the ability of purified bovine gd T cells in vitro to be activated by superantigens (SAg) was investigated. Freshly isolated WC1+ gd T cells, in the presence of autologous glutaraldehyde-fixed or y-irradiated antigen presenting cells (APC) and IL-2, were incubated with staphylococcal enterotoxins A and B (SEA and SEB), and toxic shock syndrome toxin-1 (TSST-1). Both a proliferative response and the expression of particular T cell receptor genes of the y variable (TCR Vg) repertoire family were induced. Genes encoding TCR Vg1 and TCR Vg2 family, but not TCR Vg5 were detected. The cells also expressed cytokine transcripts, namely, those of IL-12, IFN-g and TNF-a, but not IL-2, IL-4, IL-6, IL-7 and IL-10. The activation and proliferation of freshly isolated gd T cells by non-processed antigens required two signals, one originating from the APC and a second dependent on exogenous IL-2. Our results show that purified bovine WC1+ gd T cells could be driven to proliferate and to express a particular TCRVg profile in response to superantigen activation. The possible implication of cytokines expressed by bovine gd T cells in immunopathogenesis is discussed.
Introduction
T lymphocytes include two populations, which are distinguished by their expression of either a heterodimeric ab or gd TCR. The function and significance of gd T cells in the immune system remains largely unknown. In ruminants, gd T cells constitute a prominent population of the PBMC, reaching up to 30% in calves [1,2]. Most circulating gd T cells in cows, sheep and pigs express a unique family of high molecular weight surface molecules, termed Workshop Cluster 1 (WC1) [3 – 5]. These cells are further characterised by their CD2−, CD4−, CD8−, CD3+ and TCR gd phenotype [3,5,6].
Staphylococcal enterotoxins (SE) classified A to I and toxic shock syndrome toxin-1 (TSST-1) are a group of exoproteins produced by Staphylococcus aureus (S. aureus). This bacterium is implicated in numerous pathological processes in mammals. It is, for example, one of the principal agents of mastitis occurring in cows, sheep, and goats, which are largely reacting to the
S. aureus toxins [7–10]. Experiments in human, in murine, and recently in bovine systems have demonstrated that SE and TSST-1 are members of the SAg family owing to their ability to stimulate large fractions of T cells which express particular TCR Vb or TCR Vg elements [11–15]. The molecular mechanisms of SAg stimulation of T cells, elucidated in experiments conducted on ab T cells, has revealed that SAg bind outside the peptide groove of the major histocompatibility complex II (MHC II) on APC [16–18] and induce characteristic TCR Vb profile [19]. Activation of T cells by superantigens, unlike conventional antigens, does not require internalisation and processing by APC [20]. SE and TSST-1 have been shown previously to act as superantigen in ruminants, by inducing proliferation and cytokine production by T cells [15,21]. However, the responding cells were not characterised. SEC activated WC1+ and CD8+ blast cells of bovine PBMC but not CD4+ T cells [22]. The likely interaction of the different cells in PBMC does not allow a clear distinc- tion between the primary action of antigen and the secondary interaction of factors produced by the cells. Stimulation of purified T cells subsets is needed for this purpose. We developed an in vitro system in which negatively purified WC1+ gd T cells were activated by staphylococcal toxins superantigen. The proliferation, the expression of the TCR Vg profile and the expression of cytokines were recorded.
Materials and methods
MATERIALS
Phosphate-buffered saline (PBS) without calcium and magnesium, Hank’s balanced salt solution (HBSS), cul- ture medium containing RPMI 1640, 2 mM L-glutamine, 25 mM hepes buffer, 100 IU/ml penicillin, 100 µg/ml streptomycin, 0.5 µg/ml fungizone and 10% foetal bovine serum (FCS) were supplied from Gibco BRL (Gibco BRL, Grand Island, NY, USA). Lymphoprep was purchased from Nycomed (Nycomed Pharma, Oslo, Norway), 2-aminoethylisothiouronium bromide (AET), SEA, SEB, TSST-1 and ConA from Sigma (Sigma Immunochemicals, St Louis, MO, USA) and recombinant human interleukin-2 (IL-2) from Boehringer (Boehringer, Engelheim, Germany). Magnetic cell sorting (MACS) columns, MACS separator and Goat anti-mouse IgG-labelled paramagnetic beads (GAMIg-MACS beads), were supplied by Miltenyi
(Miltenyi Biotech GmbH Bergisch Gladbach, Germany). Fluorescein isothiocyanate-conjugated F (ab') 2 fragment of rabbit anti-mouse immunoglobulin (FITC- F (ab') 2 fragment) was purchased from Dako (Dako A/S, Glostup, Denmark). The following murine monoclonal antibodies (MoAbs) reported at the International Ruminant Leukocyte Antigen Workshop [23] were used: CC8, CC63, CC15, 1H4 and ILA-24 specific for CD4, CD8, WC1, CD21 and monocytes, respectively. Flow cytometry analysis was performed on a FACS calibur (Becton Dickinson, Mountain View, CA, USA).
PURIFICATION OF BOVINE WC1+ YB T CELLS
WC1+ gd T cells were negatively purified from peripheral blood as described previously [24]. Using lymphoprep, PBMC were isolated from heparinised peripheral venous blood from 6 to 12-month-old cattle. PBMC at 5 × 10⁶ cells/ml were resuspended in culture medium and allowed to adhere for 60 min to plasmacoated gelatin. Non-adherent cells were enriched for T cells by passing the cells through a nylon wool column to remove B cells and the remaining monocytes. CD2+ T cells were depleted by rosetting T cells with AETtreated sheep red blood cells (SRBC). WC1+ gd T cells were further negatively separated from CD4+ and CD8+ T cells using MACS technique. The resultant population contained up to 97% of WC1+ gd T cells as determined by flow cytometric analysis.
PREPARATION OF ANTIGEN PRESENTING CELLS
Adherent cells used as APC were prepared as follows. PBMC at 5 × 10⁶ cells/ml were allowed to adhere for 90 min to plasma coated-gelatin [25]. Non-adherent cells were removed by washing three times with HBSS and adherent cells were detached by incubating for 5 min with HBSS containing 0.2% EDTA and washed three times. APC were exposed to 5000 Rad of g-irradiation from a 137Cs source. Alternatively, they were fixed in glutaraldehyde HBSS according to the method of Shimonkevitz et al. [26]. Briefly, APC suspended at 5 × 10⁶ cells/ml in HBSS was mixed with an equal volume of 0.1% (w/v) glutaraldehyde in HBSS. After fixing for 2 min at room temperature, an equal volume of 0.2% L-lysine monohydrochloride in HBSS pH 7.4 was added to block free aldehyde groups. After 5 min, fixed cells were pelletted and washed twice in HBSS. Evaluation of the APC phenotypes revealed that 80% of these cells were monocytes (results not shown).
PROLIFERATION ASSAYS
PBMC (2 × 10⁵ cells) were stimulated in 0.2 ml in triplicate with graded doses of SEA, SEB, or TSST-1 for various periods. Purified WC1+ gd T cells (2 × 10⁵ cells) and autologous glutaraldehyde-fixed (or g-irradiated) APC (2 × 10⁴ cells) were stimulated in 0.2 ml in triplicate with SEA, SEB, TSST-1 (103 ng/ml), or ConA (1 µg/ml) for 4 days. Where indicated, recombinant human interleukin-2 (IL-2) was added at a final concentration of 50 units/ml. Cultures were pulsed for the final 18 h with 1 µCi of 3[H]thymidine, harvested and radioactivity was determined by liquid scintillation counting.
FLOW CYTOMETRY ANALYSIS
Cells were washed twice with ice-cold PBS containing 1% BSA. For 30 min, 106 cells per test were incubated on ice with an appropriate dilution of MoAb, washed with PBS and further
incubated 30 min on ice with FITC-F (ab') 2 fragment. After washing, phenotypic analysis was performed on FACS calibur flow cytometer using the cellquest software. Lymphocytes were gated on the basis of their characteristic forward and side scatter profile. Analysis of the proportion of blast cells in cell cultures was carried out by evaluation of forward scatter (FSC) versus side scatter (SSC) and gating around cells of interest for immunofluorescence analysis (i.e. small lymphocytes, large blast cells). Data are expressed as the percentage of immunofluorescence positive cells per total number of cells counted.
REVERSE TRANSCRIPTASE POLYMERASE CHAIN REACTION
Total RNA was prepared by lysis in ultraspec™ RNA-reagent (AMS Biotechnology Ltd, Witney, Oxon, UK) of uncultured or cultured WC1+ gd T cell (107) and from PBMC activated with ConA. RNA concentrations were determined by spectrophotometer readings. The products used for the cDNA synthesis were from Gibco BRL except where otherwise stated. The cDNA was synthesised for 1 h at 37°C in a 40-µl cocktail containing 10 µg total RNA in diethyl pyrocarbonate (DEPC)-dH2O, 2 µl oligo-dT primer at 500 µg/ml, 4 µl of a 10 mM dNTP mix, 1µl RNasin at 40 U/ml (Promega, Madison, WI, USA), 1 µl Moloney murine leukaemia virus reverse transcriptase (MMLV-RT) at 200 U/ml and 8 µl of 5 × concentrated RT buffer (250 mM Tris–HCl, pH 8.3, 375 mM KCl, 15 mM MgCl2), and further incubated at 65°C for 5 min. To detect individual gene transcripts, cDNA (3 µl per primer pair) was added to 5 µl of 10 × concentrated PCR buffer (300 mM Tris–HCl pH 9.0, 50 mM MgCl2, 300 mM KCl, 0.5% W-1 buffer), 1.25 µl of a 10 mM dNTP, 2.5 µl of each 10 µM sense/antisense primers, 0.5 µl Taq polymerase at 5000 U/ml and dH2O to a final volume of 50 µl. For the individual cytokines, primer sequences used are listed in Table 1. The PCR reactions were performed in a PCR thermocycler under the following conditions: for b-actin, IL-2, IL-4, IL-7 and IL-10: one cycle (1 min at 94°C), followed by 30 cycles (94°C, 1 min; 50°C, 1 min; 72°C, 2 min), and for IL-6, IL-12, IFN-g and TNF-a: one cycle (1 min at 94°C), followed by 30 cycles (94°C, 30 s; 60°C, 45 s; 72°C, 1 min), and for the final extension cycle: 72°C, 10 min. Reaction products (10 µl) were visualised after electrophoresis on a 2% agarose gel containing ethidium bromide. PCR technique was also used to amplify the expressed TCR Vg regions. Primer sequences used are defined in Table 1 and the PCR reactions were performed in a PCR thermocycler under the following conditions: one cycle (1 min at 94°C), followed by 30 cycles (94°C, 30 s; 60°C, 45s; 72°C, 1 min), and for the final extension cycle: 72°C, 10 min. Reaction products (10 µl) were visualised after electrophoresis on a 2.7% Metaphor agarose gel using ethidium bromide. This agarose is an intermediate melting temperature agarose with high resolution, resolving PCR products and DNA fragments differing in size by 1% (SanverTECH, Antwerpen, Belgium). Amplified DNA fragments were gel purified, eluted using Concert Gel Extraction Systems (Gibco BRL) and sequenced (Eurogentec, Seraing, Belgium).
STATISTICAL ANALYSIS
The results were expressed as the mean ± standard deviation (S.D.) and compared using Student’s t-test. The significance level was set at P < 0.05.
Table 1 : Bovine TCR Vy and cytokine primers
Gene Fragment (size) Primer 5' → 3' Reference TCR Vyl 310 TATCTTCCAACGCCAAAGGGGa
TCR Vy2 299 CACAGGTATCTTCCAACATGG
AGACGGCACAGTAGTAGATGC Gen Bank (D13648) TCR Vy5 312 TCGTGTCATGCAGGTATCTTCC
TTAAGTAACTCCCCATCCC Gen Bank (D16133) IL-2 548 ACGGGGAACACAATGAAAGAAGT CGTAGGGCTTACAAAAAGAATCT [27]
IL-4 423 GTCTTTCAGCGTACTTGT
TGCATTGTTAGCGTCTCCT [28] IL-6 534 CCCTCACTCCATTCGCTGTC
TGCGTTCTTTACCCACTCG [29] IL-7 530 CCAGTAGCATCATATGATTGTG CGGATAGATTCTTGGAGGACA [30] IL-10 518 ACAGCTCAGCACTGCTCTGTT CGTTOTCATGTAGGATTCTATG [30] IL-12 449 GAGGCGAGGCTCTGAGTC CAGUTTCTTGGGTGGGTCT [31] IFN-y 426 CTGTGGGCTTTTGGGTTTTTCTG CTCTTCCGCTTTCTGAGGTTAGA [32] TNF-ex 549 CTGCACTTCGGGGTAATCGG CAGGGCGATGATCCCAAAGTA [33] b-Actin 400 ACGTAGCAGAGCTTCTCCTTGATG CCTTTTACAACGTGCGTGTG [34]
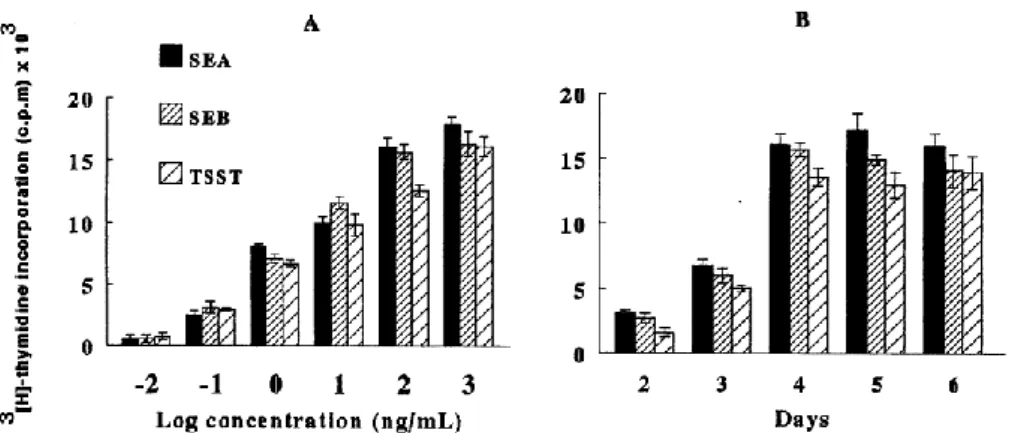
Fig. 1. Proliferative response of PBMC to SEA, SEB and TSST-1. PBMC (2 × 10⁵ cells/well) were incubated (A) with gradual doses of SEA, SEB and TSST-1 for 4 days; and (B) with 103 ng/ml of either toxin for various periods between 2 and 6 days. Results show mean cpm ± S.D. for three animals. Background levels of 3[H]thymidine incorporation were less than 1000 c.p.m.
Results
SUPERANTIGENS SE AND TSST-1 GROWTH ACTIVATION OF WC1+ YB T CELLS
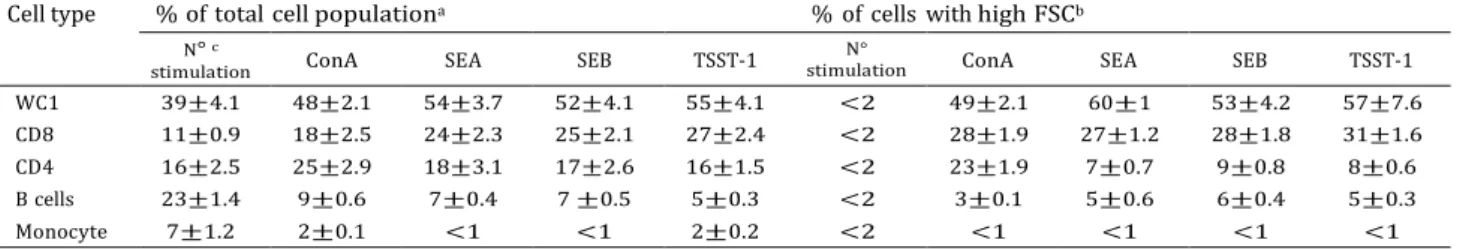
The mitogenic activities of SEA, SEB and TSST-1 were investigated on PBMC stimulated with graded doses. Maximal proliferation of PBMC was obtained at 103 ng/ml concentration for all tested toxins (Fig. 1A) and occurred between 4 and 6 days of culture (Fig. 1B). PBMC from three animals, cultured with individual toxins or ConA, were analysed by flow cytometry on WC1+, CD4+ and CD8+ T cells, B cells and monocytes (Table 2). At day 4 WC1+ gd T cells stimulated with SEA, SEB or TSST-1, increased from 39% of the initial population to 54%, 52% and 55% of total live cells, respectively, and CD8+ T cells increased from 11% of the initial population to 24%, 25% and 27%, respectively. Other cell populations including CD4+ T cells and B cells did not proliferate. Dot plot of granularity (SSC) versus size (FSC) analysis demonstrated the presence of large activated blast cells readily distinguishable from small resting cells. By gating the appropriate population, approximately 60% of the SEA induced blasts were shown to be WC1+, 27% were CD8+ and 7% were CD4+. Similar trends were observed for the other toxins. These observations indicated that the WC1+ gd T cells in PBMC are the most responsive cells to SEA, SEB, and TSST-1 toxins.
Experiments were performed to determine whether the antigen processing of the staphylococcal toxins by APC was required for WC1+ gd T cell proliferation or not. An in vitro model was developed in which negatively purified WC1+ gd T cells, either toxins, autologous g-irradiated or glutaraldehyde-fixed APC, and IL-2 were cocultured in various combinations (Table 3). The proliferation response indicated that purified gd T cells grow similarly to processed antigens by g-irradiated APC as to non-processed antigens presented by glutaraldehyde-fixed APC in the presence of IL-2. A small but significant level (P<0.05) of the response was, however, noted between the two outlined systems. Isolated WC1+ gd T cells failed to proliferate in response to either toxins or to IL-2 alone, in the presence of autologous APC, indicating that the proliferative response of these cells to superantigen required two complementary signals, one provided by APC and the other by exogenous IL-2.
TCR VGAMMA EXPRESSION PROFILE
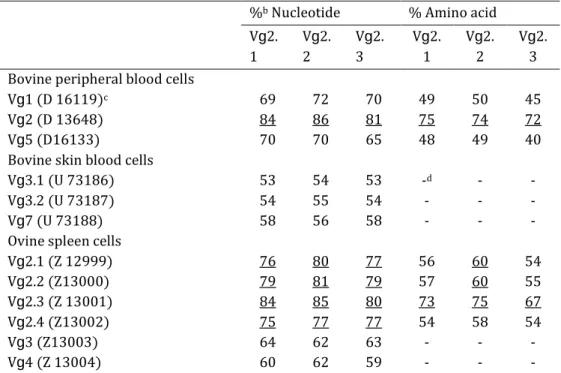
TCR Vg genes expression from purified WC1+ gd T cells stimulated in vitro with SEA, SEB, TSST-1, or ConA in the presence of autologous fixed-APC and IL-2, was analysed at day 4 using a RT-PCR technique. The cDNA products were visualised on 2.7 Metaphor agarose gels (Fig. 2). The gel-purified DNA products sequenced and predicted amino acid sequences showed five distinct TCR Vg region segments in 22 PCR amplified DNA products. TCR Vg1 and TCR Vg5 gene sequences have been detected before in cattle [35], while TCR Vg2.1, Vg2.2 and Vg2.3 gene segments are described here for the first time (Fig. 3). The nucleotides and predicted amino acid sequences of the three new TCR Vg genes sequenced were aligned and compared to major functional TCR Vg families in cattle [35] and sheep [36,37] (Table 4). The convention of naming new bovine Vg-genes according to their identity to known bovine homologues was followed. The different TCR Vg sequences of the bovine species showed 65–75% nucleotide and 51–61% amino acid identity [35]. An arbitrary value of 75% for nucleotide and 61% for amino acid was adopted in the determination of sequence homology. New bovine TCR Vg2.1, TCR Vg2.2 and TCR Vg2.3 segments had >84% nucleotide identity compared to each other and 84%, 86% and 81% identity to bovine TCR Vg2 derived from peripheral blood, respectively. The amino acid sequences of TCR Vg2.1, Vg2.2 and Vg2.3 segments show >77% identity to each other and 75%, 74% and 72% similarity to those of Vg2, respectively. In consideration of the sequence homology and based on the results shown in Fig. 2, we showed that purified WC1+ gd T activated with SEA, SEB or TSST-1 in the presence of glutaraldehyde-fixed APC and IL-2, express an identical TCR Vg profile encoding TCR Vg1, TCR Vg2.1, TCR Vg2.2 and TCR Vg2.3, but not TCR Vg5. These cells cultured under the same conditions with ConA, which stimulates T cells independently of TCR variable regions, expressed all TCRVy genes we tested for. Purified WC1+ gd T cultured in the presence of fixed-APC in medium alone, with either toxins or with IL-2, did not express any TCR Vg gene transcripts. Purified WC1+ gd T and glutaraldehyde treated APC cultured individually in the presence of either toxins or ConA and IL-2 gave negative results (not shown).
CYTOKINE MRNA EXPRESSION
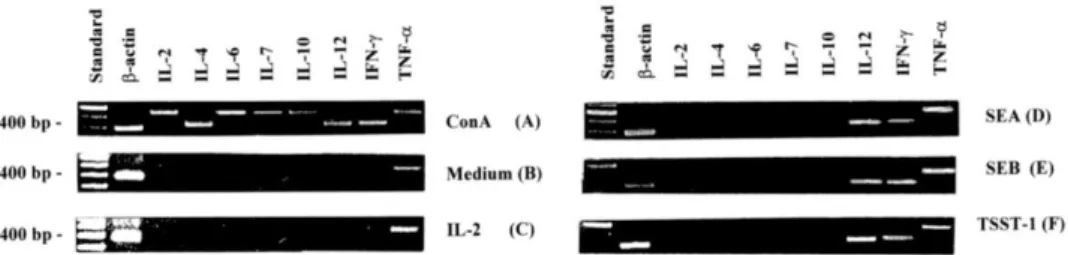
Cytokine expression on purified WC1+ gd T cells that had been incubated with glutaraldehyde-fixed APC in the presence of SEA, SEB or TSST-1 and IL-2 for 48 h was investigated. IL-12, IFN-y and TNF-ex mRNA were expressed on WC1+ gd T cells, while other cytokines including 2, IL-4, IL-6, IL-7 and IL-10 were not detectable (Fig. 4D–F). WC1+ gd T cells cultured in the presence of glutaraldehyde-fixed APC in medium with or without IL-2 failed to produce any cytokine transcripts except TNF-ex (Fig. 4B, C). The same held true for the cells cultured in medium alone, with either toxin in the presence and absence of IL-2 or with either toxins and fixed-APC. Glutaraldehyde-treated APC cultured in the presence of either toxins and IL-2 proved all negative (results not shown). As positive controls, all the cytokines examined were readily detectable in PBMC stimulated with ConA (Fig. 4A).
Table 2. FACS analysis of the ratio shift in cell population after 4 days culture of bovine PBMC with superantigens or ConA
Cell type % of total cell populationa % of cells with high FSCb
N° c
stimulation ConA SEA SEB TSST-1
N°
stimulation ConA SEA SEB TSST-1
WC1 39 ± 4.1 48 ± 2.1 54 ± 3.7 52 ±4.1 55 ± 4.1 <2 49 ± 2.1 60 ± 1 53 ± 4.2 57 ± 7.6
CD8 11 ± 0.9 18 ± 2.5 24 ± 2.3 25 ± 2.1 27 ± 2.4 <2 28 ± 1.9 27 ± 1.2 28 ± 1.8 31 ± 1.6
CD4 16 ± 2.5 25 ± 2.9 18 ± 3.1 17 ± 2.6 16 ± 1.5 <2 23 ± 1.9 7 ± 0.7 9 ± 0.8 8 ± 0.6
B cells 23 ± 1.4 9 ± 0.6 7 ± 0.4 7 ±0.5 5 ± 0.3 <2 3 ± 0.1 5 ± 0.6 6 ± 0.4 5 ± 0.3
Monocyte 7 ± 1.2 2 ± 0.1 <1 <1 2 ± 0.2 <2 <1 <1 <1 <1
a Percentage of viable cell populations.
b Percentage of blast-sized cell populations.
c Background levels measured prior to stimulation (day 0). Results are represented as Mean± S.D. for three animals.
Table 3. The proliferative response of WC1+ gd T cells to superantigensa
Stimulus b Treatment of APC
g-Irradiated Glutaraldehyde-fixed Medium 853±240 923±230 IL-2 952±212 983±293 SEA 936±193 984±207 SEB 881±185 981±257 TSST-1 918±193 952±125 SEA+IL-2 15 417±1444c 10 568±875c SEB+IL-2 16 016±1650c 10 421±1132c TSST-1+IL-2 14 081±1671c 9379±680c
a Purified WC1+ gd T cells (2×10⁵ cells/well) were cultured in triplicate in presence of g-irradiated or glutaraldehyde-fixed autologous APC (2×10⁴ cells/well) as described in Section 2.
b IL-2 was added at a final concentration of 50 units/ml and SAg at 103 ng/ml. The proliferation was assessed by 3[H]thymidine incorporation during the last 18 h of 4 days culture. Results represent the mean cpm_S.D. of three independent
experiments from three animals.
c P<0.05 (significant differences between g-irradiated and Glutaraldehyde-fixed cells).
Fig. 2. RT-PCR products of TCR Vg1 (A), TCR Vg2.1, Vg2.2 and Vg2.3 (B), TCR Vg5 (C) and b-actin (D) in purified WC1+ gd T cells non-cultured, cultured with SEA, SEB, TSST-1 or ConA in the presence of glutaraldehyde-fixed APC and IL-2 for 4 days. Total RNA from WC1+ gd T cells cultured for 4 days in the presence of glutaraldehyde-fixed APC in medium alone (lane 3) or with IL-2 (lane 4) were negative.
Fig. 3. Nucleotide and predicted amino acid sequences of three new bovine TCR Vg segments. Nucleotides (A) and predicted amino acid (B) sequences of bovine TCR Vg2.1, TCR Vg2.2 and TCR Vg2.3 regions expressed by purified WC1+ gd T cells activated with SEA, SEB, TSST-1 or ConA in the presence of glutaraldehyde-fixed APC and IL-2. Dotted lines (….) represent identical nucleotide sequences and dashed lines (---) indicate the absence of nucleotides. The percentage of identity between sequences is shown in Table 4.
Table 4. Nucleotides and predicted amino acid identity of bovine and ovine TCR Vg chain familiesa %b Nucleotide % Amino acid
Vg2. 1 Vg2. 2 Vg2. 3 Vg2. 1 Vg2. 2 Vg2. 3 Bovine peripheral blood cells
Vg1 (D 16119)c 69 72 70 49 50 45
Vg2 (D 13648) 84 86 81 75 74 72
Vg5 (D16133) 70 70 65 48 49 40
Bovine skin blood cells
Vg3.1 (U 73186) 53 54 53 -d - -
Vg3.2 (U 73187) 54 55 54 - - -
Vg7 (U 73188) 58 56 58 - - -
Ovine spleen cells
Vg2.1 (Z 12999) 76 80 77 56 60 54 Vg2.2 (Z13000) 79 81 79 57 60 55 Vg2.3 (Z 13001) 84 85 80 73 75 67 Vg2.4 (Z13002) 75 77 77 54 58 54 Vg3 (Z13003) 64 62 63 - - - Vg4 (Z 13004) 60 62 59 - - -
a Purified WCl+gd T cells (2×10⁵ cells/well) were cultured with SEA, SEB, TSST-1 (103 ng/ml),
or ConA (10 µg/ml) in the presence of glutaraldehyde-fixed APC (2×10⁴ cells/well) and IL-2
(50 units/ml) for 4 days.
b The percentage of identity between sequences is shown. Identities >75% for nucleotides and
>60% of amino acid indicating homologous genes, are underlined.
c Accession between brackets.
Fig. 4. RT-PCR products of b-actin, IL-2, IL-4, IL-6, IL-7, IL-10, IL-12, IFN-g and TNF-a in purified WC1+ gd T cells activated with SEA (D), SEB (E) or TSST-1 (F) in the presence of glutaraldehyde-fixed APC and IL-2 for 4 days. Total RNA from PBMC activated with ConA was used as positive control (A); and the RNA from WC1+ gd T cells cultured in the presence of glutaraldehyde-fixed APC in medium alone (B) or with IL-2 (C) as controls. A 100 base pair DNA ladder in lane 1 indicates the fragment size.
Discussion
The superantigenic activity of SE and TSST-1 has been previously reported in ruminant on ab T cells [15,19]. These toxins required MHC II molecules of accessory cells to induce a proliferative response of bovine total T lymphocytes [21]. In our study, SEA, SEB and TSST-1 were also found to strongly stimulate proliferative responses in bovine PBMC. Dot plot analysis of the responder cell populations in PBMC, stimulated with either of these toxins, revealed proliferation of WC1+ and CD8+ T cells but not of CD4+ T cells and B cells. Similar results were recently reported using SEC [22]. The superantigenic activation of pure gd T cells can help understand the significance of these cells in the immune system. This study was designed in order to characterise freshly purified WC1+ gd T cells in response to superantigens SEA, SEB and TSST-1. Negative isolation of WC1+ gd T cells permitted the achievement of a high degree of purity (>97%) as reported previously [24]. The proliferative response, the TCRVg profile and the cytokine expression results were recorded.
The requirement for signals provided by APC and exogenous IL-2 for the proliferation of WC1+ gd T cell has been reported previously in effective stimulation with mitogens [28] and in primary stimulation with specific antigens [30]. In our model, APC was fixed with glutaraldehyde in order to avoid antigen processing and to favour the presentation of the toxins in superantigenic manner to WC1+ gd T cells. Here also gd cells response to superantigen required two signals, one from APC and the other from IL-2. Costimulatory signals delivered by APC to the initial bias of naive T cells towards Th1 or Th2 are far from clearly understood. Soluble costimulatory factors cannot be considered in our system dealing with fixed or inactivated APC. Therefore, only contact-dependent factors could account for the priming of the gd T cells. The best characterised accessory molecules CD80, CD86 and CD40, and their respective T cell counter-receptors CD28, CTLA4 and CD40L, have been recently identified in bovine [24,38,39]. One attractive hypothesis of the gd T cells activation by APC binding superantigens would involve the interaction of one or different couples of those molecules to constitute costimulatory signals. This hypothesis is actually under study in our laboratory. The list of mentioned accessory molecules are more than probably not exhaustive. Other not yet defined bovine adhesion molecules might indeed, function in the costimulation process.
Superantigens stimulate large number of T cells via Vb or Vg-specific TCR [11,15,40]. In our study, the direct analysis of the diversity of TCR Vg genes expression on purified WC1+ gd T cells
stimulated with staphylococcal toxins demonstrated TCR Vg1 and TCR Vg2 family profiles but not TCR Vg5. In contrast WC1+ gd T cells cultured in the presence of ConA, whose mitogenic stimulation does not depend on a particular variable part of the TCR, expressed all of the TCRVg genes analysed (Fig. 2). These results strongly suggest that the activation of bovine gd T cells by staphylococcal toxins is dependent on certain Vg elements, comparable to the Vb in bovine ab T cells superantigen stimulation [15].
The production of cytokines by gd T cells has been reported in several species including humans, mice and ruminants. In bovine systems, SE and TSST-1 represent powerful in vitro activators of PBMC, inducing the production of cytokines including IL-2, IFN-g and TNF-a cytokines [21]. In this study, cytokines ex- pressed by purified WC1+ gd T cells in response to staphylococcal toxins included IL-12, IFN-g and TNF-a but not IL-2, IL-4, IL-6, IL-7 and IL-10. Several reports have previously shown that freshly isolated gd T cells constitutively express TNF-a transcripts [24,30]. The absence of the expression of all other cytokine transcripts tested was observed on uncultured purified WC1+ gd T cells or cells cultured in medium supplemented or not with IL-2 in the presence of fixed-APC without antigens. Consequently, the induction of IL-12 and IFN-g transcripts on WC1+ gd T cells activated with toxins was solely a manifestation of superantigenic toxin stimulation.
Little is known about the physiopathologic role of the gd T cells. The recognition of the cytokine expression pattern of purified WC1+ gd T cells stimulated with staphylococcal toxins, might help us to understand the pathogenesis of S. aureus producing toxins in ruminants. For example, direct evidence indicating the contribution of some cytokines to the development of inflammatory reactions in bovine mammary gland has been provided by Sordillo et al. [41,42]. These authors demonstrated that the infusion of high doses of recombinant bovine IFN-g or recombinant bovine IL-2 into bovine mammary gland can lead to cellular and biochemical changes in milk composition as observed in animals with mastitis. Infusion of recombinant human TNF-a into cow teat cistern has also been reported to induce significant accumulation of neutrophils [43], the primary sign of mammary gland infection [44]. Recently, Taylor et al. have shown the expression of IL-12 mRNA in cells derived from milk in cows with mastitis [45]. These findings, combined with results presented in the present work, suggest that gd T cells, abundant in mammary gland, may contribute to the inflammatory reaction of this organ in response to infection with S. aureus.
In conclusion, two signals were required to stimulate freshly isolated WC1+ gd T cells with staphylococcal superantigen; one derived from APC and a second dependent on exogenous IL-2. In this in vitro model purified WC1+ gd T cells proliferated in response to non-processed antigens and induced particular Vg elements, both characteristics of superantigen stimulation. Finally, the demonstration of inflammatory cytokine expression to SE and TSST-1 stimulation strongly suggests that gd T cells play an important role in S. aureus infections.
Acknowledgements
The authors wish to gratefully thank the foundation ‘Les amis de l’institut Pasteur, Bruxelles’, for financial support granted to one of us (F.Y.). Our thanks to Dr I. Magrath, INCTR (International Network for Cancer Treatment and Research) Pasteur Institute Brussels, Rue Engeland 642, B-1180 Brussels, Belgium, for reading of the manuscript. The excellent technical assistance of G. Treutens and F. Keuterickx is acknowledged.
References
[1] W.R. Hein, C.R. Mackay, Immunol. Today 12 (1991) 30 – 34.
[2] C.R. Mackay, J.F. Maddox, M.R. Brandon, Eur. J. Immunol. 16 (1986) 19 – 25.
[3] C. Clevers, N.D. MacHugh, A. Bensaid, S. Dunlap, C.L. Bald- win, A. Kaushal, et al., Eur. J. Immunol. 20 (1990) 809 – 817.
[4] W.I. Morrison, W.C. Davis, Vet. Immunol. Immunopathol. 27 (1991) 71 – 76.
[5] M.M. Carr, C.J. Howard, P. Sopp, J.M. Manser, K.R Parsons, Immunology 81 (1994) 36 – 40. [6] C.J. Howard, P. Sopp, K.R. Parsons, J. Finch, Eur. J. Immunol. 19 (1986) 757 – 763.
[7] K. Kenny, R.F. Reiser, F.D. Bastida-Corcuera, N.L. Norcross, J. Clin. Microbiol. 31 (1993) 706 – 707. [8] T. Matsunaga, S. Kamata, N. Kakiichi, K. Uchida, J. Vet. Med. Sci. 55 (1993) 297 – 300.
[9] J.A. Orden, D. Cid, M.E. Blanco, J.A. Ruiz Santa Quinteria, E. Gomez-Lucia, R. De La Fuente, Acta. Pathol. Microbiol. Immunol. Scand. 100 (1992) 132 – 134.
[10] J. Valle, E. Gomez-Lucia, S. Piriz, J. Goyache, J.A. Orden, S. Vadillo, Appl. Environ. Micribiol. 56 (1990) 1323 – 1326.
[11] J.E. Callahan, A. Herman, J.W. Kappler, P. Marrack, J. Immunol. 144 (1990) 2473 – 2479. [12] R. Carlsson, H. Fischer, H.O. Sjogren, J. Immunol. 140 (1988) 2484 – 2488.
[13] P. Marrack, M. Blackman, E. Kushnir, J. Kappler, J. Exp. Med. 171 (1990) 455 – 464. [14] C.J. Rust, F. Verreck, H. Vietor, F. Koning, Nature 346 (1990) 572 – 575.
[15] J.R. Deringer, R.J. Ely, S.R. Monday, C.V. Stauffacher, G.A. Bohach, Infect. Immun. 65 (1997) 4048 – 4054.
[16] P. Dellabona, J. Peccoud, P. Kappler, P. Marrack, C. Benoist, D. Mathis, Cell 62 (1990) 1115 – 1121. [17] T.S. Jardetzky, J.H. Brown, J.C. Gorga, L.J. Stern, R.G. Urban, C.V. Chi, et al., Nature 368 (1994) 711 – 718.
[18] J. Kim, R.G. Urban, J.L. Strominger, D.C. Wiley, Science 266 (1994) 1870 – 1874.
[19] J.C. Marr, J.D. Lyon, J.R. Roberson, M. Lupher, W.C. David, G.A. Bohach, Infect. Immun. 61 (1993) 4254 – 4262.
[20] A.C. Wood, I. Tood, A. Cockayne, J.P. Arbuthnott, FEMS Microbial. Immunol. 76 (1991) 121 – 134. [21] Y. Yokomizo, Y. Mori, Y. Shimoji, S. Shimizu, H. Sentsui, M. Kodama, H. Igarashi, J. Vet. Med. Sci. 57 (1995) 299 – 305.
[22] W.A. Ferens, W.C. Davis, M.J. Hamilton, Y.H. Park, C.F. Deobald, L. Fox, et al., Infect. Immun. 66 (1998) 573 – 580.
[23] C.J. Howard, J. Naessens, Vet. Immunol. Immunopathol. 25 (1993) 25 – 48. [24] Y. Fikri, J. Nyabenda, M. Denis, P.P. Pastoret, Vet. Res. 31 (2000) 229 – 239.
[25] B.M. Goddeeris, C.L. Baldwin, O. Ole-MoiYoi, W.I. Morrison, J. Immunol. Methods 165 (1986) 165 – 173.
[26] R. Shimonkevitz, J. Kappler, P. Marrack, H. Grey, J. Exp. Med. (1983) 158 – 167.
[27] D.P. Cerretti, K. McKereghan, A. Larsen, D. Cosman, S. Gillis, P.E. Baker, J. Immunol. 136 (1986) 4561 – 4564.
[28] W.C. Brown, C.D. William, H.C. Sang, A.E.D. Dirk, A.S. Gary, Cell Immunol. 153 (1994) 9 – 27. [29] L. Droogmans, I. Cludts, Y. Cleuter, R. Kettmann, A. Burny, DNA Sequence 411 (1992) 411 – 413. [30] R.A. Collins, P. Sopp, K.I. Gelder, W.I. Morrison, C.J. Howard, Scand. J. Immunol. 44 (1996) 444 – 452. [31] W.L. Goff, K.I. O’Rourke, W.C. Johnson, P.A. Lacy, W.C. Davis, CR Wyatt 18 (1998) 139 – 149.
[32] D.P. Cerretti, K. McKereghan, A. Larsen, D. Cosman, S. Gillis, P.E. Baker, J. Immunol. 136 (1986) 4561 – 4564.
[33] I. Cludts, Y. Cleuter, R. Kettmann, A. Burny, L. Droogmans, Cytokine 5 (1993) 336 – 341. [34] W.C. Brown, C.D. William, H.C. Sang, A.E.D. Dirk, A.S. Gary, Cell. Immunol. 153 (1994) 9 – 27. [35] N. Ishiguro, Y. Aida, T. Shinagawa, M. shinaguawa, Immunogenetics 38 (1993) 437 – 443. [36] W.R. Hein, L. Dudler, EMBO J. 12 (1993) 715 – 724.
[37] W.R. Hein, L. Dudler, Immunology 91 (1997) 58 – 64.
[38] A. Hirano, W.C. Brown, W. Trigona, W. Tuo, D.M. Estes, Vet. Immunol. Immunopathol. 61 (1998) 251 – 263.
[39] C.J. Howard, P. Sopp, J. Brownlie, L.S. Kwong, K.R. Parsons, G. Taylor, J. Immunol. 159 (1997) 5372 – 5382.
[40] D. Kabelitz, K. Pechhold, A. Bender, S. Wesselborg, D. Wesch, K. Friese, et al., Immunol. Rev. 120 (1991) 71 – 78.
[41] L.M. Sordillo, M. Snider, L.A. Babiuk, Can. J. Vet. Res. 56 (1992) 22 – 27.
[42] L.M. Sordillo, M. Snider, H. Hughes, G. Afseth, M. Campos, L.A. Babiuk, J. Dairy Sci. 74 (1991) 4164 – 4174.
[43] K. Persson, I. Larsson, C. Hallen Sandgren, Vet. Immunol. Immunopathol. 371 (1993) 99 – 112. [44] M.J. Paape, W.P. Wergin, A.J. Guidry, R.F. Guidry, J. Dairy Sci. 62 (1997) 135 – 153.
[45] B.C. Taylor, R.G. Keefe, J.D. Dellinger, Y. Nakamura, J.S. Cullor, J.L. Stott, Cell. Immunol. 182 (1997) 68 – 76.