Original article
Purification and characterisation of bovine
WC1
+γδ
T lymphocytes from peripheral blood
Youssef F
IKRIa, Jean N
YABENDAa*, Martine D
ENISb,
Paul-Pierre P
ASTORETca Unité d’immunologie cellulaire, Institut Pasteur de Bruxelles, Rue Engeland 642, 1180 Bruxelles, Belgium
b SmithKline Beecham Biologicals, Rue de l’Institut 89, 1330 Rixensart, Belgium c Département d’Immunologie et de Vaccinologie, Faculté de Médecine Vétérinaire,
Université de Liège, Sart Tilman, 4000 Liège, Belgium (Received 10 June 1999; accepted 12 November 1999)
Abstract – In order to isolate and characterise resting WC1+γδT cells from cattle, we developed a protocol for purifying these cells by negative selection from peripheral blood. The purification method included five steps: separation of mononuclear cells on lymphoprep, depletion of mono-cytes by adherence to plasma-coated gelatin, enriching T cells on a nylon wool column, depleting CD2+ T cells by sheep red blood cells (SRBC), and finally depleting CD4+and CD8+T cells by the mag-netic cell sorting technique (MACS). This procedure proved efficient and reproducible, and the purity of the isolated WC1+γδT cells was more than 97% as analysed by flow cytometry (FACS). Cytokines and costimulatory molecules mRNA expression was assessed by the reverse transcriptase polymerase chain reaction (RT-PCR) technique in freshly isolated resting WC1+T cells. We found that purified uncultured WC1+T cells express TNF-α, CD28, CTLA-4 and IL-2RαmRNA tran-scripts but do not express those for IL-2, IL-4, IL-6, IL-10 and IFN-γ. The expression of CD28 and CTLA-4 transcripts on bovine WC1+T cells indicates that these genes are evolutionarily conserved.
antigen / cytokine mRNA expression / γδT lymphocyte
Résumé – Purification et caractérisation des cellules bovines T γδWC1+du sang périphérique.
Afin de purifier et de caractériser les cellules T γδdu type WC1+d’origine bovine, nous avons déve-loppé un protocole de purification par sélection négative de ces cellules contenues dans le sang péri-phérique. La méthode de purification comporte cinq étapes, à savoir : la séparation des cellules mononucléés sur lymphoprep, la déplétion des monocytes par adhérence sur de la gélatine couverte de plasma, l’enrichissement des cellules T sur colonne de nylon, la déplétion des cellules T du type CD2+par formation des rosettes avec les globules rouge du mouton, et enfin la déplétion des cellules T CD4+et CD8+par la technique de « Magnetic cell sorting » (MACS). Le procédé s’est révélé
* Correspondence and reprints
1. INTRODUCTION
Several domestic animal species, includ-ing ruminants and pigs, possess a large num-ber of circulating γδT cells [20, 29]. This contrasts with the very small number of these cells in humans [26] and mice [2]. In bovine, γδT cells constitute a prominent population of peripheral blood mononuclear cells (PBMC), reaching up to 20-30% in young calves. These cells express a unique family of high molecular weight surface molecules, termed Workshop Cluster 1 (WC1) [9, 31]. The cells are further char-acterised by the CD2–CD4–CD8–CD3+
TCR γδ+-phenotype [9, 22]. WC1 has been
identified on sheep, bovine and pig γδT cells by mAb reacting with common epi-topes [7, 13]. In addition, there is a small population of WC1–γδT cells, many of
which express CD2 and/or CD8 [35]. Several methods have been developed for enriching γδT cells. Positive purifica-tion of WC1+T cells from PBMC (stained
with mAb CC15 (anti-WC1) and succes-sively sorted on Mini Magnetic Cell Sorting (MiniMACS) and Fluorescence Activated Cell Sorter (FACS)) has been described [11]. The binding of anti-WC1 mAb to γδT cells has been reported either to induce reversible growth arrest in proliferating IL-2- depen-dent γδT lymphocytes [25] or to augment the proliferation of these cells in an autolo-gous mixed leukocyte reaction as well as augmenting proliferation induced by anti-CD3 or anti-CD5 mAbs [17]. Negative purification of WC1+ T cells has been
reported by other authors [17], using mono-cyte depleted-PBMC stained with a cock-tail of monoclonal antibodies on mouse T-cell immunocolumn and culture overnight with human recombinant interleukin-2 (IL-2). Addition of IL-2 to purified WC1+ T
cells resulted in a significant increase in pro-liferation [11]. The purification of WC1+T
cells in order to obtain resting cells for the in vitro study thus remains a challenge.
In this paper we describe a procedure for the purification of resting WC1+T cells.
Purity was assessed by the FACS method using mAbs that differentiate the (CD2–,
CD4–, CD8-, CD3+, and WC1+) γδT cells
from the (CD4+, CD8–) and (CD8+, CD4–)
αβT cells. We further studied the expres-sion of costimulatory molecules and of cytokines mRNA in uncultured, non-acti-vated purified WC1+T cells. WC1+γδT
lymphocytes purified under these conditions provide excellent starting material for the examination of their functional character-istics in vitro.
2. MATERIALS AND METHODS 2.1. Materials
Phosphate-buffered saline (PBS) with-out calcium and magnesium, culture medium containing RPMI 1640, 2 mM L-glutamine, 25 mM hepes buffer, 100 IU.mL–1penicillin, 100 µg.mL–1 strep-tomycin, 0.5 µg.mL–1fungizone and 10%
foetal calf serum (FCS) were supplied from efficace et reproductible, tandis que la pureté des cellules isolées analysées par cytométrie de flux, s’éle-vait à plus de 97%. Sur les cellules fraîchement isolées, nous avons étudié au moyen de la technique de “reverse transcriptase polymerase chain reaction” (RT-PCR) l’expression de l’ARN messager des cytokines et des molécules de costimulation. Nous avons ainsi mis en évidence que les cellules T γδWC1+fraîchement isolées, non cultivées, expriment les ARNm du TNF-α, du CD28, du CTLA-4 et de IL-2Rαtandis que les ARNm de l’IL-2, l’IL-4, l’IL-6, l’IL-10 et de l’IFN-γn’étaient pas expri-més. L’expression du CD28 et du CTLA-4 sur les cellules T γδWC1+indiquerait que ces gènes ont été conservés durant l’évolution.
Gibco BRL (Gibco BRL, Grand Island, NY, USA). Lymphoprep was purchased from Nycomed (Nycomed Pharma, Oslo, Nor-way), and 2-aminoethylisothiouronium bro-mide (AET) and concanavalin A (ConA) from Sigma (Sigma Immunochemicals, St Louis, MO, USA). Goat anti-mouse IgG-labelled paramagnetic beads (GAMIg-MACS beads), (GAMIg-MACS columns and (GAMIg-MACS separator were supplied from Miltenyi (Mil-tenyi Biotech Gmbh Bergisch Gladbach, Germany). Fluorescein isothiocyanate (FITC)-conjugated F (ab’) 2 fragment of rabbit anti-mouse immunoglobulin (FITC-F (ab’) 2 fragment) was purchased from Dako (Dako A/S, Glostup, Denmark). The
following murine mAbs reported within the International Ruminant Leukocyte Antigen Workshop [21] were used: CC42, MM1A, CC8, CC63, and CC15 specific for CD2, CD3, CD4, CD8, and WC1 respectively. Flow cytometry analysis was performed on FACScan (Becton Dickinson, Mountain View, California, USA).
2.2. Preparation of bovine WC1+T cells
WC1+T cells were negatively isolated
from peripheral blood as depicted in Fig-ure 1. Using lymphoprep, PBMC were
lated from heparinised peripheral venous blood from 6-12-month-old conventionally raised cattle. PBMC at 5×10⁶cells.mL–1
were resuspended in culture medium and allowed to adhere for 60 min to plasma-coated gelatin as described by Goddeeris et al. [15]. Non adherent cells were enriched in T cells by passing the cells through a nylon wool column to remove B cells and remaining monocytes as previously described [5]. CD2+T cells were depleted
by rosetting T cells with AET-treated sheep red blood cells (SRBC). Briefly, enriched T cells suspended at 2.5×10⁶cells.mL–1
were added to an equal volume of 2% SRBC in culture medium, incubated for 15 min at 37 °C and centrifuged for 10 min at 190 × g.
The supernatant medium was discarded and the cell pellet allowed to incubate for 1 h on ice. The cells resuspended in 15 mL of culture medium were layered onto lympho-prep and spun for 30 min at 635 × g.
Enriched CD2-T cells at the interface were
harvested and washed twice in PBS. WC1+ T cells were further separated from CD4+
and CD8+T cells using the MACS
tech-nique [30] whereby the non-rosetting pop-ulation, coated with anti-CD4 and anti-CD8 mAbs, was incubated with GAMIg-MACS beads at 4 °C for 15 min and passed through the MACS column. Labelled cells were retained on the column in a magnetic field and the negative fraction was collected.
2.3. Flow cytometry
Single color FACS staining was per-formed using mAbs to CD2, CD3, CD4, CD8 or WC1. Cells were washed twice with ice-cold PBS containing 1% BSA. For 30 min, 106cells per test were incubated on
ice with an appropriate dilution of mAb, washed with PBS and further incubated for another 30 min on ice with the FITC- F (ab´) 2 fragment. After washing, phenotypic anal-ysis was performed on a FACScan flow cytometer.
2.4. Reverse transcriptase polymerase chain reaction (RT-PCR)
Total RNA was prepared from purified uncultured WC1+T cells (107) and from PBMC activated with ConA [23] by lysis in the ultraspecTMRNA-reagent (AMS Biotech-nology Ltd, Witney, Oxon, UK). RNA con-centrations were determined by spectropho-tometer readings. The products used for the cDNA synthesis were from Gibco BRL except where otherwise stated. The cDNA was synthesised for 1 h at 37 °C in a 40 µL cocktail containing 1 µg total RNA in diethyl pyrocarbonate (DEPC)-dH2O, 2 µL oligo-dT primer, at 500 µg.mL–1, 4 µL of a 10 mM
dNTP mix, 1 µ L RNasin at 40 U.mL–1 (Promega, Madison, WI, USA), 1 µ L Moloney murine leukaemia virus reverse transcriptase (MMLV-RT) at 200 U.mL–1,
8 µL of 5×concentrated RT buffer (250 mM Tris-HCl pH 8.3, 375 mM KCl, 15 mM MgCl2), and 4 µL of 1 mM DTT. This was further incubated at 65 °C for 5 min. cDNA (3 µL per primer pair) was added to 5 µL of 10×concentrated PCR buffer (300 mM Tris-HCl pH 9.0, 50 mM MgCl2, 300 mM KCl, 0.5% (W/W) W-1 buffer), 1.25 µL of each 10 mM dNTP, 2.5 µ L of each 10 µ M sense/antisense primers (Tab. I), 0.5 µL Taq polymerase at 5000 U.mL–1, and dH2O to a final volume of 50 µL. The PCR reactions were performed in a PCR thermocycler under the following conditions: for β-actin, IL-2 and IL-4: one cycle (1 min at 94 °C), fol-lowed by 35 cycles (94 °C, 1 min; 50 °C, 1 min; 72 °C, 2 min), and for IL-6, IL-10, IFN-γ, TNF-α, IL-2Rα, CD28, and CTLA-4: one cycle (1 min at 94 °C), followed by 35 cycles (94 °C, 30 sec; 60 °C, 45 sec; 72 °C, 1 min), and for the final extension cycle: 10 min at 72 °C. Reaction products (10 µL) were visualised after electrophoresis on 2% agarose containing ethidium bromide. 2.5. Determination of primer specificity
Primers were designed based upon bovine specific GenBank sequence
infor-mation M20818, X93304 and X93305 for Bovine IL-2Rα, CD28 and CTLA-4 respec-tively. Primer specificity was demonstrated through sequencing of PCR products, where all amplified sequences were found to be identical to the published sequences.
3. RESULTS
3.1. Purification of WC1+ T cells from bovine blood
From six independent experiments the range in cell number and in percentage of
CD2+, CD3+, CD4+, CD8+and WC1+T
cells recovered after each step are presented in Table II. Upon PBMC separation on Lymphoprep, 0.8×10⁹– 1.0×10⁹cells were obtained from 300 mL of blood. The adherence step on plasma-coated gelatin removed 80% to 90% of monocytes as anal-ysed by flow cytometry (not shown).The non-adherent cells containing 80-85% CD3+ T cells were allowed to run into the nylon wool column in order to deplete the non T-lymphocytes and the remaining monocytes. This selection step yielded a population of more than 97% CD3+T lymphocytes con-taining an average of 44% (range: 40-49)
Table I. Bovine cytokine and antigen primers.
Gene Fragment (bp) Primer 5’→3’ Reference
IL-2R 358 AGCACTTTCTCTTCCCAGCa This publication CCCGAAGAACATAGGGAGAAA
CD28 571 TCCTGGCTCTCAACTTCTTCC This publication
GCGACTATATGAACATGACCCC
CTLA-4 435 GACTTGGTGGACATCTAGG This publication CGTCATTGATCCAGAACCATGC IL-2 548 ACGGGGAACACAATGAAAGAAGT [8] CGTAGGGCTTACAAAAAGAATCT IL-4 423 GTCTTTCAGCGTACTTGT [3] TGCATTGTTAGCGTCTCCT IL-6 534 CCTTCACTCCATTCGCTGTC [14] TGCGTTCTTTACCCACTCG IL-10 518 ACAGCTCAGCACTGCTCTGTT [11] CG TTGTCATGTAGGATTCTATG IFN-γ 426 CTGTGGGCTTTTGGGTTTTTCTG [8] CTCTTCCGCTTTCTGAGGTTAGA TNF-α 549 CTGCACTTCGGGGTAATCGG [10] CAGGGCGATGATCCCAAAGTA β-Actin 400 ACGTAGCAGAGCTTCTCCTTGATG [3] CCTTTTACAACGTGCGTGTG
aSequences are listed as sense followed by antisense.
of CD2+, 26% (range: 25-28) of CD4+, 19%
(range: 16-20) of CD8+and 54% (range: 51-58) of WC1+T cells. The next step of
rosetting T lymphocytes with SRBC, under-taken in order to remove CD2+T cells,
yielded a CD2-T cell population enriched to about 80% (range: 79-82) of WC1+T cells
with almost 19% (range: 17-22) of CD2+T cells in excess. Enriched CD2-T cells were
incubated with a mixture of anti-CD4 and anti-CD8 mAbs, and applied to the MACS column in order to remove the CD4+and CD8+T cells. The final fraction of cells
passing through the MACS column repre-sented consistently >97% WC1+T cells and
less than 1% of the other T cells. The cell viability assessed by the trypan blue exclu-sion test was always greater than 98%.
3.2. Phenotypic analysis
To evaluate the efficiency of the proce-dure, purified cells and PBMC were stained
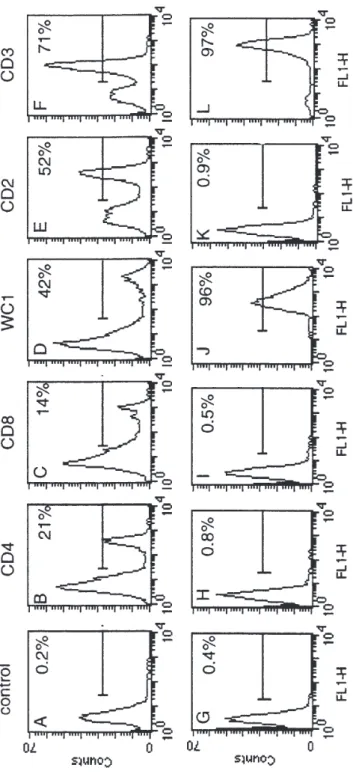
with mAbs specific for bovine CD2, CD3, CD4, CD8, and WC1 leukocyte molecules and the percentage of the populations eval-uated by FACS analysis. As depicted in Fig-ure 2, up to 97% of the purified cells expressed WC1 and CD3 antigens and less than 1% CD4, CD8 or CD2 T antigens. In PBMC, WC1+, CD4+ and CD8+T cells rep-resented 42%, 21% and 14% respectively.
3.3. Expression of costimulatory molecules on freshly isolated WC1+T cells
The expression of the primary T-cell cos-timulatory receptors CD28, CTLA-4 and IL-2Rα(CD25) was assessed by RT-PCR. In WC1+T cells RT-PCR was conducted
on RNA extracted from freshly isolated uncultured cells using primers listed in Table 1 as shown in Figure 3A. Gel elec-trophoresis of RT-PCR band products are the size of 571 bp, 435 bp and 358 bp
cor-Table II. Analysis of range cell number and range percentage of specific T cells in six independent
experiments.
na Range and mean % T cellsb
CD2+ CD4+ CD8+ CD3+ WC1+ PBMC 0.8 – 1.0 × 10⁹ NDc 17-22 11-14 65-72 32-48 [18.5] [13] [68.5] [39.8] Non-adherent cells 8.4 – 9.0 × 10⁸ ND 20-24 15-18 80-85 46-52 [22.5] [16.5] [82.3] [48.3] CD3+T cells 1.9 – 2.8 × 10⁸ 40-49 25-28 16-20 >97d 51-58 [44.5] [26] [19] [54] Enriched CD2-T cells 7.6 – 9.0 × 10⁷ 17-22 11-14 5-8 >97 79-82 [19.5] [12] [6.5] [80.5] Selected WC1+T cells 4.2 – 7.5 × 10⁷ <1d <1 <1 >97 >97 an represents the range cell number of six independent experiments.
bThe columns give the range percentage of T cells and the mean [percent] as evaluated by flow cytometry. cND: not done.
Figure 2.
FACS analysis of PBMC and purified WC1
+γδ
T cells. PBMC (A-F) and purified WC1
+T cells (G-L) were analysed by indirect
immunoflu-orescence for the five major surface determinants of T cells including CD4 (B and H), CD8 (C and I), WC1 (D and J), CD2 (E and
K) and CD3 (F and L)
using the mAbs CC8 (anti-CD4), CC63 (anti-CD8), CC15 (anti-WC1), CC42 (anti-CD2) and MMA1 (anti-CD3) and FITC-F (ab’) 2 fragmen
t as second
responding to CD28, CTLA-4 and IL-2Rα respectively. DNA sequencing of these bands confirmed that all amplified mRNA transcripts were identical to the published sequences.
3.4. Cytokine expression by freshly purified resting WC1+T cells Using RT-PCR, we examined mRNA expression from a range of cytokines in freshly purified uncultured WC1+T cells.
While TNF-αmRNA seemed to be consti-tutively expressed, other cytokines including IL-2, IL-4, IL-6, IL-10 and IFN-γwere undetectable in resting uncultured WC1+T
cells but were detected in PBMC activated with ConA (Fig. 3B).
4. DISCUSSION
For the comprehensive study of the physio-pathologic role of the γδT cells, it seems essential to characterise the non-acti-vated cells in order to establish a basic com-parison to the functional activation. The hereto used methods of purification, being positive purification [11] or negative purifi-cation of γδT cells cultured in IL-2 [17] have both generated activation of these cells. Using a combination of cell separation meth-ods, we tentatively developed a negative procedure for purifying bovine resting WC1+γδT cells from peripheral blood. We first removed the majority of the monocytes from PBMC by the method of adherence to plasma-coated gelatin as described by God-deeris et al. [15]. Second, the non-T lym-phocytes and the remaining monocytes in the non-adherent cells were depleted on a nylon wool column. These two preliminary manipulations permitted to enrich the CD3+ T lymphocytes from 70% in PBMC to more than 97% from which 50% were CD2+T cells. Knowing that WC1+T cells do not
express CD2 antigens [9, 22], the next step was aimed at removing the CD2+T cell
pop-ulation. The rosetting technique with SRBC allowed a reduction of 50% of them, mean-while increasing the percentage of WC1+ cells from 55% to 80% without decreasing the CD3+ T cells. Furthermore, the per-centage of the CD4+ and CD8+T cells
decreased from 25-28% and 16-20% in the
Figure 3. Detection of costimulatory molecules
and cytokine mRNA expression on freshly iso-lated resting WC1+T cells. (A) β-actin (lane 2), IL-2Rα(lane 3), CD28 (lane 4) and CTLA-4 (lane 5) mRNA expression on uncultured WC1 -T cells. Cytokine mRNA expression for β-actin (lane 2), IL-2 (lane 3), IL-4 (lane 4), IL-6 (lane 5), IL-10 (lane 6), IFN-γ(lane 7) and TNF-α(lane 8) assayed following early PBMC ConA activation (B) for positive control and uncultured WC1-T cells (C). For reference, a 100 pb DNA ladder marker is shown on lane 1.
CD3+pool to 11-14% and 5-8% respec-tively (Tab. II). Ultimately, removing CD4+
and CD8+T cells by the magnetic cell sort-ing technique yielded highly purified T cells presenting with the phenotype CD2-CD4 -CD8-CD3+WC1+defining the majority of
bovine γδT cells in peripheral blood [9, 22]. Our method dealing with easy and improved techniques was reproducible in at least six standard experiments and has proved so far quite efficient in obtaining pure WC1+γδ T cells.
However, the most important considera-tion lies in the activaconsidera-tion state of the cells. Activated γδT cells express cytokine mRNA and produce cytokines as reported by many authors [4, 11, 12, 34]. The analysis of the purified bovine WC1+T cells shows
consti-tutive expression of TNF-αmRNA. The pro-duction of TNF-αtranscripts by γδT cells has been reported in several species includ-ing humans and mice [1, 16]. The biosyn-thesis of this cytokine is largely controlled at the translational level, therefore TNF-α mRNA may be present without synthesis of the corresponding protein [33]. The other cytokines examined, including IL-2, IL-4, IL-6, IL-10 and IFN-γ, were undetectable (Fig. 3C). The detection of these transcripts in Con A stimulated PBMC demonstrated that the primers were effective and that the purification procedure did not activate the resting cells.
We further addressed the question of cos-timulatory molecules expressed on the puri-fied cells. Indeed, full activation of T cells in response to foreign antigens depends on the engagement of the T-cell receptor (TCR) by the peptide-major histocompatibility complex (MHC) followed by costimulatory signals which are generated by other recep-tor-ligand interactions between the APCs and the T cells [19, 32]. CD28 and CTLA-4 are the primary T-cell costimulatory recep-tors. Upon interaction with their ligands, CD80 and CD86, T-cell proliferation and IL-2 synthesis are enhanced [24, 27]. CD28 is constitutively expressed on all murine T
cells as well as on 80% of human T cells [24] and once activated, the cells express the CTLA-4 molecule [28]. The expression of transcripts of these molecules has been recently reported for ovine γδT cells iso-lated from efferent lymph cells [18]. In this study, we report on the results of the expres-sion of costimulatory molecules on the iso-lated γδT cells. The WC1+T cells showed the expression of CD28 and CTLA-4 mRNA , suggesting that these genes are evo-lutionarily conserved on γδT cells alto-gether. Studies are in progress to determine whether the proliferation of WC1+T cells
requires the ligands of CD28/CTLA-4 on the surface of APCs.
IL-2RαmRNA expression was also demonstrated. The production of IL-2Rα transcripts on uncultured WC1+T cells from
sheep has been reported [18, 36]. This find-ing is in strikfind-ing contrast to the situation in
αβT cells where the α-chain of IL-2Rαis not expressed on most freshly isolated cells and is only transiently expressed following antigenic or mitogenic stimulation [6, 18]. The biosynthesis of IL-2Rα seems to be largely controlled at the transcriptional and translational levels [36]. Thus, detection of IL-2RαmRNA does not necessarily repre-sent the synthesis of the corresponding pro-tein. The analysis of PBMC from gnobiotic calves by Collins et al. [11] also indicated that the CD25 molecule was constitutively expressed on resting WC1+T cells and was further up-regulated following stimulation of the cells.
In conclusion, the described WC1+T cell purification protocol is a reliable and easy method for the negative selection of resting cells with high purity. This method circum-vents the possible inopportune activation occurring through mAbs by positive purifi-cation and through IL-2 culture supplement in negative purification methods as described in earlier reports. We recommend this protocol whenever enriched γδT cells are to be used for functional studies. The method may also be useful in other species with special reference to sheep and pigs,
where WC1+γδT cells possess the same phenotype as in bovine.
ACKNOWLEDGEMENTS
The authors wish to gratefully thank the foun-dation Jean et Rose Hoguet, Brussels and “Les amis de l’Institut Pasteur, Bruxelles”, for finan-cial support granted to one of us (F.Y.). Most of the antibodies were kindly supplied by Dr. C. Howard (Institute for Animal Health, Compton, UK). Our thanks to G. Treutens, F. Keuterickx and M. Gossel for excellent technical assistance, and R. Nyssen for reading the manuscript.
REFERENCES
[1] Barnes P.F., Abrams J.S., Lu S., Sieling P.A., Rea T.H., Modlin R.L., Patterns of cytokine pro-duction by mycobacterium-reactive human T-cell clones, Infect. Immun. 61 (1993) 197-203. [2] Bluestone J.A., Pardoll D., Sharrow S.O., Fowlkes
B.J., Characterisation of murine thymocytes with CD3-associated T-cell receptor structures, Nature 326 (1987) 82-84.
[3] Brown W.C., William C.D., Sang H.C., Dirk A.E.D., Gary A.S., Functional and phenotypic characterization of WC1+γδT cells isolated from
Babesia bovis-stimulated T cell lines, Cell. Immunol. 153 (1994) 9-27.
[4] Brown W.C., Woods V.M., Chitko-McKown C.G., Hash S.M., Rice-Ficht A.C., Interleukin-10 is expressed by bovine type 1 helper, type 2 helper, and unrestricted parasite-specific T-cell clones and inhibits proliferation of all three sub-sets in an accessory-cell-dependent manner, Infect. Immun. 62 (1994) 4697-4708. [5] Campos M., Rossi C.R., Inability to detect a NK
cell in bovine peripheral blood leukocytes, Vet. Immunol. Immunopathol. 8 (1985) 315-362. [6] Cantrell D.A., Smith K.A., Transient expression
of interleukin-2 receptors: Consequences for T-cell growth, J. Exp. Med. 158 (1983) 1895-1911. [7] Carr M.M., Howard C.J., Sopp P., Manser J.M., Parsons K.R., Expression on porcine γδ lympho-cytes of a phylogenetically conserved surface antigen previously restricted in expression to ruminant γδT lymphocytes, Immunology 81 (1994) 36-40
[8] Cerretti D.P., McKereghan K., Larsen A., Cosman D., Gillis S., Baker P.E., Cloning, sequence and expression of bovine interferon gamma, J. Immunol. 136 (1986) 4561-4564.
[9] Clevers H., MacHugh N.D., Bensaid A., Dunlap S., Baldwin C.L., Kaushal A., Iams K., Howard C.J., Morrison W.I., Identification of a bovine
surface antigen uniquely expressed on CD4-CD8-T cell receptor γδ T lymphocytes, Eur. J. Immunol. 20 (1990) 809-817.
[10] Cludts I., Cleuter Y., Kettmann R., Burny A., Droogmans, L., Cloning and characterization of the tandemly arranged bovine lymphotoxin and tumor necrosis factor-alpha genes, Cytokine 5 (1993) 336-341.
[11] Collins R.A., Sopp P., Gelder K.I., Morrison W.I., Howard C.J., Bovine γδTcR+ T lymphocytes are stimulated to proliferate by autologous Thei-leria annulata-Infected cells in the presence of Interleukin-2, Scand. J. Immunol. 44 (1996) 444-452.
[12] Cron R.Q., Gajewski T.F., Sharrow S.O., Fitch F.W., Matis L.A., Bleuestone J.A., Phenotypic and fuctional analysis of murine CD3+, CD4–,
CD8–, TcR -γδ-expressing peripheral T cells, J.
Immunol. 142 (1989) 3754-3762.
[13] Davis W.C., Hamilton M.J., Park Y., Larsen R.A., Wyatt C.R., Ruminant leukocyte differentiation molecules, in: Barta O. (Ed.), MHC, differentia-tion antigens and cytokines in animal and birds, Monographs in animal Immunology, BAR-LAB Inc., Blacksburg, 1990, p. 47.
[14] Droogmans L., Cludts I., Cleuter Y., Kettmann R., Burny A., Nucleotide sequence of bovine interleukin-6 cDNA, DNA Sequence 2 (1992) 411-413.
[15] Goddeeris B.M., Baldwin C.L., Ole-MoiYoi O., MorrisonW.I., Improved methods for purifica-tion and deplepurifica-tion of monocytes from bovine peripheral blood mononuclear cells – Functional evaluation of monocytes in responses to lectins, J. Immunol. Methods 89 (1986) 58-66.
[16] Haas W., Pereira P., Tonegawa S., γδcells, Ann. Rev. Immunol. 11 (1993) 637-685.
[17] Hanby-Flarida M.D., Trask O.J., Yang T.J., Baldwin C.L., Modulation of WC1, a lineage-specific cell surface molecule of γδT cells, aug-ments cellular proliferation, Immunology 88 (1996) 116-123.
[18] Hanrahan C.F., Kimpton W.G., Howard C.J., Parsons K.R., Brandon M.R., Andrews A.R., Nash A.D., Cellular requirements for the activa-tion and proliferaactiva-tion of ruminant γδT cells, J. Immunol. 159 (1997) 4287-4294.
[19] Harding F.A., McArthur J.G., Gross J.A., Raulet D.H., Allison J.P., CD28-mediated signalling co-stimulates murine T cells and prevents induction of anergy in T-cell clones, Nature 356 (1992) 607-609.
[20] Hein W.R., Mackay C.R., Prominence of γδT cells in the ruminant immune system, Immunol. Today 12 (1991) 30-34.
[21] Howard C.J., Naessens J., Summary of workshop findings for cattle, Vet. Immunol. Immunopathol. 39 (1993) 25-48.
[22] Howard C.J., Sopp P., Parsons K.R., Finch J., In vivo depletion of BoT4(CD4) and non-T4/T8
lymphocyte subsets in cattle with monoclonal antibodies, Eur. J. Immunol. 19 (1989) 757-763. [23] Jill C., Gary S., Detection of cytokine transcrip-tional profiles from bovine peripheral blood mononuclear cells and CD4+lymphocytes by
reverse transcriptase polymerase chain reaction, Vet. Immunol. Immunopathol. 49 (1995) 39-50. [24] June C.H., Bluestone J.A., Naedler L.M., Thompson C.B., The B7 and CD28 receptor fam-ilies, Immunol. Today 15 (1994) 321-331. [25] Kirkham P.A., Takamatsu H., Parkhouse R.M.E,
Growth arrest of γδT cells induced by mono-clonal antibody against WC1 correlates with acti-vation of multiple tyrosine phosphatases and dephosphorylation of MAP kinase erk2, Eur. J. Immunol. 27 (1997) 717-725.
[26] Lanier L.L., Weiss A., Presence of (WT31) neg-ative T lymphocytes in normal blood and thy-mus, Nature 324 (1986) 268-270.
[27] Lenschow D.J., Walunas T.L., Bluestone J.A., CB28/B7 system of T-cell costimulation, Annu. Rev. Immunol. 14 (1996) 233-258.
[28] Linsley P.S., Brady W., Urnes M., Gorsmaire L.S., Damale N.K., Ledbetter J.A., CTLA-4 is a second receptor for B cell activation antigen B7, J. Exp. Med. 174 (1991) 561-569.
[29] Mackay C.R., Maddox J.F., Brandon M.R., Three distinct subpopulation of sheep T lymphocytes, Eur. J. Immunol. 16 (1986) 19-25.
[30] Miltenyi S., Müller W., Weichel W., Radbruch A., High Gradient Magnetic Cell Separation with MACS, Cytometry 11 (1990) 231-238. [31] Morrison W.I., Davis W.C., Differentiation
anti-gens expressed predominatly on CD4-CD8-T lymphocytes (WC1, WC2), Vet. Immunol. Immunopathol. 27 (1991) 71-76.
[32] Mueller D.L., Jenkins M.K., Schwartz R.H., Clonal expansion versus functional clonal inacti-vation: a costimulatory signalling pathway deter-mines the outcome of T cell antigen receptor occu-pancy, Annu. Rev. Immunol. 7 (1989) 445-480. [33] Sairban E., Imamura K., Luebbers R., Kufe D., Transcriptional and posttranslational regulation of tumor necrosis factor gene expression in human monocytes, J. Clin. Invest. 81 (1988) 1506-1510. [34] Shevach E., in Gupta S., Waldmann T.A. (Eds.), Mechanisms of lymphocyte activation and immune regulation, IV: Cellular communication, Plenum Press. New York, 1992, pp. 49-55. [35] Sopp P., Howard C.J., Parsons, K.R.,
Investigat-ing monoclonal antibodies to bovine ‘null’ cell antigens using two-colour immunofluorescence, Vet. Immunol. Immunopathol. 27 (1991) 163-168.
[36] Verhagen A.M., Brandon M.R., Nash A.D., Char-acterization of the ovine interleukin-2 receptor-α chain: differential induction on precultured αβ and γδT cells, Immunology 79 (1993) 471-478.