IMF Country Report No. 16/220
EURO AREA POLICIES
SELECTED ISSUES
This Selected Issues paper on euro area policies was prepared by a staff team of the International Monetary Fund as background documentation for the periodic consultation with the member countries forming the euro area. It is based on the information
available at the time it was completed on June 22, 2016.
Copies of this report are available to the public from International Monetary Fund Publication Services
PO Box 92780 Washington, D.C. 20090 Telephone: (202) 623-7430 Fax: (202) 623-7201 E-mail: [email protected] Web: http://www.imf.org
Price: $18.00 per printed copy
International Monetary Fund
Washington, D.C.
EURO AREA POLICIES
SELECTED ISSUES
Approved By
The European Department
Prepared By S. Aiyar, A. Banerji, J. Bluedorn, C. Ebeke, K. Kang, H. Lin, A. Jobst, J. John, X. Shao, T. Wu (all EUR), and T. Poghosyan (FAD)
THE IMPACT OF WORKFORCE AGING ON EURO AREA PRODUCTIVITY ___________ 4
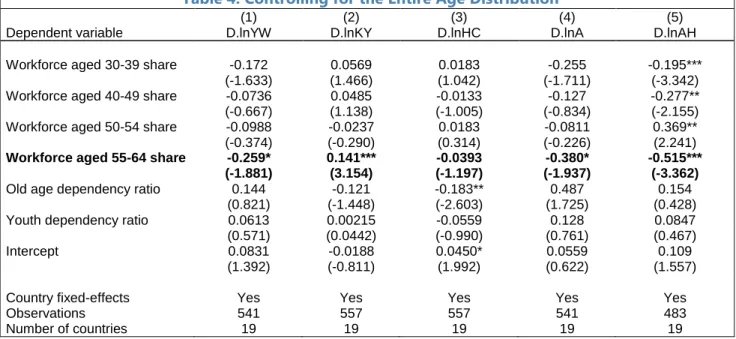
A. Aging Headwinds ____________________________________________________________________ 4 B. Estimating the Effect of Aging on Productivity in the Euro Area ______________________ 9 C. Living with Aging __________________________________________________________________ 13 D. Conclusion ________________________________________________________________________ 15
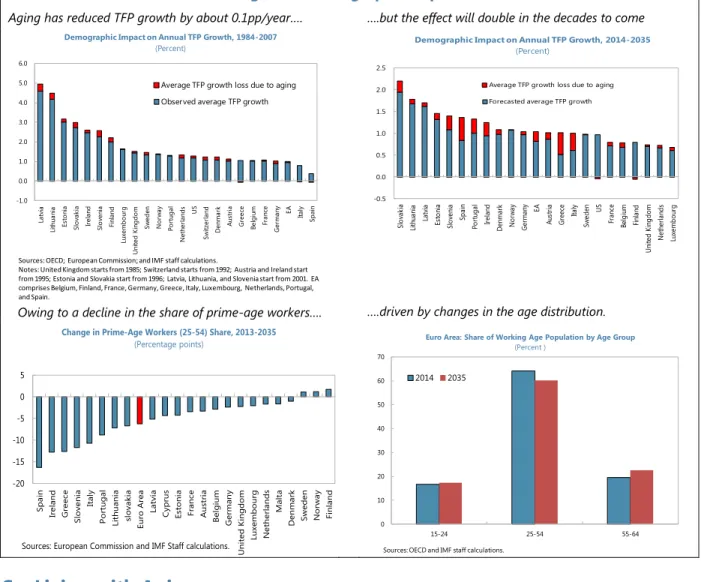
FIGURES
1. Demographic Developments _________________________________________________________ 4 2. Aging and the Macroeconomy _______________________________________________________ 7 3. Aging and Aggregate Productivity ___________________________________________________ 8 4. Demographic Impact ________________________________________________________________13
TABLES
1. OLS Estimates of the Effects of Aging on Output per Worker and TFP Growth _____16 2. Controlling for the Endogeneity Bias. Instrumental Variable Estimates _____________17 3. Purging the Effect of Hours Worked _______________________________________________ 18 4. Controlling for the Entire Age Distribution __________________________________________19 5. Effects of Policies ___________________________________________________________________ 20 References ____________________________________________________________________________ 21
APPENDIX
I. Aging and Productivity _____________________________________________________________ 23
CONTENTS
June 22, 2016INVESTMENT, FIRM SIZE, AND THE CORPORATE DEBT BURDEN: A FIRM-LEVEL ANALYSIS OF THE EURO AREA _____________________________________________________ 25
A. Introduction _______________________________________________________________________ 25 B. Data Description and Summary Statistics __________________________________________ 29 C. Research Design and Econometric Model __________________________________________ 32 D. Empirical Results ___________________________________________________________________ 34 E. Conclusion _________________________________________________________________________ 37
FIGURES
1. Corporate Investment and Debt ____________________________________________________ 26 2. Firm Size and Performance in the Euro Area _______________________________________ 32 3. Predicted Effect of Leverage _______________________________________________________ 34 4. Predicted Effect of Real Sales Growth ______________________________________________ 35 5. Marginal Effect of Real Sales Growth _______________________________________________ 35 6. Country-Specific Estimates _________________________________________________________ 37
TABLES
1. Descriptive statistics _________________________________________________________________31 2. Sample slice by country and sector ________________________________________________ 31 References ____________________________________________________________________________ 38
APPENDIX
I. Additional Results Tables ___________________________________________________________ 39
OPTIONS FOR A CENTRAL FISCAL CAPACITY IN THE EURO AREA ________________ 43
A. Background and Motivation _______________________________________________________ 43 B. General Characteristics of a Central Fiscal Capacity ________________________________ 45 C. Three Options for a Central Fiscal Capacity at the Euro Area Level _________________ 46 D. Next Steps _________________________________________________________________________ 50
FIGURE
1. Design Features of a Central Fiscal Capacity _______________________________________ 45 References ____________________________________________________________________________ 51
NEGATIVE INTEREST RATE POLICY (NIRP): IMPLICATIONS FOR MONETARY TRANSMISSION AND BANK PROFITABILITY IN THE EURO AREA ________________ 53
A. Background ________________________________________________________________________ 53 B. Advantages and Disadvantages of NIRP ___________________________________________ 54 C. The Impact of Negative Interest Rates _____________________________________________ 56 D. Assessment for the Euro Area ______________________________________________________ 61 E. Conclusion _________________________________________________________________________ 62
FIGURES
1. The Impact of NIRP on Bank Profitability and Implications for Credit Growth ______ 59 2. Bank Equity Valuation and Credit Growth __________________________________________ 60 References ____________________________________________________________________________ 64
APPENDICES
I. Implementation and Impact of Negative Interest Rates _____________________________ 67 II. Overview of Other Countries with NIRP _____________________________________________75 III. Monetary Conditions in Countries with NIRP ______________________________________ 77
COMPREHENSIVE, MORE BALANCED POLICIES TO STRENGTHEN THE EURO AREA _________________________________________________________________________________ 80
A. Context and Motivation ____________________________________________________________ 80 B. Simulation of More Balanced, Comprehensive Policies _____________________________ 81 C. Stagnation and a Policy Response Scenario ________________________________________ 88 D. Conclusions ________________________________________________________________________ 93
FIGURES
1. Policy Synergies in a Low-inflation/Low-interest Rate Environment ________________ 87 2. Negative Feedback Loop in a Downturn ___________________________________________ 90
TABLE
Euro Area Scenarios __________________________________________________________________ 92 References ____________________________________________________________________________ 94
THE IMPACT OF WORKFORCE AGING ON EURO AREA
PRODUCTIVITY
1The euro area population has aged considerably over the past few decades, a process expected to accelerate in the years ahead. At the same time, labor productivity growth in the euro area has been sluggish, posing risks to long-term growth prospects. This paper studies the effect of the aging of the workforce on labor productivity, identifies the main transmission channels, and examines what policies might mitigate the effects of aging. We find that workforce aging reduces growth in labor productivity, mainly through its negative effect on TFP growth. Projected workforce aging will reduce TFP growth by an average of 0.2 percentage points every year over the next two decades. A variety of policies can ameliorate this effect.
A. Aging Headwinds
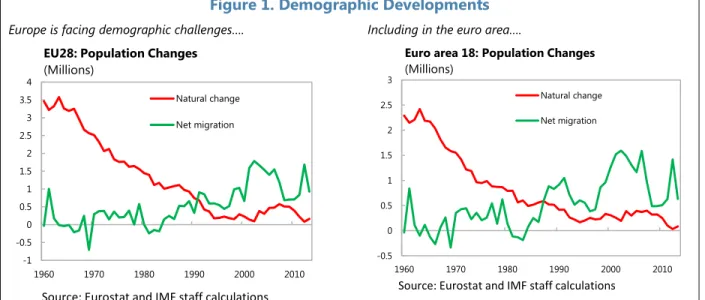
1. Aging is intensifying in the euro area. Declining fertility rates combined with increased life
expectancy have reduced the natural increase in population. Immigration has helped to offset this trend but only partially. The old age dependency ratio is high in a number of euro area countries.
Figure 1. Demographic Developments
Europe is facing demographic challenges…. Including in the euro area….
1 Prepared by Shekhar Aiyar, Christian Ebeke, and Xiaobo Shao (all EUR). We thank staff from the European
Commission for their helpful comments and feedback.
-1 -0.5 0 0.5 1 1.5 2 2.5 3 3.5 4 1960 1970 1980 1990 2000 2010 Natural change Net migration EU28: Population Changes (Millions)
Source: Eurostat and IMF staff calculations
-0.5 0 0.5 1 1.5 2 2.5 3 1960 1970 1980 1990 2000 2010 Natural change Net migration Euro area 18: Population Changes (Millions)
2. Demographic projections point to a rapid aging of the European workforce. Not only
will there be a sharp increase in the share of the elderly in the total population (and the old-age dependency ratio as well), but also a shift in the composition of the workforce from relatively young to relatively old workers, a phenomenon that we will refer to as “workforce aging”. In particular, the share of seniors (workers aged 55+) in the labor force is expected to increase sharply over the next few decades, especially in countries such as Spain, Italy, Portugal, Greece and Ireland.
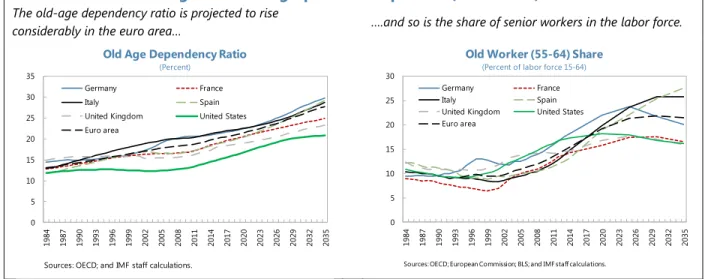
3. Aging exerts a macroeconomic impact in two conceptually different ways: through a higher dependency ratio (i.e. a higher proportion of retirees to workers), and through workforce aging.2 The first of these, the impact of a higher dependency ratio, has been well
studied. Mechanically, fewer workers in a fixed population produce less output, so per capita GDP should fall with a higher dependency ratio.3 The life cycle theory suggests that aggregate savings
rates could decline as the elderly dissave after retirement. Public finances could be put under pressure in graying economies as the level of age-related spending increases. In the euro area, large increases in age-related spending are expected in countries that currently have high public debt-to-GDP ratios.4 The erosion of fiscal buffers—coupled with more volatile participation rates for
seniors—can lead to greater aggregate volatility (Jaimovich and Siu, 2009). Recent papers have also examined the role of aging on the structural transformation of economies, noting that the
consumption pattern shifts towards goods that are more relevant for the elderly, such as energy, house-keeping, health and leisure services. The supply-side composition of the economy shifts in tandem, with the service sector growing relative to manufacturing (Siliverstovs et al., 2011).
2 See Appendix A for an extensive empirical literature review of the macroeconomic consequences of aging.
3 Several studies document a negative impact of a higher dependency ratio on per capita GDP growth in different
parts of the world, e.g. Persson (2002) for the US; Bloom, Canning and Malaney (2000) for East Asia; Aiyar and Mody (2013) for India.
4 The adverse impact of aging on public finances in Advanced Economies has been re-examined recently in Clements
and others (2015).
Figure 1. Demographic Developments (Concluded)
The old-age dependency ratio is projected to rise
considerably in the euro area… ….and so is the share of senior workers in the labor force.
0 5 10 15 20 25 30 35 1984 1987 1990 1993 1996 1999 2002 2005 2008 2011 2014 2017 2020 2023 2026 2029 2032 2035 Old Age Dependency Ratio
(Percent)
Germany France Italy Spain United Kingdom United States Euro area
Sources: OECD; and IMF staff calculations.
0 5 10 15 20 25 30 1984 1987 1990 1993 1996 1999 2002 2005 2008 2011 2014 2017 2020 2023 2026 2029 2032 2035 Old Worker (55-64) Share
(Percent of labor force 15-64)
Germany France Italy Spain United Kingdom United States Euro area
4. But workforce aging has direct implications for labor productivity. Mechanically, if
different age cohorts differ in their productivity, then changes in the age distribution of the
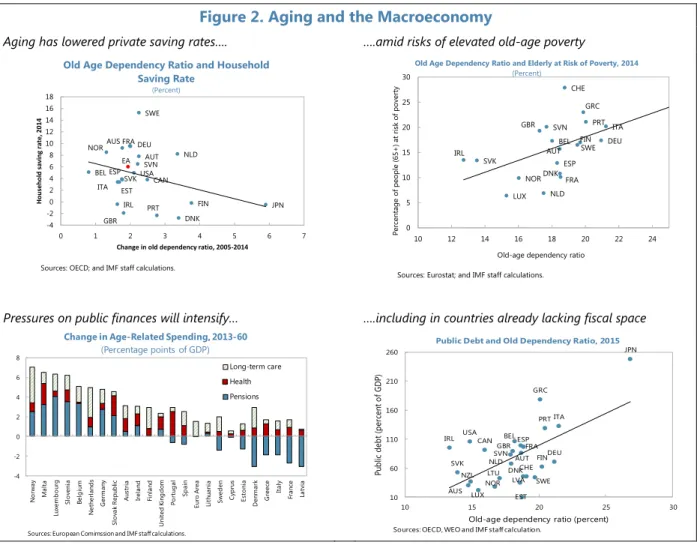
workforce will affect average output per worker. The literature stresses that a worker’s productivity systematically varies over his or her working life, for reasons such as the accumulation of experience over time, depreciation of knowledge, and age-related trends in physical and mental capabilities. A more mature labor force will have higher average levels of work experience, with potentially positive effects on productivity (Disney, 1996). On the other hand, workforce skills also depend on the stock of knowledge acquired before entering the labor market, or in the early stages of individuals’ careers. This stock of skills is likely to become increasingly dated as the average age of participants in the workforce rises, with negative effects on innovation and productivity (Dixon, 2003). Moreover, if job requirements change over time, older workers may find it more difficult to adapt (OECD, 1998). For example some have argued that the increased penetration of information technologies might place older workers at a disadvantage (Dixon, 2003). Recently, Venn (2008) has provided an interesting taxonomy of economic sectors depending on their exposure to workforce aging risks: occupations and professions in which productivity increases (on average) with age, occupations that are age neutral, and occupations in which productivity declines with age.5
5. The combination of these factors typically leads to profiles exhibiting a strong increase in productivity until workers are in their 40s and a decline toward the end of their working life. Several scholars emphasize that the drop-off in the productivity of senior workers is
related to lower levels of innovation, technology adoption and dissemination. For example Feyrer (2008) shows that in the US innovators' median age is stable around 48 over the 1975–95 sample period whereas the median age of managers who adopt new ideas is lower at around 40. Aksoy et al (2015) show that demographic structure affects innovation, with older workers (in particular the 50-59 age group) having a strong negative impact on total number of patent applications. Jones (2010) finds that innovation is positively affected by young and middle-aged cohorts and negatively affected by older cohorts. Some recent papers, based on sector or firm-specific data have however found a mixed picture. Göbel and Zwick (2012) find no significant differences in the age-productivity profiles between manufacturing and service sectors in Germany. Börsch-Supan and Weiss (2016) find that the productivity of workers in a large car manufacturer in Germany declines around age 60. These results might suggest that aggregate effects could be larger than sector or firm-level effects when externalities linked to workforce aging are taken into account (Feyrer, 2007).
5 For example, Veen (2008) argues that those with basic jobs, especially blue-collar jobs such as tilers or bricklayers
are likely to become less productive as they age. Age-neutral occupations might include bank or commercial clerks and electronic engineers. Occupations in which productivity increases with age might include lawyers, professors, managers and medical doctors. If the impact of workforce aging differs between sectors, its aggregate impact would depend on the industrial structure of the economy.
6. An aging workforce could impact already sluggish aggregate productivity growth in the euro area. Labor productivity (output per worker) and TFP have on average grown more slowly
in the euro area compared to the U.S. Average labor productivity and TFP growth gaps between the U.S. and the euro area between 1984–2007 have been about 0.5 and 0.3 percentage points every year.6 Moreover, there is considerable heterogeneity within euro area countries.
6 Euro area aggregates are reconstructed using data of Belgium, Finland, France, Germany, Greece, Italy, Luxembourg,
Netherlands, Portugal and Spain.
Figure 2. Aging and the Macroeconomy
Aging has lowered private saving rates…. ….amid risks of elevated old-age poverty
Pressures on public finances will intensify… ….including in countries already lacking fiscal space
AUS AUT BEL DNK FIN FRA DEU IRL ITA JPN NLD NOR PRT SVK ESP SWE GBR USA EST SVN EA CAN -4 -2 0 2 4 6 8 10 12 14 16 18 0 1 2 3 4 5 6 7 H o u seh o ld savi n g rate , 2014
Change in old dependency ratio, 2005-2014
Old Age Dependency Ratio and Household Saving Rate
(Percent)
Sources: OECD; and IMF staff calculations.
AUT BEL DNK FIN FRA DEU GRC IRL ITA LUX NLD NOR PRT SVK SVN ESP SWE CHE GBR 0 5 10 15 20 25 30 10 12 14 16 18 20 22 24 Pe rce nta ge o f peop le (65 + ) at risk o f po verty
Old-age dependency ratio
Old Age Dependency Ratio and Elderly at Risk of Poverty, 2014
(Percent)
Sources: Eurostat; and IMF staff calculations.
-4 -2 0 2 4 6 8 N o rw ay M al ta Lu xe m b o ur g Sl o ve ni a Be lg iu m N et he rl an d s G er m an y Sl o va k R ep ub lic A us tr ia Ir el an d Fi nl an d U ni te d K in g d om Po rt ug al Sp ai n Eu ro A re a Li th ua ni a Sw ed en C yp ru s Es to ni a D en m ar k G re ec e It al y Fr an ce La tv ia
Change in Age-Related Spending, 2013-60
(Percentage points of GDP)
Long-term care Health Pensions
Sources: European Comimssion and IMF staff calculations.
JPN AUT BEL DNK EST FIN FRA DEU GRC IRL ITA LVA LTU LUX NLD NOR PRT SVK SVN ESP SWE CHE GBR CAN USA AUS NZL 10 60 110 160 210 260 10 15 20 25 30 Pu bl ic de bt (p er ce nt o f G D P)
Old-age dependency ratio (percent) Public Debt and Old Dependency Ratio, 2015
Figure 3. Aging and Aggregate Productivity
Aggregate labor productivity shows considerable
heterogeneity…. ….as does TFP growth.
Aging has been associated with lower innovation… ….amid the shrinking of the manufacturing sector.
7. In this paper we examine the link between workforce aging and labor productivity in Europe. Drawing on the recent cross-country empirical literature (Feyrer, 2007; Cuaresma et al.,
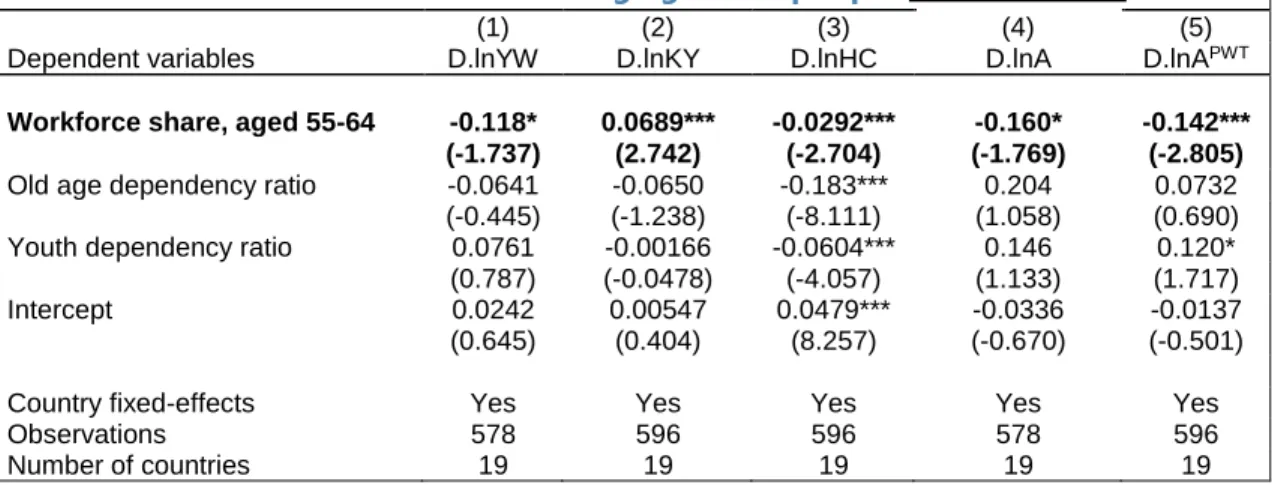
2016), we measure the effect of workforce aging (measured by the ratio of workers aged 55+ to the total workforce) on productivity. We find that an increase in this ratio of 1 percentage point is associated with a reduction in the growth rate of labor productivity of between 0.2 and 0.6 percentage points per annum. Further, we decompose the slowdown in labor productivity into factor accumulation and TFP growth, and find that most of the adverse effects of aging come from its negative impact on TFP growth. Our estimates show that the aging of the workforce in the euro area has lowered TFP growth by about 0.1 percentage points each year over the past two decades. The results are robust to various econometric specifications and different strategies to address potential endogeneity concerns.
8. Our estimates suggest that workforce aging could significantly retard TFP growth over the medium to long term. Given current demographic projections from the OECD, the aging of the
workforce in the euro area could lower TFP growth by about 0.2 percentage points each year between 2014 and 2035. This effect is very substantial given EC forecasts that most countries are expected to post average TFP growth rates less than 1 percent every year over that horizon. To put it
0 0.5 1 1.5 2 2.5 3 Fi nl an d Sw ed en Po rt ug al U ni te d Ki ng do m Ja pa n N or w ay Lu xe m bo ur g U ni te d St at es G re ec e Au st ria D en m ar k Be lg iu m Fr an ce G er m an y Au st ra lia Eu ro a re a N ew Z ea la nd Ita ly N et he rla nd s Ca na da Swi tze rla nd Sp ai n
Average Labor Productivity Growth, 1984-2007 (Percent)
Sources: OECD and IMF staff calculations.
0 0.5 1 1.5 2 2.5 Fi nl an d Lu xe m bou rg U ni te d Ki ng do m Sw ed en Nor w ay Po rt ug al Ne th er la nd s US Sw itz er la nd D en m ar k A us tr ia G re ece Be lg iu m Fr an ce G er m an y EA Ita ly Sp ai n Average TFP Growth 1984-2007 (Percent)
Sources: AMECO database and IMF staff calculations.
AUT BEL DNK EST FIN FRA IRL ITA LVA LTU LUX NLD NOR PRT SVK SVN ESP SWE GBR USA AUS NZL 0 50 100 150 200 250 300 350 -1 -0.5 0 0.5 1 1.5 2 2.5 3 3.5 4 Pa te nt a pp lic at io n, 2 01 3 (p er m ill io n in ha bi ta nt s)
Change in old worker share, 2010-14
Patent Application and Workforce Aging
Sources: Eurostat and IMF staff calculations. Patent data for US are 2010.
AUT BEL FIN FRA GRC IRL ITA LUX PRT NLD SVN ESP SWE y = -0.2644x + 3.752 R² = 0.4976 -2.5 -2 -1.5 -1 -0.5 0 0.5 1 1.5 2 10 12 14 16 18 20 22 C ha ng e in m an uf ac tu ri ng s ha re , 2 01 0-14
Old worker share, 2014
Share of Manufacturing Sector and Workforce Aging (Percent)
another way, absent the adverse impact of aging, TFP growth could be higher by about a quarter over the next two decades.
9. Appropriate policies can mitigate the adverse effects of aging. Our econometric analysis
underscores the key role played by specific policies to improve health outcomes, boost the
productivity of workers through ALMP reforms, reduce the tax wedge to increase labor mobility and spur innovation through R&D spending.
B. Estimating the Effect of Aging on Productivity in the Euro Area
Empirical design and econometric results
10. We use standard panel techniques to estimate the effect of aging and its channels. Our
baseline specifications build on work by Feyrer (2007) but expand his methodology to better account for heterogeneity across countries and endogeneity issues. The sample is restricted to euro area countries over 1950 to 2014.7 Our baseline model fits the real output per worker growth on the
share of workers aged 55+ years, the youth and the old dependency ratios, year and country fixed effects. More specifically, the model takes the following form:
Δ𝑙𝑜𝑔𝑌𝑊𝑖𝑡 = 𝜃1w55𝑖𝑡+ 𝜃2YADR𝑖𝑡+ 𝜃3OADR𝑖𝑡+ 𝑢𝑖+ 𝜂𝑡+ 𝜖𝑖𝑡 [1]
where YW denotes the real output per worker, w55 is the share of the total workforce aged between 55 and 64 years, 𝑌𝐴𝐷𝑅 and 𝑂𝐴𝐷𝑅 are the youth and old dependency ratios, respectively. We expect the coefficient 𝜃1 to be negative and significant, implying that an increase in the share of old
workers is negatively associated with the growth rate of output per worker, even after controlling for the dependency ratios. This means that the coefficient 𝜃1 represents the effect on output that results from a shift of workforce share out of the 15–54 group, into the 55–64 group. We control for
country fixed effects to absorb country specific time-invariant factors that can affect the growth rate of output per worker. We also control for year-specific effects to account for common shocks affecting growth in the euro area.8 This also implies that our identification of 𝜃
1 is through the age composition of the workforce that is not shared across countries over time. Our benchmark regression does not identify the relative contributions of the various channels through which an aging workforce affects output per worker growth, but identifies the sign and magnitude of the total effect, as highlighted in Jaimovich and Siu (2009). The workforce and population data come from the OECD while the output per worker data are from the Penn World Table 8.1.
11. We then examine the transmission channels of the effect of aging on real output per worker growth. In order to account for the transmission channels, we follow the methodology
proposed by Wong (2007) which consists in estimating separately the effect of the variable of
7 Feyrer’s (2007) analyses relate to up to 87 developed as well as to developing countries, and his data set spans the
period from 1960 to 1990. His major finding is an inversely U-shaped relationship between changes in the age structure of the labor force and the growth rate of TFP which peaks for workers aged 40–49.
8 The model can be amended further to include lagged dependent variable, the entire age distribution of the
interest—here the workforce aging variable—on factor accumulation (capital and human capital) and TFP growth rates. Wong (2007) shows that the coefficient on the workforce aging variable derived from each of these regressions will sum up to the effect of workforce aging on labor productivity growth estimated in equation (1). Assuming that the technology follows a Cobb-Douglas function, output per worker is given by:
𝑦𝑖𝑡 = 𝑘𝑖𝑡𝛼(ℎ𝑖𝑡𝐴𝑖𝑡)1−𝛼, which can be re-written as 𝑦𝑖𝑡= (𝐾𝑌) 𝑖𝑡
𝛼 1−𝛼𝐴
𝑖𝑡ℎ𝑖𝑡,
where y is the real output per worker, k is the real capital stock per worker, h is the human capital per worker, and A is the TFP.9 Taking logs of both sides gives:
𝑙𝑜𝑔(𝑦𝑖𝑡) = 𝛼 1 − 𝛼𝑙𝑜𝑔 (
𝐾
𝑌)𝑖𝑡+ 𝑙𝑜𝑔(ℎ𝑖𝑡) + 𝑙𝑜𝑔(𝐴𝑖𝑡)
12. We propose a framework to address the endogeneity of the aging variables. The
specification in equation (1) is potentially subject to endogeneity problems because the share in the labor force of any particular age group depends not only on the number of people in that age category, but also in the participation rate of that cohort. This may be influenced directly by the growth of output per worker; or both the participation rate and output per worker may be influenced by common (country-specific) shocks. To address potential endogeneity bias, we first instrument each country’s share of the workforce aged 55 to 64 by the population share of those aged 45–54 ten years previously. To address the possibility that dependency ratios can also be endogenous (for example if an immigration shock simultaneously shifts the population distribution and affects the growth rate of output), we instrument the youth and old dependency ratios with the share of population under the age of 4 and the population share of those aged 55 and 59 years ten years ago.
13. But even the lagged population proportions used as instruments may be endogenous if the shocks that affected the lagged population proportions ten years ago continue to influence current output per worker or TFP growth today. To address this critique we instrument
the workforce aging variable and the dependency ratio with lagged birth rates 40, 30, and 10 years ago, similar to Jaimovich and Siu (2009). Excluding migration and mortality, an age group’s share of the 15–64-year-old population is determined by the distribution of births 15 to 64 years prior. To the extent that fertility decisions taken at least fifteen years ago are exogenous to current
productivity growth, using lagged birth rates as instruments allows us to obtain unbiased estimates of the causal impact of the labor force composition of old workers. The drawback of this approach is
9 This decomposition assumes an augmented Cobb-Douglas production function with human capital, which has
become standard in the literature (see for example Hall and Jones (1999); and Aiyar and Feyrer (2002)). Alpha is the capital share, assumed to be around 0.3 (see Aiyar and Dalgaard, 2009 for a justification). The capital stock series, output, and human capital data are from Penn World Table. Human capital is defined in terms of average years of schooling, with the returns to primary, secondary and tertiary education taken from Psacharopoulos (1994).TFP is a computed as a residual from the log of real output per worker minus the capital intensity weighted by the factor share, and minus the log of human capital per worker.
a significant reduction in the number of observations, as we instrument the age composition of the workforce using very long lags.
14. The main channel through which an aging workforce reduces the growth rate of output per worker is lower TFP growth. Econometric results obtained from various specifications
and techniques show two key results. First, there is a negative and statistically significant effect of an increase in the share of the workers aged 55–64 on real growth of output per worker (Appendix, Table 1). The effect is larger and more precisely estimated after addressing endogeneity issues using instrumental variables (Table 2).10 An increase in the share of workers aged 55–64 by 5 percentage
points leads to a decline in the growth of output per worker of between 1.1 and 3.2 percentage points. 11 Second, in terms of transmission channels, it is robustly estimated that the bulk of the
negative effect of workforce aging on labor productivity comes from its negative impact on TFP growth. This result is broadly similar to Feyrer (2007) and Werding (2008), who also found a
dominant role for the TFP channel in a broad sample of advanced and developing economies in the pre-2000 period.
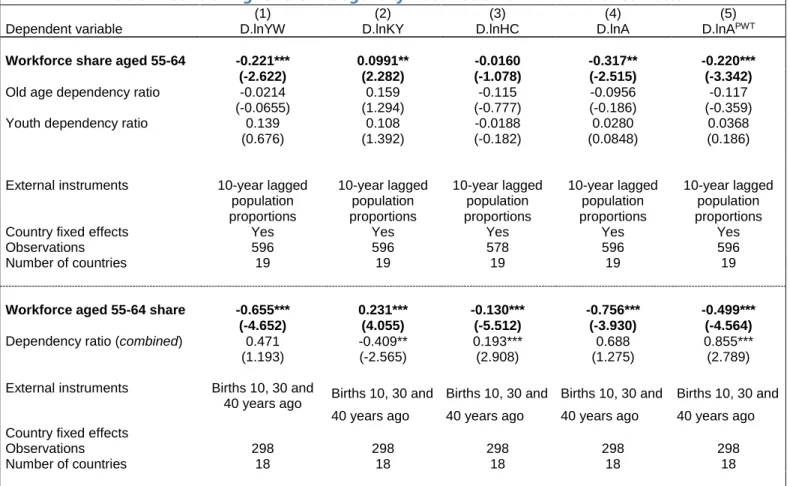
15. Controlling for the numbers of hours worked does not modify the results. One factor
that may be influencing the previous results is the relatively crude way in which labor productivity and TFP are constructed. In particular, labor input is measured in terms of the number of workers and does not account for differences in the number of hours worked, which could be affected both by cross-country heterogeneity and by aging. We therefore follow Feyrer (2007) in normalizing real output and TFP by hours worked, using OECD data. The regression results robustly point to a negative and statistically significant effect of the share of workers aged 55+ on both output per hour and modified TFP growth (defined as the difference between the log of TFP and the log of hours worked). These are denoted, respectively, as D.lnYH and D.lnAH (Table 3).
16. Controlling for the entire age distribution does not modify the results. We extend the
analysis to include a more detailed look at the effect of the workforce age composition. We alter our empirical specification so that the regressor, w55, is replaced by a vector of labor force shares: the shares of the 30–39, 40–49, 50–54, and 55–64, age groups. We exclude the 15–29 age group because all age shares together sum to one. This means that the coefficient on any particular age group represents the impact from a shift of the workforce share out of the 15–29 group, into that
10 Because the use of long lags of birth rates (40 years ago, for example) reduces the sample considerably and leads
in particular to dropping older observations, our second instrumentation strategy could lead to different point estimates in part due to the changing sample. In order to check that the effect of aging in this set up is not driven by the reduced sample, we also re-ran the previous instrumentation strategy which uses 10-year lagged population proportions as instruments on the reduced sample. The estimates are unaffected, supporting the view that the second instrumentation strategy gives stronger results because it deals with endogeneity better, not because the sample is different.
11 The first-stage regressions are consistent with our priors regarding the signs and the strength of the instruments.
Diagnostic statistics suggest that the instruments are strong (F-stat, Shea R2 that comfortably exceed conventional statistical thresholds).
age group. As shown in Table 4, the impact of the age group 55–64 remains negative and statistically significant.12
Quantifying the past and future effects of aging on TFP growth in the euro area
17. Our estimates suggest that workforce aging has not been a major drag on euro area TFP growth to date. Using the point estimates obtained in Table 2 column 4 (bottom regression),
and drawing on evolution of the share of workers aged 55–64 in the total workforce, we can decompose the contribution of the aging workforce to TFP growth in each euro area country from 1984 to 2014.13 Figure 4 shows that on average workforce aging has reduced TFP growth only
marginally. However, this is not uniformly the case. In some countries, such as Latvia, Lithuania, Finland, Netherlands and Germany, workforce
aging shaved off 0.2 percentage points of TFP growth every year during this period.
18. Future effects of aging on TFP growth will be more severe. Using the OECD forecast of
working age population by age groups and the EC’s 2015 Aging Report for projections of labor force participation rates, we construct projections of the share of the workforce aged between 55 and 64 years old in each country from 2014 until 2035. We then use our econometric estimates of the effect of aging to derive the projections of the
contribution of aging to TFP growth in the long-run. Our calculations point to a more severe effect of demographic pressures on TFP growth in the years to come, consistent with the rapid worsening of the age profile of the workforce expected in the euro area. On average aging will shave off about 0.2 percentage points of TFP growth every year until 2035. This effect is shared by several euro area countries and is substantial if one takes into account that the projected average annual TFP growth in the currency bloc is estimated at only about 0.8 percentage points per annum. In other words, in the absence of workforce aging, euro area TFP growth through 2035 could be about one quarter higher than the current forecast. The countries expected to be worst affected by workforce aging are Greece, Spain, Portugal, Italy, Slovenia, Slovakia and Ireland, where the average increase in the share of old workers in total workforce is about 10 percentage points between 2020 and 2035. Most of these countries are also currently facing a high debt burden.
12 Using instrumental variables as in Table 2 is challenging in these specifications because instrumenting for multiple
age cohorts entails the loss of too many degrees of freedom.
13 The results obtained using the lagged births as instrumental variables are our preferred specifications given the
stronger orthogonality of these instruments vis-à-vis the dependent variables. It is very unlikely that the birth rate 40 years ago could affect productivity performance today through any channel other than the aging variables.
GRC ITA ESP PRT IRL SVN EA AUT BEL SVK FRA LUX DNK EST NLD DEU LTU GBR LVA SWE NOR FIN -0.2 0.0 0.2 0.4 0.6 0.8 1.0 1.2 0 50 100 150 200 Loss rati o, 20 14 -3 5
Public debt, 2015 (percent of GDP)
Debt and Demographic-Induced TFP losses
Figure 4. Demographic Impact
Aging has reduced TFP growth by about 0.1pp/year…. ….but the effect will double in the decades to come
Owing to a decline in the share of prime-age workers…. ….driven by changes in the age distribution.
C. Living with Aging
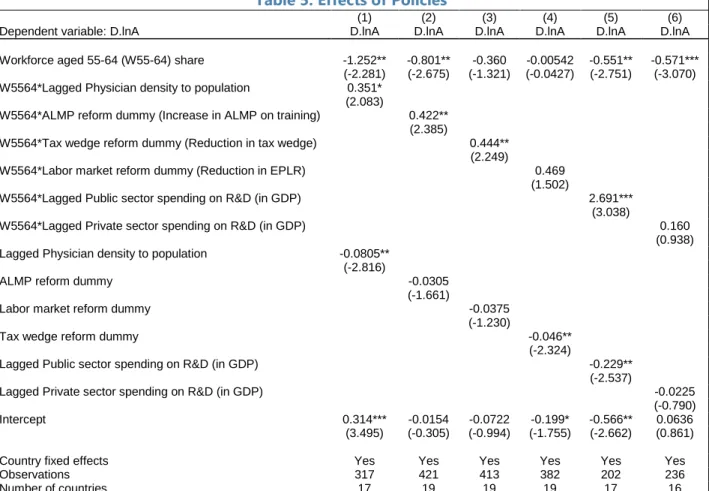
19. Policy reforms can mitigate the impact of aging on productivity growth. We are
interested in a set of specific policies that would improve productivity through the dampening of the adverse effects of workforce aging on productivity. More specifically, the objective is to isolate policies that would reduce the marginal negative effect of aging on TFP growth. These could potentially include several reforms aimed at increasing labor productivity generally—such as innovations in health or training to improve human capital, greater innovation and technology adoption, and the facilitation of productive labor reallocations—provided that the reforms disproportionately enhance the productivity of the 55 plus cohort of workers. Of course, it is important to note that estimating the effects of these reforms is challenging for several reasons, including the inability to factor in the effect of recent policy reforms implemented by countries. 20. The baseline model is therefore amended to test for the role of policies. The
specification is altered to allow for an interaction of workforce aging with a selected conditioning variable: Δ𝑙𝑜𝑔𝐴𝑖𝑡= (𝜃4+ 𝜃5𝑃𝑖𝑡−1) ∙ w55it+ β𝑃𝑖𝑡−1+ 𝜃6YADR𝑖𝑡+ 𝜃7OADR𝑖𝑡+ 𝑢𝑖+ 𝜂𝑡+ 𝜈𝑖𝑡 [2] -1.0 0.0 1.0 2.0 3.0 4.0 5.0 6.0 La tv ia Li th ua ni a Es to ni a Sl ov ak ia Ire la nd Sl ov en ia Fi nl an d Lu xe m bo ur g U ni te d Ki ng do m Sw ed en N or w ay Po rt ug al N et he rla nd s US Sw itz er la nd D en m ar k Au st ria G re ece Be lg iu m Fr an ce G er m an y EA Italy Sp ai n
Demographic Impact on Annual TFP Growth, 1984-2007 (Percent)
Average TFP growth loss due to aging Observed average TFP growth
Sources: OECD; European Commission; and IMF staff calculations.
Notes: United Kingdom starts from 1985; Switzerland starts from 1992; Austria and Ireland start from 1995; Estonia and Slovakia start from 1996; Latvia, Lithuania, and Slovenia start from 2001. EA comprises Belgium, Finland, France, Germany, Greece, Italy, Luxembourg, Netherlands, Portugal, and Spain. -0.5 0.0 0.5 1.0 1.5 2.0 2.5 Sl ov ak ia Lit hu an ia La tv ia Es to ni a Sl ov en ia Sp ai n Po rtu ga l Ire la nd De nm ar k N or wa y Ge rm an y EA Au st ria Gr ee ce Ita ly Sw ed en US Fr an ce Be lg iu m Fin la nd Un ite d Ki ng do m N et he rla nd s Lu xe m bo ur g
Demographic Impact on Annual TFP Growth, 2014-2035 (Percent)
Average TFP growth loss due to aging Forecasted average TFP growth
-20 -15 -10 -5 0 5 Spa in Ire la nd G re ec e Slo ve ni a Ita ly P o rt ug al Lit huan ia sl o va kia Euro A re a La tvia C yprus Es to nia Franc e A ust ria B el gium Ge rm any Uni te d K ingdo m Lu xe m bo urg Ne th er lan d s M al ta De nm ark Sw ede n No rwa y Finl and
Change in Prime-Age Workers (25-54) Share, 2013-2035
(Percentage points)
Sources: European Commission and IMF Staff calculations.
0 10 20 30 40 50 60 70 15-24 25-54 55-64 2014 2035
Euro Area: Share of Working Age Population by Age Group
(Percent )
where the variable P denotes the conditional factor shaping the relationship between TFP growth and the share of old workers (w55).14 The dampening effect will arise if 𝜃
4< 0 and 𝜃5> 0. This implies that the marginal (and negative) effect of aging on TFP growth is reduced for higher values of the conditional factor P. We test for various conditional factors:
Health conditions and human capital accumulation: Aging is associated with a rise in the
incidence of ill health and disability within the workforce (Dixon, 2003). The negative impact of an aging workforce on growth could be mitigated by better health conditions and
upgraded human capital. Our health care indicator is the availability of doctors measured by the physician density in total population. While doctor availability is an important and widely used “input” indicator for a society’s health levels at all age categories, it is likely to be of particular relevance for older people, who are disproportionately likely to be at health risk. We also test for the effect of active labor market policies (ALMPs) focusing on the training or re-training of the workforce (reform dummy taking the value when the change in public spending per unemployed on ALMP on training is greater than one standard deviation of the sample deviation).15 As with health, while ALMPs could in principle benefit all age
cohorts, they are likely to be disproportionately beneficial to senior workers with more dated skills.
Labor market flexibility: Workforce aging is expected to be associated with reduced
voluntary mobility between jobs, as younger workers tend to change jobs and employers relatively frequently, while older workers tend to have stable relationships with their employers. A decline in voluntary job mobility could have negative consequences as the labor market as a whole might become less flexible (Dixon, 2003). In turn, this is likely to reduce productivity, since adjusting to changes in technology and changes in product markets could require the movement of workers across firms and geographical regions. We use reforms to the employment protection framework to proxy for labor market flexibility, creating a dummy variable taking the value 1 when the OECD indicator of employment protection of regular contracts declines by at least 1 standard deviation of the sample.16
Tax wedge. High rates of tax on marginal employment, coupled with out-of-work benefits
can create disincentives to working for any age group. However, the effect may be disproportionately important for seniors because they have larger savings to fall back on than other age cohorts in case of unemployment, and may also have a greater preference for leisure based on their stage of life. The incentive to delay retirement could be eroded by high labor taxation. We define a dummy for the reform of the tax wedge taking the value of 1 when the OECD indicator of the tax wedge declines by at least 1 standard deviation.17
Innovation. Technological innovation an adoption is an important source of productivity
improvements for the labor force as a whole. To the extent that it differentially benefits
14 We control for the lagged value of the conditional variable P to reduce endogeneity concerns.
15 Data on ALMP spending are from Eurostat.
16 Defining structural reform occurrences by dummies variables indicating significant changes in underlying structural
indices follows the empirical literature on the macroeconomic effects of structural reforms (Bordon et al., 2016).
17 Examining the effect of reforms of the tax wedge is useful in its own right given the interest in this variable in the
senior workers, it could also mitigate the negative impact of aging. In principle, one could think of innovations that favor younger workers (e.g. new computer software that enhances the efficiency of those who are capable of easily “switching”) and innovations that favor older workers (e.g. mechanical devices that reduce the physical labor associated with certain manufacturing processes). In practice, whether technological innovations on balance favor older workers more than younger workers is an empirical matter. We test whether the effect of aging on TFP growth is dampened by higher spending on R&D, differentiating between public and private spending on R&D as a percentage of GDP.
21. Policy reforms that improve human capital, labor participation, and innovation mitigate the adverse impact of aging on TFP growth. The estimates in Table 5 show a robust
dampening effect of policy variables. Columns 1 and 2 do not reject the hypothesis that greater access to health services and ambitious active labor market policies focusing on the training of the labor force dampen the TFP growth-reducing effects of an aging workforce. While the results indicate that fiscal reforms lowering the tax wedge would be critical in dampening the effects of demographic pressures (column 3), the effect of labor market reforms granting more flexibility (less protection of regular workers) has the expected sign but is not statistically significant (column 4). Column 5 shows that government contribution to R&D spending is robustly associated with reduced effect of aging on TFP growth, whereas the effect of private sector R&D in the euro area remains statistically unclear (column 6). This can be due to the still very low levels of private sector R&D in several countries.
D. Conclusion
22. Workforce aging is likely to be a significant drag on European productivity growth over the next few decades. We estimate that a 1 percentage point increase in the 55–64 age
cohort of the labor force is associated with a reduction in total factor productivity of about 3 4 ⁄ of a percentage point. Extrapolating this result forward, projected aging will reduce TFP growth by an average of 0.2 percentage points every year over the next twenty years. The largest negative impact will occur in those countries—such as Spain, Italy, Portugal, Greece and Ireland—where rapid workforce aging is expected, and which also face high debt burdens.
23. Our analysis also suggests that good policies can ameliorate the negative productivity impact of an aging workforce. A variety of policies can help, such as broadening access to health
services, improving workforce training, increasing labor market flexibility by lowering the tax wedge, and promoting innovation via higher R&D to adapt to a changing global environment. Of course many of these policies are desirable in their own right, and may increase productivity growth through multiple channels, but our analysis shows that they are likely to have a disproportionately large impact in rapidly aging societies such as Europe.
Table 1. OLS Estimates of the Effects of Aging on Output per Worker and TFP Growth
(1) (2) (3) (4) (5)
Dependent variables D.lnYW D.lnKY D.lnHC D.lnA D.lnAPWT
Workforce share, aged 55-64 -0.118* 0.0689*** -0.0292*** -0.160* -0.142***
(-1.737) (2.742) (-2.704) (-1.769) (-2.805)
Old age dependency ratio -0.0641 -0.0650 -0.183*** 0.204 0.0732
(-0.445) (-1.238) (-8.111) (1.058) (0.690)
Youth dependency ratio 0.0761 -0.00166 -0.0604*** 0.146 0.120*
(0.787) (-0.0478) (-4.057) (1.133) (1.717)
Intercept 0.0242 0.00547 0.0479*** -0.0336 -0.0137
(0.645) (0.404) (8.257) (-0.670) (-0.501)
Country fixed-effects Yes Yes Yes Yes Yes
Observations 578 596 596 578 596
Number of countries 19 19 19 19 19
t-statistics in parentheses *** p<0.01, ** p<0.05, * p<0.1
Table 2. Controlling for the Endogeneity Bias. Instrumental Variable Estimates
(1) (2) (3) (4) (5)
Dependent variable D.lnYW D.lnKY D.lnHC D.lnA D.lnAPWT
Workforce share aged 55-64 -0.221*** 0.0991** -0.0160 -0.317** -0.220***
(-2.622) (2.282) (-1.078) (-2.515) (-3.342)
Old age dependency ratio -0.0214 0.159 -0.115 -0.0956 -0.117
(-0.0655) (1.294) (-0.777) (-0.186) (-0.359)
Youth dependency ratio 0.139 0.108 -0.0188 0.0280 0.0368
(0.676) (1.392) (-0.182) (0.0848) (0.186)
External instruments 10-year lagged
population proportions 10-year lagged population proportions 10-year lagged population proportions 10-year lagged population proportions 10-year lagged population proportions
Country fixed effects Yes Yes Yes Yes Yes
Observations 596 596 578 596 596
Number of countries 19 19 19 19 19
Workforce aged 55-64 share -0.655*** 0.231*** -0.130*** -0.756*** -0.499***
(-4.652) (4.055) (-5.512) (-3.930) (-4.564)
Dependency ratio (combined) 0.471 -0.409** 0.193*** 0.688 0.855***
(1.193) (-2.565) (2.908) (1.275) (2.789)
External instruments Births 10, 30 and
40 years ago Births 10, 30 and
40 years ago Births 10, 30 and 40 years ago Births 10, 30 and 40 years ago Births 10, 30 and 40 years ago Country fixed effects
Observations 298 298 298 298 298
Number of countries 18 18 18 18 18
t-statistics in parentheses *** p<0.01, ** p<0.05, * p<0.1
Table 3. Purging the Effect of Hours Worked
(1) (1)
Dependent variable D.lnYH D.lnAH
Workforce aged 55-64 -0.187** -0.223**
(-2.569) (-2.070)
Old age dependency ratio 0.398 -0.474
(0.772) (-0.717)
Youth dependency ratio 0.564* -0.0779
(1.695) (-0.175)
External instruments 10-year lagged
population proportions
10-year lagged population proportions
Country fixed effects Yes Yes
Observations 508 508
Number of countries 19 19
Workforce aged 55-64 -0.603*** -0.759***
(-4.574) (-4.184)
Dependency ratio (combined) -0.0226 0.361
(-0.0460) (0.534)
IV Births 10, 30 and
40 years ago
Births 10, 30 and 40 years ago Country fixed effects
Observations 287 287
Number of countries 18 18
t-statistics in parentheses *** p<0.01, ** p<0.05, * p<0.1
Table 4. Controlling for the Entire Age Distribution
(1) (2) (3) (4) (5)
Dependent variable D.lnYW D.lnKY D.lnHC D.lnA D.lnAH
Workforce aged 30-39 share -0.172 0.0569 0.0183 -0.255 -0.195***
(-1.633) (1.466) (1.042) (-1.711) (-3.342)
Workforce aged 40-49 share -0.0736 0.0485 -0.0133 -0.127 -0.277**
(-0.667) (1.138) (-1.005) (-0.834) (-2.155)
Workforce aged 50-54 share -0.0988 -0.0237 0.0183 -0.0811 0.369**
(-0.374) (-0.290) (0.314) (-0.226) (2.241)
Workforce aged 55-64 share -0.259* 0.141*** -0.0393 -0.380* -0.515***
(-1.881) (3.154) (-1.197) (-1.937) (-3.362)
Old age dependency ratio 0.144 -0.121 -0.183** 0.487 0.154
(0.821) (-1.448) (-2.603) (1.725) (0.428)
Youth dependency ratio 0.0613 0.00215 -0.0559 0.128 0.0847
(0.571) (0.0442) (-0.990) (0.761) (0.467)
Intercept 0.0831 -0.0188 0.0450* 0.0559 0.109
(1.392) (-0.811) (1.992) (0.622) (1.557)
Country fixed-effects Yes Yes Yes Yes Yes
Observations 541 557 557 541 483
Number of countries 19 19 19 19 19
t-statistics in parentheses *** p<0.01, ** p<0.05, * p<0.1
Table 5. Effects of Policies
(1) (2) (3) (4) (5) (6)
Dependent variable: D.lnA D.lnA D.lnA D.lnA D.lnA D.lnA D.lnA
Workforce aged 55-64 (W55-64) share -1.252** -0.801** -0.360 -0.00542 -0.551** -0.571***
(-2.281) (-2.675) (-1.321) (-0.0427) (-2.751) (-3.070)
W5564*Lagged Physician density to population 0.351*
(2.083)
W5564*ALMP reform dummy (Increase in ALMP on training) 0.422**
(2.385)
W5564*Tax wedge reform dummy (Reduction in tax wedge) 0.444**
(2.249)
W5564*Labor market reform dummy (Reduction in EPLR) 0.469
(1.502)
W5564*Lagged Public sector spending on R&D (in GDP) 2.691***
(3.038)
W5564*Lagged Private sector spending on R&D (in GDP) 0.160
(0.938)
Lagged Physician density to population -0.0805**
(-2.816)
ALMP reform dummy -0.0305
(-1.661)
Labor market reform dummy -0.0375
(-1.230)
Tax wedge reform dummy -0.046**
(-2.324)
Lagged Public sector spending on R&D (in GDP) -0.229**
(-2.537)
Lagged Private sector spending on R&D (in GDP) -0.0225
(-0.790)
Intercept 0.314*** -0.0154 -0.0722 -0.199* -0.566** 0.0636
(3.495) (-0.305) (-0.994) (-1.755) (-2.662) (0.861)
Country fixed effects Yes Yes Yes Yes Yes Yes
Observations 317 421 413 382 202 236
Number of countries 17 19 19 19 17 16
Notes: The estimates control for the age dependency ratios. T-statistics in parentheses. *** p<0.01, ** p<0.05, * p<0.1.
References
Aiyar, Shekhar and Dalgaard, Carl-Johan, 2009. Accounting for productivity: Is it OK to assume that the world is Cobb-Douglas?, Journal of Macroeconomics, Elsevier, vol. 31(2), pages 290 303, June.
Aiyar, Shekhar and Mody, Ashoka, 2013. The Demographic Dividend: Evidence from the Indian States, India Policy Forum, National Council of Applied Economic Research, vol. 9(1), pages 105-148.
Aiyar, Shekhar, and Feyrer, James, 2002. A Contribution to the Empirics of Total Factor Productivity, Dartmouth College working paper.
Aksoy, Yunus, Basso, & Henrique, Grasl, Tobias, and Smith, Ron. 2015. Demographic Structure and Macroeconomic Trends, Birkbeck Working Papers in Economics and Finance 1501, Birkbeck, Department of Economics, Mathematics & Statistics.
Bloom, D., Canning, D., and P. Malaney, P., 2000. Population dynamics and economic growth in Asia. Population and Development Review, 26 (Supplement), pages 257– 90.
Bordon, Anna Rose, Ebeke, Christian, and Shirono, Kazuko, 2016. When Do Structural Reforms Work? On the Role of the Business Cycle and Macroeconomic Policies, IMF Working Papers 16/62, International Monetary Fund.
Börsch-Supan, Axel, and Weiss, Matthias, 2016. Productivity and age: Evidence from work teams at the assembly line, The Journal of the Economics of Ageing, vol.7, pages 30–42.
Clements, Benedict, Dybczak, Kamil, Gaspar, Vitor, Gupta, Sanjeev, and Soto, Mauricio, 2015. The Fiscal Consequences of Shrinking Populations, IMF Staff Discussion Notes 15/21,
International Monetary Fund.
Cuaresma, Crespo, Loichinger, Elke, and Gallina, Vincelette, 2016. Aging and income convergence in Europe: A survey of the literature and insights from a demographic projection exercise, Economic Systems, Elsevier, vol. 40(1), pages 4-17.
Disney, Richard, 1996. Can we afford to grow older? A Perspective on the economics of aging, MIT Press, Cambridge: Mass.
Dixon, Silvia, 2003. Implications of population ageing for the labour market. Labour Market Trends, February.
Feyrer, James, 2007. Demographics and Productivity, The Review of Economics and Statistics, MIT Press, vol. 89(1), pages 100-109.
Feyrer, James, 2008. Aggregate evidence on the link between age structure and productivity, Population and Development Review, pages 78-99.
Göbel, Christian and Zwick, Thomas, 2012. Age and Productivity: Sector Differences, De Economist, Springer, vol. 160(1), pages 35-57, March.
Hall, Robert, and Jones, Charles I., 1991. Why Do Some Countries Produce So Much More Output per Worker Than Others? Quarterly Journal of Economics 114:1, pages 83–116.
Jaimovich, Nir, and Siu, Henry, 2009. The Young, the Old, and the Restless: Demographics and Business Cycle Volatility, American Economic Review, American Economic Association, vol. 99(3), pages 804-26, June.
Jones, Benjamin, 2010. Age and Great Invention, The Review of Economics and Statistics, MIT Press, vol. 92(1), pages 1-14, February.
Persson, Joakim, 2002. Demographics, Human Capital, and Economic Growth: A Study of US States 1930-2000, FIEF working paper, February.
Psacharopoulos, George, 1994. Returns to investment in education: A global update, World Development, Elsevier, vol. 22(9), pages 1325-1343, September.
Siliverstovs, Boriss, Kholodilin, Konstantin, Thiessen, Ulrich, 2011. Does aging influence structural change? Evidence from panel data, Economic Systems, Elsevier, vol. 35(2), pages 244-260, June.
Veen, S., 2008. Demographischer Wandel, alternde Belegschaften und Betriebsproduktivität. Munich: Rainer Hampp Verlag.
Werding, Martin, 2008. Ageing and Productivity Growth: Are there Macro-level Cohort Effects of Human Capital?, CESifo Working Paper Series 2207, CESifo Group Munich.
Wong, Wei-Kang, 2007. Economic Growth: A Channel Decomposition Exercise, The B.E. Journal of Macroeconomics: vol. 7: Iss. 1 (Topics), Article 4.
Appendix I. Aging and Productivity
Population Pressure
(Percent, share of age 65+ to the total population)
2015 2020 2025 2030 2035 Japan 26.8 29.1 30.3 31.6 33.4 Austria 18.7 19.7 21.5 24.0 26.1 Belgium 18.2 19.2 20.7 22.3 23.5 Denmark 18.8 20.4 21.7 23.3 24.7 Estonia 18.8 20.4 22.4 24.2 25.4 Finland 20.2 22.4 24.1 25.5 26.3 France 18.8 20.6 22.1 23.6 24.8 Germany 21.2 22.4 24.3 27.2 29.7 Greece 20.1 21.3 22.9 24.8 27.2 Ireland 13.3 14.9 16.6 18.5 20.3 Italy 21.5 22.5 23.9 26.1 28.7 Latvia 18.6 18.9 19.9 20.8 21.2 Lithuania 17.1 17.9 19.7 21.8 23.2 Luxembourg 15.5 16.6 18.1 20.0 21.6 Netherlands 17.9 19.9 22.0 24.3 26.2 Norway 16.7 18.0 19.3 20.6 22.0 Portugal 20.5 22.6 24.9 27.5 29.8 Slovakia 13.9 16.6 19.3 21.4 23.0 Slovenia 17.9 20.4 22.7 24.8 26.6 Spain 18.6 20.4 22.8 25.9 29.3 Sweden 19.7 20.3 21.1 22.1 23.2 Switzerland 19.1 20.5 22.4 24.7 26.5 United Kingdom 18.0 19.0 20.2 21.9 23.2 Canada 15.9 18.0 20.3 22.6 23.5 United States 14.8 16.8 18.8 20.3 20.9 Australia 14.9 16.1 17.4 18.6 19.3 New Zealand 14.7 16.6 18.8 21.0 22.6 Super-aged >20 Aged 14-20 Aging 7-14 Not-aging <7
Labor Force Pressure (Percent, share of worker 55-64 to the labor force 15-64)
2014 2020 2025 2030 2035 Austria 11.3 15.6 16.9 16.3 15.5 Belgium 12.9 16.6 16.4 15.9 15.7 Denmark 16.3 19.2 20.3 20.3 19.2 Estonia 17.8 18.9 19.1 20.8 21.7 Finland 18.2 18.9 18.3 16.7 16.8 France 14.3 15.8 17.4 17.6 16.6 Germany 18.2 22.0 23.7 21.7 20.1 Greece 11.5 18.5 21.3 23.7 25.4 Ireland 13.4 15.5 16.9 19.2 21.5 Italy 14.8 19.9 23.6 25.8 25.8 Latvia 16.8 18.1 18.5 19.3 19.0 Lithuania 16.3 18.0 19.1 19.8 19.2 Luxembourg 10.3 12.7 13.4 12.9 12.2 Netherlands 16.2 18.5 20.2 19.6 17.8 Norway 16.6 17.2 17.9 17.9 16.8 Portugal 14.9 18.4 20.4 22.5 24.1 Slovakia 13.6 14.9 15.2 17.2 20.6 Slovenia 11.4 17.2 18.9 19.3 20.4 Spain 13.1 19.0 22.2 25.4 27.5 Sweden 18.0 17.9 18.6 18.8 18.2 Super-aged >15 Aged 10-15 Aging 5-10 Not-aging <5
Sources: OECD; European Comission; and IMF staff calculations.