The environmental impacts of lowland paddy rice:
A case study comparison between rainfed
and irrigated rice in Thailand
Abstract
North-eastern Thailand is an essential production area for high-quality fragrant rice for domestic use and export. While rainfed conditions largely prevail, plans to extend irrigation are drafted. This article compares paddy rice production under irrigation and rainfed conditions. Techno-economic performances were analysed jointly with environ-mental impacts, based upon life cycle analysis, and energy and water use analyses. Data were collected in 2010 from 45 diverse rice cropping systems in the Lam Sieo Yai Basin, according to three systems, namely wet-season rain-fed (Rw), wet-season irrigation (Iw), and dry-season irrigation (Id) systems. Wide-ranging performances and impacts were observed, while cropping practices were relatively homogeneous. Differentiation of systems originated mostly from differences in yield, which were largely impacted by water supply. The results highlight the low performances and high impacts of Id systems. They require mostly blue water, while the two other systems rely primarily on green water. Id systems also require more energy and labour, due to increased water management needs. The productivity of most production factors was higher in Rw and Iw systems. Emissions proved relatively similar across systems, with the exception of CH4, which was markedly
lower in Rw systems due to specific water and organic residue management. Id systems systematically emitted more nitrates, phosphates, and pesticides. Rw systems showed the lowest environmental impacts per ha and per kg of paddy rice produced. The average Global Warming Potential was 2.97 kg CO2-eq per kg rice in Rw systems, 4.87 in Iw
systems, and 5.55 in Id systems. This article further discusses the results in view of contrasting perspectives, including societal objectives, farmer income and environmental integrity, and possible irrigation development in north-eastern Thailand.
Key words: environmental impact; irrigation; life cycle analysis; productivity; rice. Subjects: natural resources and environment; vegetal productions; water.
Résumé
Les impacts environnementaux du riz de bas-fonds : comparaison de systèmes irrigués et pluviaux en Thaïlande
Le Nord-Est de la Thaı¨lande est une re´gion essentielle pour la production de riz parfume´ de haute qualite´ a` usage domestique et a` l’export. Alors que les syste`mes pluviaux dominent, des plans d’extension de l’irrigation sont pre´pare´s. Cet article compare la production de riz en casier irrigue´ et en pluvial. Les performances technico-e´conomiques et les impacts environnementaux ont e´te´ analyse´s conjointement, a` l’aide des analyses du cycle de vie et des usages de l‘e´nergie et de l’eau. Les donne´es ont e´te´ collecte´es en 2010 dans 45 syste`mes de culture du bassin de Lam Sieo Yai, selon trois syste`mes : pluvial de saison humide (Rw), irrigue´ de saison humide (Iw) et irrigue´ de saison se`che (Id). On observe des performances et des impacts tre`s diffe´rencie´s, alors que les syste`mes sont relativement homoge`nes. Ces diffe´rences entre syste`mes proviennent essentiellement des rendements, eux-meˆmes influence´s par les apports d’eau. Les re´sultats soulignent les moindres performances et les Sylvain-Roger Perret1 Kwansirinapa Thanawong2 Claudine Basset-Mens3 Rattanawan Mungkung4 1 Cirad UMR G-Eau 73 rue J-F Breton 34398 Montpellier cedex 5 France <[email protected]> 2
Asian Institute of Technology School of Engineering and Management Po Box 4 Klong Luang 12120 Pathumthani Thailand <[email protected]> <[email protected]> 3 Cirad UR Hortsys Boulevard de la Lironde TA B-103/PS4 34398 Montpellier cedex 5 France <[email protected]> 4 Kasetsart University Faculty of Environment
Department of Environmental Technology and Management 10900 Chatuchak Thailande <[email protected]> doi:10.1684/agr.2013.0663 Correspondence: S. Perret
To cite this article: Perret SR, Thanawong K, Basset-Mens C, Mungkung R, 2013. The environmental impacts of lowland paddy rice: A case study comparison between rainfed and irrigated rice in Thailand. Cah Agric 22: 369-77. doi :10.1684/agr.2013.0663
W
orldwide, paddy rice sys-tems provide food, income, and a diversity of ecosys-tem goods and services (Boumanet al., 2007), yet they also have negative impacts on the environment (Roger et Joulian, 1998; Tilmanet al., 2001). Rice production requires large amounts of resources and contributes to pollution in all environmental compartments. Flooded rice grows under anaerobic conditions, which favours methane formation (IPCC, 2006).Thailand is the world’s sixth largest rice producer and largest exporter. Rice is grown on some 10 million hectares of land, with more than half grown in the north-eastern region (Isaan). Rice pro-duction in Isaan is currently mostly lowland rain-fed (85% of paddy land area; only in the wet season) and irrigated (15% of paddy land cover during the wet season; only 7.5% during the dry season), and shows low yields of high-quality, high-value varieties (Jasmine fragrant rice for domestic use and export). Isaan pro-duces approximately 80% of all jasmine rice produced nationwide.
Overall, rice production systems con-tribute 80% of freshwater extractions in Thailand, and pesticide-related toxicity has become a major concern. There exist recurring plans to extend irrigation in Isaan (Molle and Floch, 2008), which can be implemented only through further exploitation of the Mekong river and its tributaries and wetlands.
Given the importance of the rice sector in Thailand and growing concerns about its sustainability, this research aims at assessing the environmental impacts of rice cropping systems in Isaan as a main production area. In view of existing plans to extend irrigation in Isaan, the research also compares the advantages of rice production under controlled irrigation and rain-fed conditions in both envi-ronmental and economic terms.
Materials
and methods
Study area description
The Lam Sieo Yai basin (2,875 km2) is located at the heart of the Isaan plateau in North-eastern Thailand. The region has a tropical savanna climate, with two seasons: the dry season between November and April, which commonly includes severe drought conditions, and the monsoon-affected wet season between May and October. Annual rainfall amounts to approximately 900 mm on average, yet with high inter-annual variability.
Of the total area, 83% is agricultural land, of which 96% is covered with paddy fields. In the basin, 75% of paddy fields are irrigated (i.e. with controlled water supply). The other 25% are rainfed paddy fields. Lowland
rainfed rice is grown only during the wet season, while irrigated rice may be cultivated during both seasons. Rainfed conditions refer to conditions of lowland rice that is cropped under flooding conditions with no control of water supply. Rainfall, soil moisture, and natural runoff alone (green water) provide water to the paddy fields.
Joint LCA and
techno-economic analyses
General approach
Among other methodologies, life cycle analysis (LCA) has recently emerged as the leading methodology to assess potential environmental impacts in agriculture (Van der Werf and Petit, 2002). This approach is increasingly used in the industry and the agriculture sectors for assessing processes and products and for the development and implementation of environmental policies (EU, 2010a). LCA is a struc-tured, systematic, standardised method (ISO 14040 and 14044) for quantifying the emissions, resources consumed, and environmental and health impacts that are associated with the production and use of goods and services (pro-ducts). LCA consists of a thorough and systematic inventory (life cycle inven-tory, LCI) of processes, emissions, resource consumptions, and inputs and outputs related to the provision of a good or service. It then converts the impacts forts des syste`mes Id. Ils requie`rent de l’eau d’irrigation (eau bleue) alors que les autres consomment avant tout les pre´cipitations utiles et le stock d’eau du sol (eau verte). Les syste`mes Id consomment aussi plus d’e´nergie et de main-d’œuvre pour la gestion de l’irrigation. La productivite´ de la plupart des facteurs de production est supe´rieure dans les syste`mes de saison humide Rw et Iw. Les rejets s’ave`rent similaires dans tous les syste`mes, a` l’exception du CH4,nettement moins e´mis par Rw en raison des modalite´s de gestion de
l’eau et des re´sidus de culture. Les syste`mes Id rejettent syste´matiquement plus de nitrates, de phosphates et de pesticides. Les syste`mes Rw montrent les impacts les plus faibles, par hectare et par kilo de riz produit. Le potentiel de re´chauffement climatique est en moyenne de 2,97 kg CO2-eq par kilo de riz dans les syste`mes Rw, 4,87 dans les syste`mes Iw, et 5,55
dans les syste`mes Id. Enfin, l’article discute les re´sultats, au regard des objectifs socie´taux et de ceux des producteurs, du respect de l’environnement, et du possible de´veloppement de l’irrigation dans le Nord-Est de la Thaı¨lande.
Mots cle´s : analyse du cycle de vie ; impact sur l’environnement ; irrigation ; productivite´ ; riz.
inventory into impact indicators as per impact categories. This step is the life cycle impact assessment (LCIA) phase (Baumann and Tillman, 2004; EU, 2010b).
LCA application in agriculture has developed over the last 15 years (Audsley et al., 1997) and addressed most agricultural commodities (Williams et al., 2005). Yet, paradoxically, rice has been rarely studied. To the authors’ knowledge, there are only three com-prehensive published applications of LCA to rice (Blengini and Busto, 2009; Wang et al., 2010; Hokazono and Hayashi, 2012). The two former com-pare an alternative, supposedly less impacting, cropping system with an existing one.Wanget al. (2010)studied only one system. In all cases, the assessments focus on virtual systems that represent average, ideal situations, regardless of the diversity of local situations and practices. Basset-Mens et al. (2010)assessed rice LCA literature and highlighted the overall paucity and limitations, including a lack of consideration of the actual diversity of field and farm situations and of water and energy use.
The research is an attempt to better address the actual diversity of existing systems. It collected, analysed, and
combined indicators of techno-economic performances with environ-mental impact indicators based upon the life cycle approach, at cropping system level. Techno-economic ana-lysis typically results in monetary values as per factor of production while LCA expresses environmental impacts as per selected functional units FU. The FU for LCA is the mass (kg) of raw paddy rice (unmilled) at the farm gate (approximately 15% moisture content).
Three cropping systems were investi-gated based upon water management system: wet-season rain-fed rice (Rw), wet-season irrigated rice (Iw), and dry-season irrigated rice (Id). Direct sowing of dry seeds has become predominant in Isaan. The results presented here refer to this planting mode in each water management system.
Primary data were collected by means of field observations and interviews with farmers; data refer to both dry and wet seasons of 2010. Year 2010 received 1,219 mm of precipitation, which is notably more than the 30-year average (900 mm). For each system, 15 farm plots were selected with ex-tension officers and farmers, based upon representativeness and local diversity.
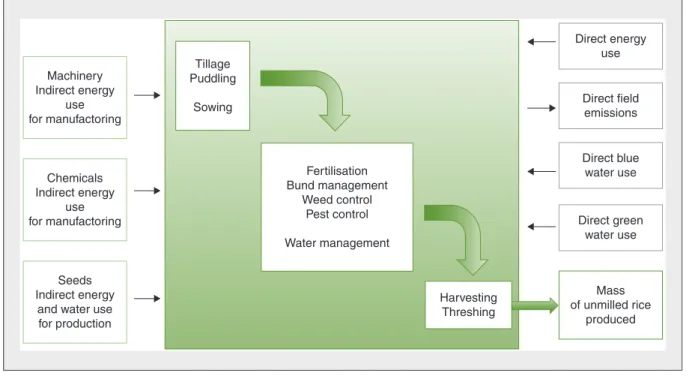
The present LCA study covered the rice production systems from the mobilisation of all raw resources and equipment to farm gate (unmilled rice).Figure 1shows the flow diagram used for the study, where both direct and indirect flows were considered in the inventory.
Joint inventories
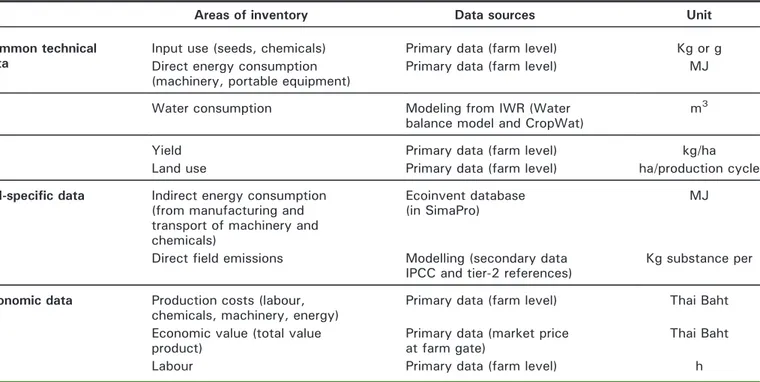
The common technical data and specific data needed for LCI and economic analyses for the main stages of rice production are presented in
table 1. The inventory comprises the following processes and operations: - field operations with machinery; - field operations performed manually; - inputs and agro-chemical use; - yields and market price at the farm gate;
- cultivated areas.
Actual water consumption is un-known in canal, gravity-based condi-tions. Crop water requirements (CWR) and irrigation water requirements (IWR, blue water), both modelled from soil, crop, and climate data, are usually used as proxies (Allen et al., 1998). Recent versions of the FAO’s CropWat (FAO, 1992; Chapagain and Hoekstra, 2011), coupled with water
Machinery Indirect energy use for manufactoring Chemicals Indirect energy use for manufactoring Seeds Indirect energy
and water use for production Tillage Puddling Sowing Fertilisation Bund management Weed control Pest control Water management Harvesting Threshing Direct energy use Direct field emissions Direct blue water use Direct green water use Mass of unmilled rice produced
Figure 1. Flow diagram for rice cropping systems: general inventory of inputs and outputs from resources mobilisation to farm gate (unmilled rice).
Figure 1. Diagramme de flux en systèmes rizicoles : inventaire général des intrants et extrants, de la mobilisation des ressources à la porte de la ferme (riz non-décortiqué).
balance modelling in ponding condi-tions, have been used.
The inventory for the manufacturing and delivery of machinery, agroche-micals and seeds, equipment, machinery, inputs, and energy carriers used during field operations were calculat-ed with SimaPro 7 from field data and based upon existing conversion rates, methods, and databases (Ecoinvent database). These flows are shown on the left side offigure 1. Flows related to direct field emissions, energy use, and blue (irrigation) and green (rainfall) water use are shown on the right side of figure 1. Human labour is being considered only in techno-economic calculations.
CH4 emissions were modelled based
upon tier-1 methods established by the International Panel on Climate Change (IPCC, 2006) for paddy under different water regimes, adjusted with tier-2 baseline emission factors determined byYanet al. (2003a)for Thailand. For N2O, NH3, and NOx emissions, the
methods developed by Yan et al. (2003b) were used. They suggested tier-2 methods for flooded paddy fields in South East Asia. Carbon dioxide was considered neutral (Williams et al.,
2005). The observed average length of cropping cycles is 120 days, from sowing to harvesting.
Water-soluble nitrates and phosphates have been considered to be the two potential pollutants emitted to the water compartments during rice crop-ping. A similar approach was carried out for both of these pollutants. Because urea and ammonium-based fertilisers prevail in Isaan, direct nitrate emissions result mostly from nitrifi-cation and the whole nitrogen cycle and balance, rather than direct fertiliser loss. The principles underlying the nitrate emission assessment are that: i) nitrates form the remaining components of the overall nitrogen mass balance the other components of which were determined in earlier sections; ii) these water-soluble nitrates may leach to the water compartment through surface drainage and deep percolation; and iii) such a portion refers to the ratio between water that is not used by the crop and overall water supply (that is water use efficiency). Accordingly, nitrates potentially leach-ing from a paddy field are modelled according to a dual N and water mass balance approach suggested
byBrentrupet al. (2000)and Pathak et al. (2004).
A similar approach was applied to phosphates, under similar assumptions regarding the stability of long-term contents, the absence of erosion, and with a similar modelling approach. P inputs from fertiliser were calculated from fertiliser formulae and application doses.
In the cropping systems under study, the pesticides typically used included a molluscicide (metaldehyde), an insecticide (isoprocarb-based with CaCO3), and an herbicide
(glypho-sate); all are hand-sprayed at different stages while the field is flooded most of the time. It was assumed that 100% of pesticides ultimately end up in both soil and water compartments. Straw and rooting systems are left in the field to decay. It was decided to split emissions equally between soil and water compartments (50%-50%). LC impact assessment
The selected environmental impact indicators first include resource-use indicators: energy use (EU), fresh-water use (WU), and land use (LU).
Table 1.
Type and source of data needed for life cycle inventory (LCI) and economic analyses.
Tableau 1. Type de données et leurs sources pour l'inventaire ACV (analyse du cycle de vie) et les analyses économiques.
Areas of inventory Data sources Unit
Common technical data
Input use (seeds, chemicals) Primary data (farm level) Kg or g
Direct energy consumption (machinery, portable equipment)
Primary data (farm level) MJ
Water consumption Modeling from IWR (Water
balance model and CropWat)
m3
Yield Primary data (farm level) kg/ha
Land use Primary data (farm level) ha/production cycle
LCI-specific data Indirect energy consumption
(from manufacturing and transport of machinery and chemicals)
Ecoinvent database (in SimaPro)
MJ
Directfield emissions Modelling (secondary data
IPCC and tier-2 references)
Kg substance per
Economic data Production costs (labour,
chemicals, machinery, energy)
Primary data (farm level) Thai Baht
Economic value (total value product)
Primary data (market price at farm gate)
Thai Baht
Labour Primary data (farm level) h
IWR: irrigation water requirements; IPCC: International Panel on Climate Change.
It should be noted that no characteri-sation towards indicators of potential water resource depletion was used. Current methodologies (Pfisteret al., 2009) that calculate regional Water Stress Index (WSI) do not provide satisfactory results in tropical mon-soon areas. Indeed, the algorithm considers the high monthly variations of precipitations, and results in artifi-cially high WSI. Second, they include environmental impact indicators: eu-trophication (EP), acidification (AP), global warming potential for a 100-year time horizon (GWP100),
freshwa-ter aquatic ecotoxicity (FWAE), and ozone depletion (ODP). These impact categories were chosen based upon their widespread use in agricultural LCA studies, allowing for comparison. More specifically, FWAE was selected because freshwater is a key compart-ment of paddy rice cropping systems. Characterisation was performed with the SimaPro platform using CML baseline 2002/world, 1995 methodol-ogy. All units are provided intable 2. GWP100 was calculated according to
IPCC (Guine´eet al., 2002). EP, FWAE, and ODP were calculated with factors recommended byGuine´eet al. (2002). AP was calculated using the generic method proposed by Heijungs et al. (1992). Energy use was calculated
based upon direct and indirect fossil fuel use, including physical (machi-nery) and chemical (fertilisers and pesticides) energy. Crop evaporative consumption was modelled with wa-ter balance and CropWat models (FAO, 1992); it included the evapora-tion of rainfall from cropland (green water use, WUg) and the evaporation
of irrigation water from cropland (blue water use, WUb). Land use refers to the
loss of land as a resource in the sense of being temporarily unavailable for other purposes. Details on CML 2002 calculations, impact factors, and nor-malisation may be found in Guine´e et al. (2002). CML 2002 methodologies and necessary databases are included in the SimaPro 7.3 modelling platform, which was used for this research. Commercial pesticides were modelled according to their active ingredients and the inventory data from Ecoinvent database within SimaPro.
Results
Utilisation of production
factors and performances
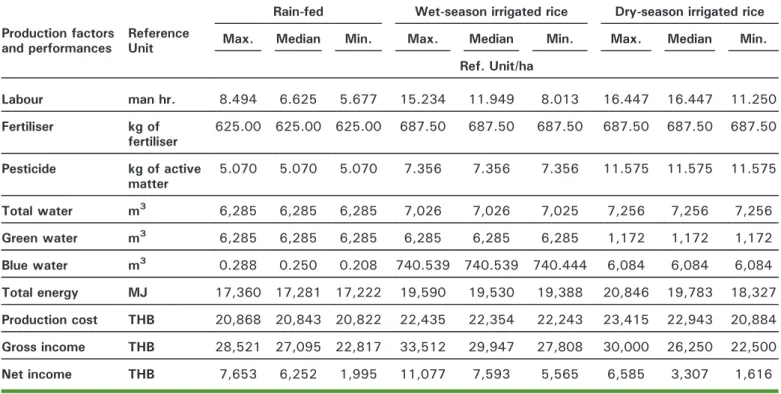
Table 3 shows the techno-economic performances of the three cropping
systems per area cultivated (ha). The results highlight the low performances of Id systems, the production factor requirements of which are systemati-cally higher than those of the two other systems. In addition, the Id system yielded markedly lower pro-duction. The Id system also requires mostly blue water, while the other two rely predominantly on green water. The Id system requires three pumping episodes, on average, to replenish ponding conditions in paddy fields; therefore, it requires more labour and energy (pumps).
Labour, energy, and pesticide require-ments are markedly lower in rain-fed conditions due to lesser water mana-gement requirements (no pumping) and an absence of treatment against the golden snail (Pomacea canalicu-lata) which cannot reproduce during the cropless dry season of rain-fed plots.
The high level of homogeneity of fertiliser and pesticide application practices within each cropping sys-tem resulted in relatively homoge-neous production costs per system, however, there were diverse out-comes in terms of yield and, there-fore, of gross and net income. Net income per system was wide-rang-ing, with the Id system being the least
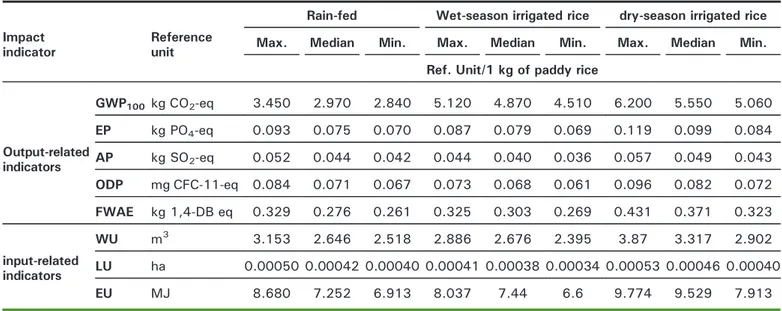
Table 2.
Environmental impact indicators in selected rice cropping systems in the Lam Sieo Yai basin
in 2010.
Tableau 2. Indicateurs d'impacts environnementaux de systèmes rizicoles du bassin de Lam Sieo Yai, année 2010.
Impact indicator
Reference unit
Rain-fed Wet-season irrigated rice dry-season irrigated rice
Max. Median Min. Max. Median Min. Max. Median Min.
Ref. Unit/1 kg of paddy rice
Output-related indicators GWP100 kg CO2-eq 3.450 2.970 2.840 5.120 4.870 4.510 6.200 5.550 5.060 EP kg PO4-eq 0.093 0.075 0.070 0.087 0.079 0.069 0.119 0.099 0.084 AP kg SO2-eq 0.052 0.044 0.042 0.044 0.040 0.036 0.057 0.049 0.043 ODP mg CFC-11-eq 0.084 0.071 0.067 0.073 0.068 0.061 0.096 0.082 0.072 FWAE kg 1,4-DB eq 0.329 0.276 0.261 0.325 0.303 0.269 0.431 0.371 0.323 input-related indicators WU m3 3.153 2.646 2.518 2.886 2.676 2.395 3.87 3.317 2.902 LU ha 0.00050 0.00042 0.00040 0.00041 0.00038 0.00034 0.00053 0.00046 0.00040 EU MJ 8.680 7.252 6.913 8.037 7.44 6.6 9.774 9.529 7.913
Results are expressed per kg rice produced.
GWP: global warming potential; EP: eutrophication; AP: acidification; ODP: ozone depletion; FWAE: freshwater aquatic ecotoxicity; WU: freshwater use; LU: land use; EU: energy use.
profitable and the most variable. Conditions during the dry season are less favourable temperature-wise and more uncertain and variable in terms of water management. Iw systems showed higher homogeneity of results and a potential for the highest yields and net income.
Table 4 shows the productivities of production factors and the techno-economic performances of the three rice cropping systems. Overall, the results confirm that the productivities of most factors are higher in the Rw system, in which farmers produce more rice per labour unit, pesticide unit, and total energy unit. Interest-ingly, the productivities in the Rw and Iw systems are similar with regards to factors such as fertiliser, total water, and green water. Return on invest-ment (mass of rice produced per production cost) is slightly higher in the Iw system compared to the Rw system (0.117 kg/THB and 0.114 kg/ THB, respectively; [1 THB=0.03 US$]) and is lowest in the Id system (0.095 kg/THB). Median yields (land productivity) vary from 2,625 kg/ha in
the Iw system to 2,375 in the Rw system, and 2,188 in the Id system. Finally, the amount of rice per net income unit is markedly lower in the Iw system (0.297 kg/THB earned as net income) and Rw system (0.310) compared to the Id system, in which farmers need to produce twice as much rice (0.662 kg) to obtain the same net income.
Environmental impacts
On a land use basis, LCIA results show that GWP100 is markedly
dif-ferent between rain-fed and irrigated systems, Iw showing the highest impact (table 2). Differences in CH4
emissions (because of straw incor-poration and water management during pre-cultivation times) account for this result. In all other impact categories, Rw systems systematically show lower impacts per ha than Iw and Id systems, with the latter having the highest impacts. However, AP, ODP, and total water use are of the same magnitude across systems (figure 2).
On a rice mass basis, differences are more marked, due to yield differences. Intable 2, the environmental impacts for selected impact categories, per kg of unmilled rice produced, are reported. The impacts of Id systems are higher than those of the two other systems due to the lower yields. GWP100becomes higher in Id systems
(5.55 kg CO2-eq) compared to Iw
systems (4.87). Rw systems remain the least impacting, with 2.97 kg CO2
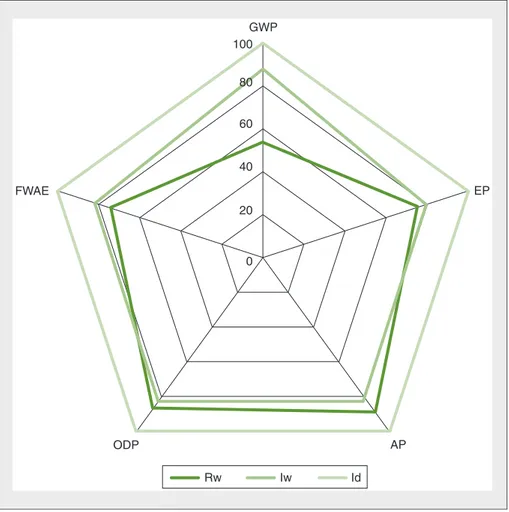
-eq. Total energy use is higher in Id systems (9.64 MJ/kg rice) compared to Iw and Rw systems (7.50 and 7.29, respectively). Figure 3reports a rela-tive comparison of selected environ-mental impacts by the three systems, and highlights the same differences, and the high impacts of Id systems. It was calculated that Rw systems value each ton of CO2-eq emitted at
4,040 THB, or approximately 134 US$. Iw and Id systems value each ton of CO2-eq emitted at 82 and 72 US$,
respectively.
Figure 2shows the diversity of water consumption in the sampled cropping systems. Variations in water use are
Table 3.
Production factor use and techno-economic performances per hectare in selected rice
cropping systems in the Lam Sieo Yai basin in 2010.
Tableau 3. Utilisation des facteurs de production et performances technico-économiques de systèmes rizicoles du bassin de Lam Sieo Yai, année 2010.
Production factors and performances
Reference Unit
Rain-fed Wet-season irrigated rice Dry-season irrigated rice
Max. Median Min. Max. Median Min. Max. Median Min.
Ref. Unit/ha Labour man hr. 8.494 6.625 5.677 15.234 11.949 8.013 16.447 16.447 11.250 Fertiliser kg of fertiliser 625.00 625.00 625.00 687.50 687.50 687.50 687.50 687.50 687.50 Pesticide kg of active matter 5.070 5.070 5.070 7.356 7.356 7.356 11.575 11.575 11.575 Total water m3 6,285 6,285 6,285 7,026 7,026 7,025 7,256 7,256 7,256 Green water m3 6,285 6,285 6,285 6,285 6,285 6,285 1,172 1,172 1,172 Blue water m3 0.288 0.250 0.208 740.539 740.539 740.444 6,084 6,084 6,084 Total energy MJ 17,360 17,281 17,222 19,590 19,530 19,388 20,846 19,783 18,327 Production cost THB 20,868 20,843 20,822 22,435 22,354 22,243 23,415 22,943 20,884 Gross income THB 28,521 27,095 22,817 33,512 29,947 27,808 30,000 26,250 22,500 Net income THB 7,653 6,252 1,995 11,077 7,593 5,565 6,585 3,307 1,616
especially marked in dry-season irri-gation, showing diversity of practices in farmers’ decisions and strategies regarding water supplies (pumping episodes).
A contribution analysis showed the relative contribution of cropping sub-systems to each impact category. Direct field emissions to air and water overwhelmingly contribute to AP, EP, GWP100, and FWAE; they mostly
depend on water management prac-tices for methane emissions, and both agro-chemical and water management for other emissions. Field operations with machinery and equipment con-tribute 20% of all energy use and a large part of ODP. Fertiliser applica-tion and manufacturing contribute a majority of total energy use, a large part of ODP, FWUE, and a marginal amount to AP, EP, and GWP100. Rice
seeds contribute marginally to FWAE and EU. Pesticide application requires small amounts of water, and the main contributor to WU remains crop water use. 11 10 9 8 7 6 5 4 3 2 1 0 <2.5 2.5-2.7 2.7-2.9 2.9-3.1 3.1-3.3 3.3-3.5 3.5-3.7 <3.7 Occurrence frequenc y
Water use class (m3/1 kg of paddy rice)
Rainfed lw ld
Figure 2. Total water use (WU) per kg of paddy rice produced, modelled for the 45 rice cropping systems (wet and dry seasons in 2010).
Figure 2. Usage total en eau par kilo de paddy produit, modélisé pour les 45 systèmes rizicoles (saisons humide et sèche 2010).
Rainfed; Iw: Irrigated wet season; Id: Irrigated dry season.
Table 4.
Productivity of production factors and techno-economic performances in selected rice
cropping systems in the Lam Sieo Yai basin in 2010.
Tableau 4. Productivités des facteurs de production et performances technico-économiques de systèmes rizicoles du bassin de Lam Sieo Yai, année 2010.
Production factors and performances
Reference Unit
Rain-fed Wet-season irrigated rice Dry-season irrigated rice
Max. Median Min. Max. Median Min. Max. Median Min.
Kg of paddy rice/Ref. Unit
Land ha 2,500 2,375 2,000 2,938 2,625 2,438 2,500 2,188 1,875 Labour man hr. 440.37 358.49 235.47 366.60 219.69 160.00 222.22 133.00 160.00 Fertiliser kg of fertiliser 4.000 3.800 3.200 4.273 3.818 3.545 3.636 3.182 2.727 Pesticide kg of active matter 493.10 468.44 394.48 399.32 356.84 331.35 215.98 188.98 161.99 Total water m3 0.398 0.378 0.318 0.418 0.374 0.347 0.345 0.301 0.258 Green water m3 0.398 0.378 0.318 0.467 0.418 0.388 2.133 1.866 1.600 Blue water m3 12,000 9,500 6,933 3.97 3.545 3.292 0.411 0.360 0.308 Total energy MJ 0.145 0.1379 0.115 0.15151 0.13441 0.12442 0.1264 0.10494 0.1023 Production cost THB 0.120 0.114 0.096 0.131 0.117 0.110 0.107 0.095 0.090 Gross income THB 0.083 0.083 0.083 0.083 0.083 0.083 0.083 0.083 0.083 Net income THB 0.629 0.310 0.274 0.348 0.287 0.229 1.160 0.662 0.380
Discussion
and conclusion
In spite of the relative homogeneity of cropping practices, overall and per sub-cropping system, outcomes in both economic and environmental terms show significant diversity. Net income and global warming potential are particularly wide-ranging in the different systems. This variation mostly results from large differences in yields, overall and per sub-cropping system. Yields and resulting net incomes are more diverse (less stable) in Rw and Id systems com-pared to Iw systems, due to a lack of control of the water supply and a lack of water, respectively. It was
observed that, while Id farmers usually try to refill their paddy fields three times per season, many do not actually obtain enough water (e.g., canal tail-enders). The precipitation levels of the dry season of 2010 were relatively high compared to 30-year average precipitation levels; the lack of water for Id system farmers could have been even more damaging to yields in normal or drier years. This would potentially result in lower yields and increased differences in performances and impacts between wet-season and dry-season systems. The same rationale applies to Rw systems, which showed relatively high performances and low impacts in 2010, but would perform well below the level of Iw systems under drier conditions.
The results contribute insights and data to the debate on the need to further develop irrigation in the con-text of Isaan, with necessary precau-tions due to limited data. Rain-fed systems are reasonable alternatives and compete well against irrigation during the wet season. Proponents of irrigation development in Isaan advo-cate that rain-fed systems only provide cropping opportunity during the wet season and force farmers to resort to alternative livelihoods in the dry season.
For a societal objective of higher rice production and limitation of outmigra-tion, irrigation during both seasons guarantees higher production overall, and keeps farmers busy all year round. From a farmer’s viewpoint, dry-season irrigation requires more inputs, higher costs and labour, and ultimately shows lower efficiency. Furthermore, if envi-ronmental integrity is factored into decisions, irrigation during the dry season is clearly not the best option. Furthermore, the shift from traditional transplanting to direct sowing of dry seeds illustrates the fact that rice farmers in Isaan are seeking labour efficiency and time-saving solutions, rather than high yields, in a context of labour scarcity, massive seasonal out-migration, and diversified rural liveli-hood systems. Direct seedling results in lower yields, yet with lower labour requirements.
All results converge and establish that dry-season irrigated systems are per-forming less well than other systems. They use blue water, require more energy, labour, and agrochemicals, and ultimately yield lower production. As a result, gross and net incomes are lower. Although these results refer to only one year, they tend to account for why only half of irrigated land is actually cultivated during the dry season.
Also, there is a striking match between Rw and Iw systems. Indeed, perfor-mances of rain-fed and wet-season irrigated rice are comparable in both economic and environmental terms. The productivities of most production factors are higher in Rw systems, although Iw systems yield higher production. Yet again, it must be reiterated that 2010 was a wet year, favourable to Rw systems.
Direct field emissions are comparable in all systems, with the notable
100 80 60 40 20 0 ODP EP AP GWP FWAE Id Iw Rw
Figure 3. Comparative environmental impacts of the three rice cropping systems. Figure 3. Comparaison des impacts environnementaux des trois systèmes rizicoles.
Rw: Rain-fed; Iw: Irrigated wet season; Id: Irrigated dry season.
FWAE: freshwater aquatic ecotoxicity; GWP: global warming potential; EP: eutrophication; ODP: ozone depletion; AP: acidification.
exception of CH4, which is markedly
lower in Rw systems due to water and organic residue management. All envi-ronmental impacts are higher in Id systems, whether they are expressed per area used or per mass product. The type of research performed here is demanding. It is multidisciplinary by nature, requires a huge primary data basis, and involves complex modelling. However, the methodolo-gical combination shows great potential for multi-criteria assessment of crop-ping systems and allows for detailed eco-efficiency analyses.&
References
Allen RG, Pereira LS, Raes D, Smith M, 1998. Guidelines for computing crop water requirements. Irrigation & Drainage Paper, 56. Rome : FAO. Audsley E, Alber S, Clift R, Cowell S, Crettaz P, Gaillard G, et al., 1997. Report on Concerted Action
AIR3-CT94-2028.‘‘Harmonisation of
Environmen-tal Life Cycle Assessment for Agriculture’’.
Brus-sels: European Commission, DG VI Agriculture. Basset-Mens C, Benoist A, Bessou C, Tran T, Perret SR, 2010. Is LCA-based eco-labelling reasonable? The issue of tropical food productions. International conference on Life Cycle Assessment in the agri-food sector.(Vll).
Baumann H, Tillman A, 2004. The hitchhiker's guide to LCA: An orientation in life cycle
assess-ment methodology and application. Lund
(Sweden): Studentlitteratur.
Blengini GA, Busto M, 2009. The life cycle of rice: LCA of alternative agri-food chain management systems in Vercelli (Italy). Journal of Environmental Management 90 : 1512-22.
Bouman B, Barker R, Humphreys E, Tuong TP, 2007. Rice: feeding the billions. In: Molden D, ed. Water for Food, Water for Life. London; Colombo:
Earthscan; International Water Management
Institute.
Brentrup F, Küsters J, Lammel J, Kuhlmann H, 2000. Methods to estimate on-field nitrogen emissions from crop production as an input to LCA studies in the agricultural sector. International Journal of LCA 5 : 349-57.
Chapagain AK, Hoekstra AY, 2011. The blue, green and grey water footprint of rice from production and consumption perspectives. Ecological Economics 70 : 749-58.
European Union, 2010a. International Reference
Life Cycle Data System– ILCD Handbook – General
Guide for LCA. Provisions and action steps. Ispra (Italy); Luxemburg: European Commission, Joint
Research Centre, Institute for Environment
and Sustainability; Office of the European Union Publisher.
European Union, 2010b. International Reference
Life Cycle Data System - ILCD Handbook– Analysis
of existing environmental impact assessment
methodologies for use in LCA. Ispra (Italy);
Luxemburg : European Commission, Joint Re-search Centre, Institute for Environment and
Sustainability; Office of the European Union
Publisher.
FAO, 1992. CROPWAT– A computer program for
irrigation planning and management. FAO Techni-cal Irrigation and Drainage paper, 46. Rome: FAO. Guinée JB, Gorrée M, Heijungs R, Huppes G, Kleijn R, de Koning A, et al., 2002. Life cycle assessment. An operational guide to the ISO standards. Leiden (The Netherlands): Centre of Environmental Sci-ence, Leiden University.
Heijungs R, Guinée JB, Huppes G, Lankreijer RM, Udo de Haes HA, Wegener Sleeswijk A, et al., 1992. Environmental Life Cycle Assessments of Products, Guide and Backgrounds. Leiden (The Netherlands): Centre of Environmental Science, Leiden University.
Hokazono S, Hayashi K, 2012. Variability in environmental impacts during conversion from conventional to organic farming: a comparison among three rice production systems in Japan. Journal of Cleaner Production 28 : 101-12. IPCC, 2006. Guidelines for National Greenhouse Gas Inventories. www.ipcc-nggip.iges.or.jp/pub-lic/2006gl/index.htm.
Molle F, Floch P, 2008. Megaprojects and social and environmental changes: The case of the Thai ‘‘Water Grid’’. Ambio 37 : 199-204.
Pathak BK, Kazama F, Iida T, 2004. Monitoring of nitrogen leaching from a tropical paddy field in Thailand. Agricultural Engineering International: the CIGR Journal of Scientific Research and Develop-ment VI: Manuscript LW 04 015.
Pfister S, Koelhler A, Hellweg S, 2009. Assessing the environmental impacts of freshwater consump-tion in LCA. Environmental Science and Technology 43 : 4098-104.
Roger PA, Joulian C, 1998. Environmental impacts of rice cultivation. In: Chataigner J, ed. Rice quality: a pluridisciplinary approach. Cahiers Options Méd-iterranéennes, 24 (3) International Symposium, 1997/11/24-27, Nottingham (Great Britain). Mont-pellier : CIHEAM-IAMM.
Tilman D, Fargione J, Wolff B, D'Antonio C, Dobson A, Howarth R, et al., 2001. Forecasting agricultur-ally driven global environmental change. Science 292 : 281-4.
Van der Werf HMG, Petit J, 2002. Evaluation of the environmental impact of agriculture at the farm level: a comparison of twelve indicator-based methods. Agriculture, Ecosystems and Environ-ment 93 : 131-45.
Wang M, Xia X, Zhang Q, Liu J, 2010. The life cycle assessment of a rice production system in Taihu region, China. International Journal of Sustainable Development and World Ecology 17 : 157-61. Williams AG, Audsley E, Sandars DL, 2005. Final Report to Defra on Project IS0205: Determining the environmental burdens and resource use in the production of agricultural and horticultural com-modities. London: Department of Environment, Food, and Rural Affairs (Defra).
Yan X, Ohara T, Akimoto H, 2003a. Development of region-specific emission factors and estimation of methane emission from rice fields in the East, Southeast and South Asian countries. Global Change Biology 9 : 237-54.
Yan X, Akimoto H, Ohara T, 2003b. Estimation of nitrous oxide, nitric oxide and ammonia emissions from croplands in East, Southeast and South Asia. Global Change Biology 9 : 1080-96.