5437
Tree species composition, richness and diversity in
the northern forest-savanna ecotone of Ghana
Emmanuel M. Attua1 and Opoku Pabi2
1 Department of Geography and Resource Development, University of Ghana, Legon 2 Institute of Environment and Sanitation, University of Ghana, Legon
Corresponding Author E-mail: emattua@ug.edu.gh
Original submitted in on 17th May 2013 Published online at www.m.elewa.org on 30th September 2013.
ABSTRACT
Objective: Stand structure, composition, abundance and diversity of tree species of the northern forest-savanna ecotone were characterized to determine their spatial variability for land management.
Methodology and result: An inventory of the in-situ tree community of the northern forest-savanna ecotone of Ghana was undertaken using the stratified random sampling technique. In all, 1453 individuals, representing 88 species, 78 genera and 30 families were identified in the study. Antiaris toxicaria, Adansonia digitata, Acacia albida, Afzelia africana and Vitellaria paradoxum were found most dominant in the vegetation. A gradation of tree distribution was evident as the savanna’ portion of the ecotone was more species-rich than the ‘near-forest’ portion. Significant differences were observed of the species richness, densities and diversity of trees across sites (P < 0.05) and savanna trees were preponderant over forest species.
Conclusion and application: This work has provided evidence of variability in tree species composition, richness, density and diversity across the northern forest-savanna ecotone of Ghana. The information could be crucial for monitoring and managing agro-ecosystems sustainability. A future study would be required to isolate proximate factors of tree species distribution in the ecotone.
Key Words: composition, density, diversity, forest-savanna ecotone, Ghana, richness, tree species, INTRODUCTION
In most tropical agro-ecosystems where land cover fluxes are rapid than natural restoration, tree species composition, distribution and diversity are particularly susceptible to change from continuous stress factors such as bushfires, logging and cultivation (Uhi, 1987; Lykke, 1998). The tree component of vegetation must therefore be constantly monitored and managed in order to direct successional processes towards maintaining species and habitat diversity (Pickett and White, 1985; Turner, 1987). This is much so in forest-savanna ecotones for their vital role in differentiation and speciation of tropical ecosystems (Smith et al., 1997). Ghana’s northern
forest-savanna ecotone is an integral part of the Guinean forest-savanna (Fairhead and Leach, 1996), a major agricultural frontier of the country (Afikorah-Danquah, 1997; Amanor and Pabi, 2007) and holds a number of deciduous and evergreen forest species embedded in savannas (Swaine and Hall, 1988). Following decades of rapid land cover conversions of the original forest-savanna mosaics, the present vegetation is much fragmented with considerable loss of tree cover (Pabi and Attua, 2005; Amanor and Pabi, 2007). Though several studies have investigated land cover dynamics in the ecotone (e.g. Pabi and Attua 2005; Amanor and
Journal of Applied Biosciences 69:5437 – 5448
5438 Pabi, 2007; UNEP, 2008; Van der Geest, 2011) there is little management knowledge of tree species composition, richness and diversity of the ecotone. Most studies so far addressing this management gap have nonetheless focused on the neighboring forest (e.g. Asase and Oteng-Yebeoah, 2007; Addo-Fordjour et al., 2009) and savanna ecotypes (e.g. Asase et al., 2009; Asase and Tetteh, 2010; Tom-Dery et al., 2012). This paper will address aspects of this research gap with the aim of contributing to data needed for protection of threatened and economic species and for managing and monitoring the agro-ecosystems’ sustainability. On basis of these, we studied the composition and structure of the tree community in the ecotone by collecting data to answer the following questions: (i) what is the species composition and structure of the tree community; (ii) What are the spatial patterns of tree
distribution in terms of structure and composition; and (iii) what is the relative abundance of forest and savanna tree species in vegetation? The results were discussed using local knowledge and existing relevant literature.
The study area location and physical characteristics: The study area lies approximately central to the Brong-Ahafo region of Ghana, between latitudes 7o22´- 8o0´N and longitudes 1o32´- 2o25´W
and transcends the moist semi-deciduous forest to the south and the Guinea savanna woodland to the north (figure 1). The area is characterized by variable topography with undulating land of 5-10% slope in the south and a predominantly flat land of between 0-2% slopes in the north. Valley basins tend to be wide and generally far apart, thus leaving extensive areas for mechanized commercial farming (Zschekel et al., 1997).
5439
Figure 1: Location map of study area in the context of agro-ecological zones The climate is characterized by high temperatures
averaging 23.9oC (75oF) and a double maxima
rainfall regime. Rainfall ranges from an average of 100 cm in the northern parts to 140 cm in the south and the vegetation is savanna woodland interspersed with high forest mosaics and gallery
forests along banks of streams and rivers (Amanor and Pabi, 2007). Agriculture is the major economic activity of the area, accounting for a high proportion of the income of the economically active population. Food crop farming is the dominant economic activity, using diverse cropping systems (Amanor and Pabi,
5440 2007). Major food crops grown are maize, yam, plantain, cocoyam, pepper, and tomato. These are produced principally for subsistence and occasionally for the local and urban markets. Food cropping is combined with collection and trading in non-timber forest products. Cocoa, oil palm, and citrus are the predominant cash crops (Afikorah-Danquah, 1997). Population distribution and land
management varies across the ecotone with implications for changes in tree species composition, abundance and diversity. In the south, population is much higher and community land is administered by lineages who allocate land to members (Amanor and Pabi, 2007) while the sparsely populated north tends to practice communal land tenure (Van der Geest, 2011).
METHODS
Site selection and field measurements: Site selection was facilitated by using an available land-cover map of the area (Pabi and Attua, 2005) and study plots were demarcated depending on the readiness of community leaders to volunteer parcels of land for the investigation. Sampling took place between August 2010 and May 2011. To effectively cover the study area, improve estimation accuracy, and analyse data spatially, the study area was divided into three geographical zones on basis of proximity to the two major ecotypes adjoining the area – the semi-deciduous forest to the south and the Guinea savannah to the north. These were designated as - ‘near-forest ecotone’ (NFE), ‘near-savannah ecotone’ (NSE) and ‘mid-ecotone’ (ME) sites. In each site, the plotless sampling technique was applied along three transects laid at least 1km apart. This approach is fast, economic and less labour-intensive (Hopkins, 1974). All living trees were identified to species based on Taylor (1952), Hutchinson and Dalziel (1957-1972) and Hawthorne (1990) and all nomenclature followed the International Plant Nomenclature index (IPNI, 2008). The diameter at breast height (dbh) of each tree ≥10 cm was measured with tape (data was obtained of sizes < 10cm dbh but not included in this analysis). Between tree distances were measured and averaged for each site. All trees with multiple trunks were considered as an individual as long as there was a visible connection between trunks and only the thickest trunk was measured.
Data Analysis: Differences in species diversity between sites (β diversity) were compared by Shannon-Weaver’s index (H) which takes into account evenness as well as number of species at a site, estimated as (Magurran, 2004): H = -n i i i 1 P ln(P ) =
∑
………. (1)where Pi is the proportion of the total number of
trees belonging to species i and ln(Pi) is the natural
logarithm of that proportion, and
∑
is summation over all species (n). The index has low sensitivity to plot size differences (Magurran, 2004).Tree density per hectare (D) for each site was obtained as:
D = 100002
d ………. (2)
Where d is the mean distance between trees (Hopkins, 1974).
Information on tree density and diversity of the three sites provided basis for statistical analysis using SPSS software, version 17.0.Differences in tree counts, density and diversity at sites were tested by applying the Kruskal–Wallis test, after log-transformation of data. To test for the differences in similarity of sites, a pairwise Wilcoxon rank sum test was conducted. The assumption of normality was assessed using the Shapiro–Wilk test (Crawley, 2007) and where tests indicated significant differences between sites, means were compared with the post hoc Tukey’s HSD tests. The free statistical software, Estimate S version 8.2 for Windows was used for the estimation of species diversity (Colwell, 2009)
5441 RESULTS
Species composition and richness: Tree species composition and richness (abundance) at the level of family and species at study sites are indicated in Table 1
below. In all, 1453 trees representing 88 species, 78 genera and 30 families were identified.
Table1: Tree species (dbh ≥ 10 cm) enumerated at the three sampling sites
Family Species
Study sites
RA (%) NFE ME NSE
Anarcadiaceae Lannea acida A. Rich. √ √ 1.51
Lannea welwitschii (Hiern) Engl. √ √ 0.21
Spondias mombin L. √ 0.34
Annonaceae Anonna senegalensis Pers. √ √ 2.13
Apocynaceae Holarrhena floribunda (G.Don.) Dur.& Schinz √ √ 0.83
Rauvolfia vomitoria Afz. √ 1.10
Araliaceae Cussonia barteri Seem. √ √ 1.17
Arecaceae Borassus aethiopum Mart. √ √ 2.62
Elaeis guineensis Jacq. √ √ √ 2.20
Bignoniaceae Kigelia africana (Lam.) Benth. √ √ 0.62
Margaritaria discoides (Baill) Webster √ √ 0.34
Markhamia lutea (Benth.) K.Schum. √ 0.48
Newbouldia laevis P. Beauv. √ 0.55
Spathodea campanulata P. Beauv. √ 0.55
Bombacaceae Adansonia digitata L. √ √ 3.30
Bombax buonopozense Beauv. √ √ √ 0.83
Ceiba pentandra (L.) Gaertn. √ √ 1.45
Celastraceae Maytenus senegalensis (Lam.) Exell. √ 0.41
Chrysobalanaceae Parinari curatellifolia Planch. ex Benth. √ √ 0.96
Combretaceae Anogeissus leiocarpus (DC.) Guill. & Perr. √ √ 2.48
Combretum racemosum P. Beauv. √ √ 1.31
Terminalia avicennioides Guill. & Perott. √ √ 0.89
Terminalia glaucescens Planch. Ex Benth. √ √ 0.69
Terminalia superba Engl. et Diels. √ 0.21
Compositae Vernonia colorata (Willd.) Drake √ 0.21
Ebenaceae Diospyros heudelotii Hiern. √ 0.14
Diospyros mespiliformis Hochst. ex A.DC. √ 0.48
Euphorbiaceae Alchornea cordifolia Muell. Arg. √ √ 2.96
Bridelia ferruginea Benth. √ √ 1.51
Drypetes floribunda (Müll.Arg.) Hutch. √ 0.28
Phyllanthus discoideus (Bail) Wild √ 0.22
Securinega virosa √ 0.69
Fabaceae Albizia adianthifolia Schum. √ √ 0.96
Albizia zygia MacBride √ √ 2.68
Lonchocarpus sericeus Kunth. √ √ 0.89
Parkia biglobosa (Jacq.) Benth. √ √ 2.34
Parkia clappertoniana Keay √ √ 1.86
Pterocarpus erinaceus Poir. √ 0.96
Gentianaceae Anthocleista vogelii Planch. √ √ 1.86
Hypericaceae Harungana madagascariensis Lam. ex Poir. √ 0.89
Leguminosae Acacia albida Del. √ √ 3.30
Afzelia africana Sm. ex Pers. √ √ √ 3.23
5442
Cassia sieberiana DC. √ 0.55
Daniellia oliveri (Rolfe) Hutch. & Dalz. √ 1.24
Detarium microcarpum Guill. & Perr. √ 1.24
Dialium dinklagei Harms. √ √ 1.24
Erythrophleum guineense G. Don √ 1.10
Isoberlinia doka Craib. & Stapf. √ √ 0.96
Millettia thonningii (Schum. et Thonn.) Bak. √ 0.34 Piliostigma thonningii (Schumach.) Milne-Redh. √ √ 0.96
Swartzia madagascariensis Desv. √ 0.14
Tamarindus indica L. √ √ 0.89
Lepidobotryaceae Musanga cecropioides R. Br. √ 1.10
Meliaceae Azadirachta indica A. Juss. √ √ √ 2.88
Carapa procera DC. √ 0.74
Khaya grandifolia (Desr.) A. Juss. √ √ 0.69
Khaya senegalensis (Desr.) A. Juss. √ √ 1.45
Pseudocedrela kotschyi Harms. √ 0.23
Trichilia monadelpha (Thonn.) J. De Wilde √ 0.83
Moraceae Antiaris toxicaria Engl. √ √ 3.72
Bosquiea angolensis Ficalho √ √ 0.76
Ficus exasperata Vahl. √ √ 1.65
Ficus sur Forssk. √ √ 0.55
Milicia excelsa (Welw.) Benth. √ 0.34
Ochnaceae Lophira alata Banks ex. C.F. Gaertn. √ 0.55
Lophira lanceolata Tiegh. √ √ 1.31
Palmae Raphia hookeri Mann & Wendl. √ √ 1.58
Papilionaceae Baphia nitida Lodd. √ √ 0.89
Rubiaceae Crossopteryx febrifuga (Afzel. ex G. Don.) Benth.
√ √ 1.31
Gardenia ternifolia Schum, & Thonn. √ 0.89
Mitragyna inermis (Willd.) O. Ktze √ 0.28
Morinda lucida Benth. √ √ 1.45
Nauclea latifolia Sm. √ 0.62
Sapindaceae Allophylus africanus P.Beauv. √ √ 2.68
Lecaniodiscus cupanioides Planch ex.Benth √ √ 0.62
Sapotaceae Pachystela sp. √ 0.48
Malacantha alnifolia (Bak.) Pierre √ √ 0.76
Vitellaria paradoxum C.F. Gaertn. √ √ 3.17
Sterculiaceae Cola cordifolia (Cav.) R.Br. √ √ 0.83
Cola gigantea A. Chev. √ √ 1.38
Hildegardia barteri (Mast.) Kosterm √ √ 0.83
Nesogordonia papaverifera R. Capuron √ 0.34
Sterculia tragacantha Lindl. √ 0.55
Triplochiton scleroxylon K. Schum. √ 0.34
Tiliaceae Grewia mollis Juss. √ 0.89
Ulmaceae Trema orientalis (L.) Blume √ 0.28
Verbanaceae Vitex doniana Sweet √ 0.28
Figure 2 indicates the species accumulation curve of sites, which is the cumulative number of species recorded as a measure of sampling effort. It again shows that most
species present at study sites were included in samples because the curves each approach an asymptote.
5443
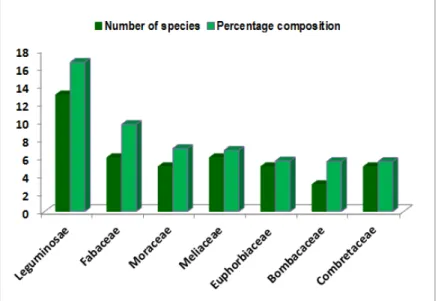
Figure 2: Species accumulation curves for tree species at study sites as a function of sampling effort Figure 3 indicates families with at least 5% composition in
the tree community. Members of the Leguminosae (subfamily Papilionoideae, Mimosoideae and Caesalpinioideae) were the most dominant, comprising
13 species and constituted nearly 17 percent of the trees population. The next dominant family was the Fabaceae, which comprised 6 species and accounted for 9.7 percent of the trees encountered.
Figure 3: Families with at least 5% composition in tree vegetation The two legume families collectively comprised more than
one-fourth (26.34 percent) of the entire trees sampled. Other families substantially represented in the vegetation are the Moraceae, Meliaceae, Euphorbiaceae, Bombacaceae and the Combretaceae. Collectively, they comprised 30.62 percent of ecotone trees. Table 3A
shows the first 20 tree species that occurred in large numbers and their relative abundances. Collectively, they constituted 49.66% of the total tree population. Of this species savanna trees were more abundant comprising 60.39% compared to forest and intermediate species with
only 39.61% composition
5444
Table 3 A: The first 20 most abundant tree species identified in samples
Species % Relative abundance Native habitat
Antiaris toxicaria 3.72 forest
Acacia albida 3.30 savanna
Adansonia digitata 3.30 savanna
Afzelia africana 3.23 savanna
Vitellaria paradoxum 3.17 savanna
Alchornea cordifolia 2.96 intermediate
Azadirachta indica 2.88 savanna
Albizia zygia 2.68 forest
Allophylus africanus 2.68 savanna
Borassus aethiopum 2.62 savanna
Anogeissus leiocarpus 2.48 savanna
Parkia biglobosa 2.34 savanna
Elaeis guineensis 2.20 intermediate
Anonna senegalensis 2.13 savanna
Parkia clappertoniana 1.86 savanna
Anthocleista vogelii 1.86 forest
Ficus exasperata 1.65 forest
Raphia hookeri 1.58 forest
Bridelia ferruginea 1.51 savanna
Lannea acida 1.51 savanna
The five most abundant species of the vegetation were Antiaris toxicaria (bark cloth tree), Adansonia digitata (baobab), Acacia albida (ana tree), Afzelia africana and Vitellaria paradoxum (shea-butter tree). With the exception of Antiaris toxicaria, which is of forest origin, all others are characteristic of savanna ecosystems (Lawson, 1986; Hawthorne, 1990). On the other hand, species such as Burkea africana, Daniellia oliveri, Terminalia glaucescens and Vitex doniana previously identified by Hopkins (1974) as common ecotone species, however were rarely found. Indeed, such previously
dominants like Hymenocardia acida, Parinari polyandra and Pterocarpus erinaceus were not listed at all in this study.
Spatial distribution of tree species: Table 3B is a summary list of floristic and structural composition of trees identified at study sites. In both NSE and ME sites, 22 families each were listed while 18 families were in NFE. These comprised 43 genera in NFE, 45 in ME and 48 in NSE. Moraceae, Meliaceae and Euphorbiaceae were dominant in NFE and ME while the Leguminosae and Combretaceae dominated in NSE site.
Table 3B: Composition, diversity and structure of trees ≥ 10 cm dbh at study sites
Characteristics NFE ME NSE Total
No. of families 18 22 22 30
No. of genera 43 45 48 79
No. of species 43 52 48 88
Species native of forest 27 23 12 -
Species native of savanna No. of intermediate species
14 2 27 2 34 1 - - Total individuals 343 536 574 1453
Mean tree density (ha-1) 127 ±15 131 ± 23 164 ± 12 -
5445 Fewer trees were listed in NFE (343 individuals or 23.61%) compared to NSE (574 individuals or 39.50%) and ME (536 individuals or 36.89%). Overall, trees typical of the savanna dominated the ecotone (53.75% or 781 individuals) compared to those of forest origin (32.29% or 478 individuals). While number of savanna species was increasing in the direction of the guinea savanna vegetation (NSE had 41.16% or 226 individuals; ME had 34. 28% or 196 individuals and NFE had 14.67% or 51 individuals) forest species were reducing (2.44% or 14 individuals in NSE, 13.25% or 71 individuals in ME and a high of 72.01% or 247 individuals in NFE). Shannon’s diversity ranged from 3.02 ± 0.12 to 3.39 ± 0.23 and was observed to be highest in the NSE, followed by the ME and the least in the NFE. Mean tree density ranged from 127 ±15 to 164 ±12 and was highest in the NSE, followed by the ME and the least in the NFE.
Statistical analyses: Structural characteristics of trees, based on number, species diversity and density per hectare were tested for differences between the three sites. There was a significant difference in number of
trees between sites (Kruskall–Wallis Test, χ2 = 6.07, P <
0.001). Significant differences were established between NFE and NSE (Wilcoxon rank-sum test, P < 0.05) and between NFE and ME (Wilcoxon rank-sum test, P < 0.001). However, between NSE and ME, no significant difference was established (Wilcoxon rank-sum test, P = 0.65). In addition, significant differences were found in tree density between study sites (Kruskall–Wallis Test χ2;
P < 0.05) with a significant difference existing between NFE and NSE (Tukey HSD, P < 0.05) and also between NSE and ME (Tukey HSD, P < 0.05). However, between NFE and ME, no significant difference was established (Tukey HSD, P = 0.12). Shannon species diversity varied significantly between the sites (Kruskall–Wallis Test χ2 P
< 0.001). Post hoc Tukey’s HSD test showed no significant difference between NFE and ME (Tukey HSD, P= 0.61). However, between NSE and NFE, a significant difference was established (P < 0.001) and between NSE and ME (P < 0.000).
DISCUSSION
Species composition and richness: The study identified the Leguminosae, Moraceae, Meliaceae and Fabaceae as the most represented families in the tree vegetation of the study area. Other also substantially represented were the Euphorbiaceae, Bombacaceae and Combretaceae. This observation is in close agreement with the findings of Asase and Oteng-Yeboah (2007) and Asase et al. (2009) that the Leguminosae and Combretaceae were dominant tree families in guinea savanna vegetation. Lawson (1986) also listed most of these families among those identified as common in the forest vegetation of West Africa. However, Euphorbiaceae and Bombacaceae, though found among the common families in this study, were not reported in earlier studies. The study also found that leguminous trees (belonging to the Leguminosae and Fabaceae) such as Acacia albida, Afzelia africana, Albizia zygia and Parkia spp. were abundant in the ecotone. Elsewhere, Felker and Bandurski (1979) and Felker (1980) had attributed the abundance of leguminous trees to their role in maintaining nitrogen balance of agro-ecosystems for which reason they are protected and managed on farms. The most abundant species of the vegetation were Antiaris toxicaria (3.72%), Adansonia digitata (3.3%), Acacia albida (3.3%) and Afzelia africana (3.23%). Most of these trees are of nutritional and economic significance and interviewees in local communities explained that they protected such trees from damage and even sometimes
cultivated them for sustenance. This observation concurs with that of Yaro (2008) when he opined that economic trees like Vitellaria paradoxum and Parkia biglobosa are managed by local people in order to serve their livelihood needs. Species such as Alchornea cordifolia and Azardiracta indica were also found in substantial numbers probably because of their medicinal utility (Mante et al. 2012). Another conclusive observation was that savanna trees were preponderant in the vegetation than forest members. This probably could relate to the characteristic ability of most savanna trees to tolerate or resist fire damage and drought or regenerate quickly after a disturbance in fire-dominated vegetation (Orwa et al., 2009; Kone et al., 2012).
Spatial distribution of trees across ecotone: Spatial variations in plant density and diversity occur from complex interactions based on local ecological conditions, among other factors (Barnett and Kohn, 1991). In this study tree density varied spatially across the ecotone, ranging from127 ±15 to 164± 12, though lower than estimations from other ecosystems. For example, Asase and Tetteh (2010) recorded a mean tree density per hectare (for trees ≥ 10 cm diameter at breast height) of 470 in a natural forest, 90 in cocoa agroforests and 125 in mixed food crops agroforests. Assessing trees ≥ 20 cm girth at breast height, Attua (2003) also reported mean tree density per hectare of 231.81 and 55.92 in undisturbed rainforest and matured fallows respectively.
5446 Compared to the undisturbed or natural forests, tree density of the ecotone is low, though much higher than in cocoa and mixed food crops agroforests and matured fallows. In human-influenced ecosystems, differences in tree density could arise from differences in management intensity, culture and farm history (Schroth and Harvey 2007) and fire management practices (Higgins et al., 2000). It is worthy of mention however, that sometimes a decline in tree density is inherent in management strategies for long-term cultivation to attain appropriate tree-crop combinations and for high crop production, and not necessarily implying degradation (Kalacska et al., 2004). In many tropical biomes, fire is responsible for the denudation of tree cover and reduction of stand tree density (Hoffmann et al., 2012). Forest trees and juveniles compared to savanna species are more
susceptible to top kill than their savanna counterparts due to their much thinner bark of the former (Hoffmann et al., 2009). In addition, some savanna trees may have a suite of ecological traits that make them better adapted in fire-impacted environments and so increase in numbers (Hoffmann et al., 2009; Gotsch et al., 2010). There is no consensus, however, on the role of human affects density of economic tree species in particular and land management in general (Eriksen, 2007). While some studies affirm that anthropogenic disturbances, particularly burning, increases tree species richness (e.g. Kennard, 2002; Gould et al., 2002) other views are contrary (King et al., 1997; Kalacska et al., 2004). Future work may have to quantitatively decipher what roles humans and other ecological factors play in the spatial distribution of trees in the ecotone.
CONCLUSION
The study concludes that tree population of the northern forest-savanna ecotone is presently dominated by the Leguminosae, Fabaceae, Moraceae, Meliaceae and Euphorbiaceae families. The existing flora, to a large degree, is dominated by savanna species, particularly those associated with guinea savanna vegetation. Nonetheless, distribution of trees is non-uniform across the ecotone and varies significantly between sites in relation to density, diversity and richness. Differences in fire frequency and expansion of cultivation could be the
key ecological factors of tree distribution in the ecotone though not established in this study. Future studies may have to forecast the trajectory of vegetation change while isolating environmental factors that are responsible for the observed differences in composition, diversity and distribution of tree species in the ecotone. The usefulness of data generated through this work is in its application for managing forest-savanna conversion to forest through fire-protection and re-afforestation programmes in Ghana.
ACKNOWLEDGEMENT
We are most grateful to the Department for International Development (DFID) for funding the study as part of a collaborative Project between University of Ghana and Overseas Development Institute (ODI) under its Natural Resource Systems Programme (NRSP Project R7957). We are also thankful to all community members who
volunteered parcels of land for the study and Mr. J. Y. Amponsah of the Department of Botany, University of Ghana for helping in plant identification. The views expressed here are not necessarily those of either ODI or DFID but those of the authors.
REFERENCES
Addo-Fordjour PS, Obeng, AK, Anning K, Addo, M G, 2009. Floristic composition, structure and natural regeneration in a moist semi-deciduous forest following anthropogenic disturbances and plant invasion. Int. J. Biodiversity Conservation, 1(2):021–037.
Afrikorah-Danquah, S, 1997. Local Resource Management in the Forest-Savanna Transition Zone: The Case of Wenchi District, Ghana, IDS Bulletin: Vol 28 No 4, 36 – 46.
Amanor, K. S and Pabi, O (2007). Space, Time, Rhetoric and Agricultural Change in the Transition Zone of Ghana, Human Ecology, 35: 51-67.
Asase A, Oteng-Yebeoah AA, 2007. Assessment of plant biodiversity in the Wechiau community Hippopotamus Sanctuary in Ghana, Journal of the Botanical Research Institute of Texas 1:549–556.
Asase A, Patrick K E, John YA, 2009. Floristic composition, abundance and distribution pattern of woody plants in a tropical savanna in Northern Ghana. Journal of the Botanical Research Institute of Texas, 3:309–316. Asase A, Tetteh DA, 2010. The role of complex
agroforestry systems in the conservation of forest tree diversity and structure in
5447 southeastern Ghana, Agroforestry Systems, 79:355–368.
Attua EM, 2003. Land cover change impacts on the abundance and composition of flora in the Densu Basin, West African Journal of Applied Ecology.4:27-34.
Barnett SC, Kohn JR, 1991. Genetic and evolutionary consequences of small population size in plants. In: Falk, D. A.; Holsinger, K. E., eds. Genetic and Conservation of Rare Plants, New York; Oxford University Press, 283 pp.
Colwell RK, 2009. EstimateS: Statistical estimation of species richness and shared species from samples, version 8.2 for Windows. Persistent URL http://purl.oclc.org/estimates.
Crawley MJ, 2007. The R book. Wiley, New York, 942 pp. Eriksen C, 2007. Why do they burn the ‘bush’? Fire, rural livelihoods, and conservation in Zambia. The Geographical Journal, 173 (3), 242-256. Fairhead J, Leach M, 1996. Enriching the Landscape:
Social history and the management of transition ecology in the forest-savanna Mosaic of the Republic of Guinea, Journal of the International African Institute, Africa, 66 (1): 14-36.
Felker P, Bandurski R, 1979. Uses and potential uses of leguminous trees for minimal energy input agriculture. Economic Botany, 33:172-184. Felker P, 1980. Uses of Tree Legumes in Semi-Arid
Regions. “Legumes” Symposia Paper, Society for the Economic Botany, Bloomington, Illinois. Gotsch SG, Geiger EL, Franco AC, Goldstein G, Meinzer FC, Hoffmann WA, 2010. Allocation to leaf area and sapwood area affects water relations of co-occurring savanna and forest trees. Oecologia, 163: 291- 301.
Hawthorne W, 1990. Field Guide to the Forest Trees of Ghana. Chatham: Natural Resource Institute, for the Overseas Development Administration, London. Ghana Forestry Series 1, 278 pp. Higgins SI, Bond WJ, Trollope WS, 2000. Fire,
resprouting and variability: a recipe for tree-grass coexistence in savanna. Journal of Ecology, 88: 213-229.
Hoffmann WA, Adasme R, Haridasan M, Carvalho M, Geiger EL, Pereira MAB, 2009. Tree topkill, not mortality, governs the dynamics of alternate stable states at savanna-forest boundaries under frequent fire in central Brazil, Ecology, 90: 1326–1337.
Hoffmann WA, Geiger EL, Gotsch SG, Rossatto DR, Silva LCR, Lau OL, Haridasan M, Franco AC,
2012. Ecological thresholds at the savanna-forest boundary: how plant traits, resources and fire govern the distribution of tropical biomes, Ecology Letters, 15: 759 – 768.
Hopkins B, 1974. Forest and Savanna: An Introduction to Tropical Terrestrial Ecology with special reference to West Africa, Heinemann Educational Books Ltd., London, 154 pp. Hutchinson J, Dalziel JM, Keay RWJ, Hepper FN,
1957-1972. Flora of West Tropical Africa. 2nd edition. Vol. I-II, The Whitefriars Press, London. International Plant Nomenclature Index, IPNI, 2008.
International plant nomenclature index. Published on the internet http://www.ipni.org [Accessed 12 August 2012].
Kalacska M, Sanchez-Azofeifa GA, Calvo-Alvarado JC, Quesada M, Rivard B, Janzen DH, 2004. Species composition, similarity and diversity in three successional stages of a seasonally dry tropical forest. Forest Ecology and Management, 200: 227-247.
Kennard DK, 2002. Secondary forest succession in a tropical dry forest: patterns of development across a 50-year chronosequence in Bolivia. Journal of Tropical Ecology, 18: 53-66.
King J, Moutsinga, JB, Doufoulon G, 1997. Conversion of anthropogenic savanna to production forest through fire-protection of the forest–savanna edge in Gabon, Central Africa, Forest Ecology and Management, 94: 233–247. Kone WM, Azokou A, Bakayoko A, Tra Bi FH, 2012. Preliminary study of polysaccharides and certain secondary metabolites of medicinal plants used in Cote d’Ivoire for wound healing, Research Journal of Medicinal Plant, 6 (3): 214-224. Lawson, G. W (1986). Plant Life in West Africa. Ghana
University Press, Accra.
Lykke MA, 1998. Assessment of species composition change in savanna vegetation by means of woody plants’ size class distributions and local information. Biodiversity and Conservation 7: 1261-1275.
Magurran AE, 2004. Measuring biological diversity. Blackwell Science Ltd., UK, 215 pp.
Mante PK, Adongo DW, Kukuia KKE, Ameyaw EO, Woode E, 2012. Medicinal plants in Ghana, American Journal of Pharmacology and Toxicology, 7 (4), 123-134.
Nangendo G, Steege H, Bongers F, 2006. Composition of woody species in a dynamic forest-woodland-savannah mosaic in Uganda: implications for
5448 conservation and management. Biodiversity and Conservation, 15: 1467-1495.
Orwa C, Mutua A, Kindt R, Jamnadass R, Simons A, 2009. Agroforestree Database: a tree reference and selection guide version 4.0 (http://www.worldagroforestry.org/af/treedb/) Pabi O, Attua EM, 2005. Spatio-temporal differentiation
of land-use/cover changes and natural resources management. Bulletin of the Ghana Geographical Association, 24: 90-102. Pickett STA, White PS, 1985. The theory of natural
disturbance and patch dynamics. Academic Press Inc., New York, NY.
Schroth G, Harvey CA, 2007. Biodiversity conservation in cocoa production landscapes: an overview. Biodiversity and Conservation, 16:2237–2244. Smith TB, Wayne RK, Girman DJ, Bruford MW, 1997. A
role for ecotones in generating rainforest biodiversity. Science, 276: 1855 – 1857. Swaine MD, Hall JB, 1988. The mosaic theory of forest
regeneration and the determination of forest composition in Ghana, J. Tropical Ecology, 4: 253-269.
Taylor CJ, 1952. The Vegetation Zones of the Gold Coast, Forestry Department Bulletin No. 4, Government Printer, Accra.
Tom-Dery D, Boakye P, Asante WJ, 2012. Woody species richness and abundance in a tropical savanna of Northern Ghana. Journal of the Botanical Research Institute of Texas, 6(1): 131-141.
Turner MG, 1987. Landscape heterogeneity and disturbance. Springer-Verlag, New York. Uhi C, 1987. Factors controlling succession following
slash-and-burn agriculture in Amazonia. Journal of Ecology, 75: 377-407.
UNEP, 2008. Africa: Atlas of our changing environment, UNEP, Nairobi, Kenya.
Van der Geest K, 2011. North-South migration in Ghana: What role for the environment? International Migration, 49 (1): 69-94.
Yaro JA, 2008. An examination of theories on savannasation and the peasant-environment debate. West Africa Journal of Applied Ecology, 13:3–16.
Zschekel W, Afful F, Agyepong A, 1997. Baseline survey on farming systems in the Brong Ahafo Region carried out in the three districts of Sunyani, Asunafo and Atebubu by GTZ (SFSP)/MOFA, Sunyani, Ghana.