UNIVERSITÉ DE MONTRÉAL
PLASMA ACTUATION FOR BOUNDARY LAYER SEPARATION CONTROL IN ENGINE DUCTS
XIAOFEI XU
DÉPARTEMENT DE GÉNIE MÉCANIQUE ÉCOLE POLYTECHNIQUE DE MONTRÉAL
THÈSE PRÉSENTÉE EN VUE DE L’OBTENTION DU DIPLÔME DE PHILOSOPHIÆ DOCTOR (Ph.D.)
(GÉNIE MÉCANIQUE) DÉCEMBRE 2011
UNIVERSITÉ DE MONTRÉAL
ÉCOLE POLYTECHNIQUE DE MONTRÉAL
Cette thèse intitulée:
PLASMA ACTUATION FOR BOUNDARY LAYER SEPARATION CONTROL IN ENGINE DUCTS
présentée par: XU, Xiaofei
en vue de l’obtention du diplôme de: Philosophiæ Doctor a été dûment acceptée par le jury d’examen constitué de:
M. VÉTEL, Jérôme, Ph.D., président
M. VO, Huu Duc, Ph.D., membre et directeur de recherche
M. MUREITHI, Njuki, Ph.D., membre et codirecteur de recherche M. ZHANG, Xuefeng, Ph.D., membre et codirecteur de recherche M. TRÉPANIER, Jean-Yves, Ph.D., membre
Dedication
Acknowledgements
The work reported in this thesis was performed in collaboration with the National Research Council Gas Turbine Laboratory (NRC GTL) in Ottawa, as a part of the research project “Application of Plasma Actuation-Based Flow Control Technology Strategies for Gas Turbines”. Their generous financial support is highly appreciated.
During the course of my doctoral study, I have received continuous guidance and support from my supervisors Professor Huu Duc Vo, Professor Njuki Mureithi and Dr. George Zhang. I have also received considerable help from the members of the Wind Tunnel Laboratory at École Polytechnique de Montréal and the NRC Gas Turbine Laboratory.
I am very pleased to acknowledge the assistance with the computational resources from Mr. Omar Toukal, and the help from Mr. Sebastien Lemire for providing the body force field and mapping it onto the CFD mesh. I am also particularly grateful to Mr. Philippe Versailles for providing the test data for plasma actuation in quiescent air. The assistance from Mr. Shinya Ueno and Mr. Kenny Huynh with the preliminary experimental setup at École Polytechnique de Montréal is gratefully acknowledged.
The work at NRC GTL would have been impossible without the outstanding work of Dr. Ali Mahallati and Mr. Paul Hunt on the 2-D experimental setup, and Mr. Bob McLaughlin for building the new plasma actuation system. The great help of Dr. Shuzhen Hu and Dr. Yanfeng Zhang in the work on inter-turbine ducts (ITDs) is also highly appreciated.
I reserve my deepest gratitude to my wife Minxuan Wang. Without her continuous support and love this work would not have been successfully completed.
Résumé
Le décollement de la couche limite turbulente est un problème important pour une multitude d'applications, notamment pour les conduits en forme de S comme des entrées d’air non axiales de moteurs d’avion et les conduits de transition entre les turbines (ITD) de ces moteurs. Le décollement de la couche limite turbulente dans les entrées d’air non axiales provoque une distorsion de l’écoulement entrant dans le moteur d’avion, ce qui détériore la performance du moteur et diminue la durée de vie de ses composantes. D’autre part, la conception du ITD est susceptible de devenir plus agressive (ITD plus court) pour répondre à des exigences de poids, de consommation de carburant et environnementales pour les nouveaux moteurs d'avion. Un design plus agressif peut mener au décollement de la couche limite turbulente causant des pertes de pression. Pour empêcher une réduction conséquente de la performance du moteur, ce design nécessiterait l'application de techniques de contrôle de l’écoulement. Diverses techniques ont été étudiées pour le contrôle du décollement de la couche limite, dont les générateurs de vortex, des jets générateurs de vortex, et des jets synthétiques. L'avènement récent des actionneurs plasma, aussi connus sous le nom de Dielectric Barrier Discharge (DBD) peut potentiellement fournir une méthode alternative plus efficace et robuste. Les actionneurs plasma convertissent l’électricité directement en quantité de mouvement du fluide. Comparés à d'autres techniques de contrôle de l’écoulement, ces actionneurs électriques dépourvus de pièces mobiles ont un temps de réponse rapide et sont simples, potentiellement robustes et faciles à intégrer et ne perturbent pas l’écoulement lorsque non utilisés (presque ou sans intrusion dans l’écoulement), ce qui les rend idéaux pour les applications aérodynamiques.
Le présent travail évalue l’efficacité du concept d’actionnement plasma pour supprimer le décollement de la couche limite turbulente dans des conduits en forme de S. Premièrement, des études numériques et expérimentales sur le contrôle du décollement de la couche limite turbulente par actionnement plasma sont effectuées sur des diffuseurs génériques 2-D, représentant des modèles simplifiés de conduits 3-D en forme de S. Les trouvailles des travaux
numériques et expérimentales sont similaires. Les résultats montrent que l’actionnement plasma peut réduire ou même supprimer le décollement de la couche limite turbulente dans les deux modes d’opération, soient en mode continu et en mode pulsé. L'efficacité du contrôle (en termes de rendement en pression) augmentent avec la force d’actionnement. L'emplacement optimal de l’actionneur est généralement proche et en amont du point de séparation de la couche limite. En mode pulsé, la fréquence optimale de pulsation correspond à une fréquence adimensionnelle (basée sur la vitesse de l’écoulement principal et la longueur de décollement de la couche limité) de l'ordre de 1 et est égale (en dedans de la résolution de mesure) à la fréquence dominante de l’écoulement dans la couche limite turbulente non actionnée. Ce résultat signifie que l’actionnement pulsé fonctionne par la résonance des structures turbulentes dominantes augmentant ainsi le taux de mélange et par conséquent le transfert de quantité de mouvement entre l’écoulement à haute vitesse plus loin de la surface et l’écoulement à basse vitesse près de la surface. La réduction du décollement de la couche limite turbulente augmente avec le facteur de cycle (pourcentage du cycle pulsé où l’actionneur est allumé). Cependant, pour un rendement optimal en termes d’efficacité versus puissance consommée, le facteur de cycle doit être choisi entre 10% et 50%. En outre, l’actionnement en mode pulsé à la fréquence de pulsation optimale est plus efficace qu’en mode continu pour une puissance consommée similaire.
Guidé par les résultats des études sur les diffuseurs génériques 2-D, des études numériques et expérimentales sont effectuées sur une conduite ITD pour démonter l’efficacité des actionneurs plasma pour contrôler le décollement de la couche limite turbulente dans une conduite 3-D en forme de S, du moins en mode continu. Les tendances en termes de l’influence de la position de l’actionneur et de la force d’actionnement sur l’efficacité (mesurée par la réduction de la perte de pression associée au décollement de la couche limite turbulente) sont consistantes avec celles des études de diffuseurs 2-D. De plus, des règles de design préliminaires empiriques pour actionnement plasma en mode continu obtenues avec les données de simulations numériques de diffuseurs génériques 2-D ont réussi à donner une prédiction approximative et
conservative de la force d’actionnement requise pour la suppression du décollement de la couche limite dans le ITD.
Abstract
Turbulent boundary layer separation is an important problem for a variety of applications, including S-shaped aircraft engine intakes and inter-turbine ducts (ITDs). Turbulent boundary layer separation in the engine intakes causes inlet flow distortion, resulting in deteriorated engine performance and reduced engine component life. The design of ITDs is likely to become more aggressive in response to requirements for lighter, more efficient and environment-friendly aircraft engines. Such aggressive ITDs would likely suffer large pressure losses due to turbulent boundary layer separation leading to reduced engine performance, and therefore require the application of flow control techniques. Various flow control techniques have been studied to control turbulent boundary layer separation, such as vortex generators, vortex generator jets and synthetic jets. The recent advent of dielectric barrier discharge (DBD) plasma actuators can potentially provide a more effective and robust alternative. Plasma actuators convert electricity directly into flow momentum near the surface through partial ionization of air. Compared to other flow control techniques, these electrical solid-state actuators have fast response time and are simple, potentially robust and easy to integrate and non-intrusive (low to zero protrusion), which make them ideal for aerodynamic applications.
The present work studies the effectiveness of DBD plasma actuators in the suppression of turbulent boundary layer separation in S-shaped engine ducts. First, numerical and experimental studies on the control of turbulent boundary layer separation by plasma actuation are carried out in 2-D generic diffusers, as simplified models of 3-D S-shaped engine ducts. The findings from both CFD simulations and experiments are similar. Results show that plasma actuation can reduce and even suppress turbulent boundary layer separation in both continuous and pulsed modes. The effectiveness of the actuation (in terms of pressure recovery) increases with the actuator strength. The optimal actuator location is generally close to and upstream of the boundary layer separation point. In the pulsed mode, the optimal pulsing frequency corresponds to a dimensionless frequency (based on freestream velocity and separation length) on the order of
1 and is equal to (within measurement resolution) the dominant frequency in the non-actuated turbulent boundary layer. This implies that the pulsed actuation works through resonance of dominant turbulence flow structures and improves flow mixing and momentum transfer from outer high-momentum flow to near-surface low-momentum flow. The actuation effectiveness increases with duty cycle. However, for optimal efficiency in terms of effectiveness versus power consumption in pulsed actuation, the duty cycle should be chosen between 10% and 50%. In addition, pulsed actuation at the optimal frequency is more effective than continuous actuation for similar power consumption.
With the results from 2-D diffusers as a general guide, numerical and experimental studies are conducted on an annular inter-turbine duct (ITD) to demonstrate the effectiveness of plasma actuation in controlling turbulent boundary layer separation in 3-D S-ducts in continuous actuation mode. The trends in terms of the influence of actuator location and strength on effectiveness (reduction of total pressure loss from boundary layer separation) are consistent with those from the 2-D diffusers studies. Moreover, empirical design rules for continuous plasma actuation, obtained from data collapse of computational simulations in 2-D generic diffusers, successfully provide a conservative prediction of the required actuator strength for reduction of turbulent boundary layer separation in the ITD.
Contents
Dedication ... iii Acknowledgements ... iv Résumé ... v Abstract ... viii Contents ... xList of Figures ... xii
List of Tables ... xx
List of Appendices ... xxi
Chapter 1 Introduction ... 1
Chapter 2 Literature Review ... 8
2.1 Flow Distortion in Serpentine Ducts ... 8
2.2 Flow Control ... 12
2.3 Plasma Actuation ... 20
Chapter 3 Methodology ... 30
3.1 Numerical/Analytical Study... 30
3.1.1 Computational Tool Setup and Integration of Actuation Model ... 30
3.1.2 Conceptual Study on Generic Diffusers ... 33
3.1.3 Establishment of Design Rules ... 36
3.2 Experimental Study ... 39
3.2.1 Experimental Apparatus ... 39
3.2.2 DBD Plasma Actuators ... 48
3.2.3 Experiments ... 49
3.2.4 Data Reduction and Presentation ... 49
3.3 Application to Real Design ... 51
4.1 Validation of Computational Tool ... 56
4.2 Numerical Assessment of Boundary Layer Separation Control Concept ... 64
4.2.1 Effect of Actuator Location ... 65
4.2.2 Effect of Actuator Strength ... 68
4.2.3 Effect of Duty Cycle ... 70
4.2.4 Effect of Pulsed Actuation Frequency ... 72
4.2.5 Effect of Power Consumption ... 74
4.3 Determination of Design Rules ... 78
4.4 Summary ... 88
Chapter 5 Experimental Study on Separation Control in 2-D Diffusers ... 89
5.1 Dielectric Barrier Discharge Plasma Actuators ... 89
5.1.1 DBD Plasma Actuator Design ... 89
5.1.2 Characteristics of Plasma Actuators Selected for Flow Control ... 94
5.2 Boundary Layer Separation in Non-Actuated Diffuser ... 100
5.3 Flow Control with Plasma Actuators ... 102
5.3.1 Effect of Actuator Strength ... 102
5.3.2 Effect of Pulsed Actuation Frequency ...110
5.3.3 Effect of Duty Cycle ...118
5.4 POD Analysis ... 121
5.5 Summary ... 127
Chapter 6 Separation Control in S-shaped Ducts ... 128
6.1 Boundary Layer Development in ITD Ducts ... 128
6.2 Flow Control with Plasma Actuators in ITD Ducts ... 135
Chapter 7 Conclusions and Recommendations ... 142
References ... 145
List of Figures
Figure 1.1: S-shaped intake and the total-pressure distortion at the engine face ... 2
Figure 1.2: A schematic of diffusing serpentine duct ... 3
Figure 1.3: Vortex development in a serpentine duct (Sullivan et al., 1982) ... 3
Figure 1.4: Typical ITD region in a turbofan engine (Hu et al., 2011) ... 4
Figure 1.5: A schematic representation of plasma actuator ... 5
Figure 2.1: Total-pressure contours along the center-plane of an inlet (Brear et al., 2004) ... 10
Figure 2.2: Classifications of different flow control strategies ... 13
Figure 2.3: Configurations of fences and vortex generators (Sullerey et al., 2002) ... 15
Figure 2.4: An illustration of vortex generator jet (VGJ) and definition of VGJ angles (Pradeep and Sullerey, 2006) ... 16
Figure 2.5: Schematic of (a) ZNMF jet actuator and (b) induced flow by ZNMF jets (Smith and Glezer, 1998) ... 17
Figure 2.6: Instantaneous streamwise velocity (white line: zero) for periodic forcing (a) and without forcing (b) (Herbst and Henningson, 2006) ... 19
Figure 2.7: Induced flow in quiescent air by DBD (Enloe et al., 2004) ... 20
Figure 2.8: Time evolution of voltage, current, induced axial and normal velocity above the actuator (Forte et al., 2007)... 21
Figure 2.9: An illustration of pulsed actuation... 23
Figure 2.10: Subdivision of the domain over the covered electrode into N volume (Lemire and Vo, 2011) ... 25
Figure 2.11: Different plasma actuator configurations (Rizzetta et al., 2008) ... 27
Figure 2.12: Schematic of the test section side view (Hultgren and Ashpis, 2003) ... 28
Figure 2.13: Streamlines above a hump model, showing effects of plasma actuator on suppressing turbulent separation (He, 2007) ... 29
Figure 3.1: Time-averaged force distribution of plasma actuator for implementation into CFX . 32
Figure 3.2: Simulated diffuser with moderate adverse pressure gradient ... 34
Figure 3.3: Simulated diffuser with high adverse pressure gradient ... 34
Figure 3.4: Configuration of plasma actuation in different modes ... 35
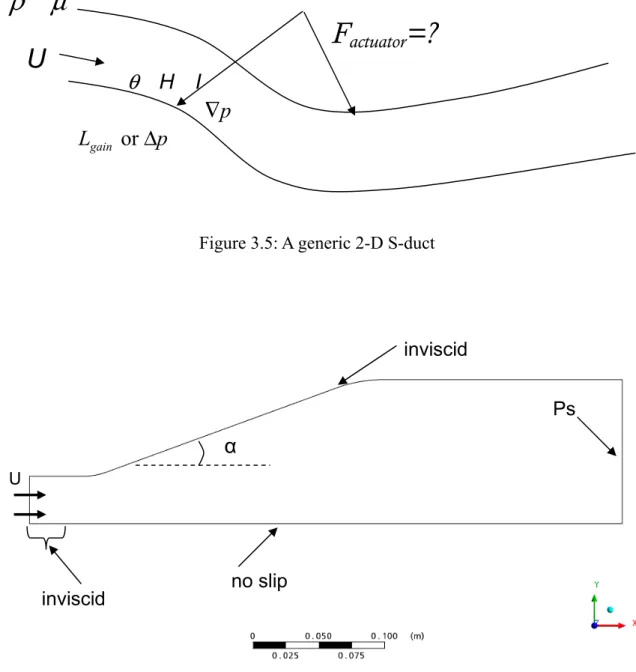
Figure 3.5: A generic 2-D S-duct ... 37
Figure 3.6: Generic geometry for CFX simulations to determine actuation requirements ... 37
Figure 3.7: Experimental setup at NRC GTL ... 40
Figure 3.8: Configuration of low speed wind tunnel at NRC GTL ... 41
Figure 3.9: Configuration of plasma actuator implementation ... 43
Figure 3.10: Experimental setup of plasma actuator implementation ... 43
Figure 3.11: Experimental setup of Pitot tube ... 44
Figure 3.12: Setup for PIV measurement ... 47
Figure 3.13: An illustration of phase-locked measurement ... 47
Figure 3.14: Annular test rig with changeable ITD test section (Hu et al., 2011) ... 54
Figure 3.15: Measurement locations and actuator locations in experiments ... 54
Figure 3.16: Plasma actuators on ITD casing (viewed from ITD exit) ... 55
Figure 3.17: ITD with an upstream vane in CFD simulations ... 55
Figure 4.1: Geometry and mesh of a planar diffuser (10 deg, length of diffuser = 21H) ... 57
Figure 4.2: Axial velocity profiles at x/H=24 for CFX and FLUENT simulations vs. experiment (DalBello et al., 2005) ... 58
Figure 4.3: Separation streamlines for CFX and FLUNET simulations vs. DalBello et al.’s simulation (SST turbulence model) ... 58
Figure 4.4: Geometry and mesh of a diffuser with transition ... 59
Figure 4.5: Mesh for simulating mixing layer instability ... 61
Figure 4.6: Instantaneous fields showing geometrically-similar large structure: (a) instantaneous vorticity field in the present work, (b) colour-schlieren image (Slessor et al., 1998) ... 61 Figure 4.7: Instantaneous vorticity fields for plasma actuator in quiescent air (a) PIV measurement,
(b) CFD simulation ... 62
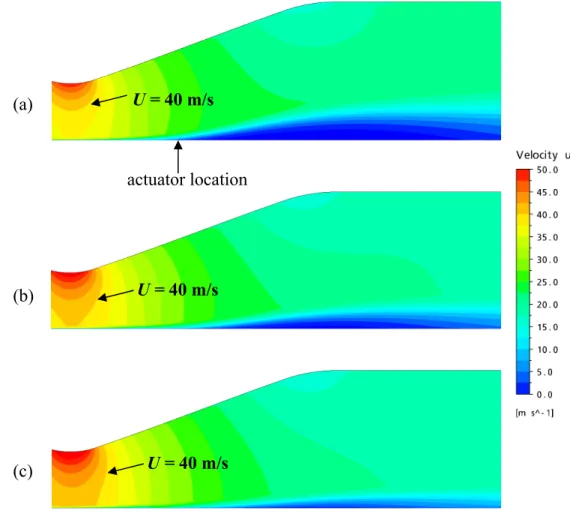
Figure 4.8: Instantaneous velocity fields with pulsed plasma actuation at 108 mN/m, 40 Hz, duty cycle of 40% for several selected phases ... 63
Figure 4.9: Contour of time-averaged axial velocity and axial wall shear stress along the plate without actuation with indicated monitor points ... 66
Figure 4.10: Effect of actuator location ... 67
Figure 4.11: Effect of actuator strength ... 69
Figure 4.12: Contours of time-averaged axial velocity with continuous actuation at 180 mm: (a) 90 mN/m, (b) 240 mN/m, (c) 390 mN/m ... 70
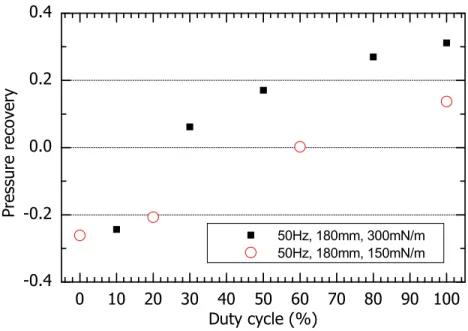
Figure 4.13: Effect of duty cycle in pulsed mode at 180 mm, 50 Hz ... 71
Figure 4.14: Time evolution of axial velocities with actuation for different duty cycles (x = 180 mm, 300 mN/m, 50 Hz) at monitor point 1 ... 72
Figure 4.15: Effect of actuation frequency in pulsed mode at 160 mm, 300 mN/m, 30% duty cycle ... 73
Figure 4.16: Time-averaged turbulent kinetic energy distribution in the plane of monitor point 1 for different actuation frequencies (x = 160 mm, 300 mN/m, 30% duty cycle) ... 74
Figure 4.17: Effect of power consumption ... 75
Figure 4.18: Effect of duty cycle in pulsed mode at 180 mm, 50 Hz ... 76
Figure 4.19: Time evolution of axial velocities at monitor point 1 with actuation at 180 mm, 50 Hz. ... 77
Figure 4.20: Boundary layers with and without actuation ... 80
Figure 4.21: Prediction of termⅠa in Equation (4.7) ... 83
Figure 4.22: Prediction of termⅠb in Equation (4.7) ... 84
Figure 4.23: Prediction of term Ⅲ in Equation (4.7) ... 84
Figure 4.24: Prediction of term Ⅳ in Equation (4.7) ... 85
Figure 4.25: Prediction of final equation (left hand side versus right hand side of Equation (4.7)) ... 86
Figure 4.26: 2-D planar diffuser ... 87
Figure 4.27: Comparison of pressure distributions in different ways (left- pressure distribution; right- pressure difference between inviscid simulation and 1-D calculation) ... 87
Figure 5.1: Chosen plasma actuator configuration ... 92
Figure 5.2: Plasma actuator operated in filamentary mode ... 93
Figure 5.3: Teflon damage due to arc formation ... 93
Figure 5.4: Measured thrust versus peak-to-peak voltage for final plasma actuator configuration ... 95
Figure 5.5: Contour of axial velocity for different modulation frequencies at 52.7 kVpp, 40%: (a) 15.63 Hz, (b) 40 Hz, (c) 100 Hz, (d) 250 Hz ... 96
Figure 5.6: Contour of axial velocity for different duty cycles at 52.7 kVpp, 40 Hz: (a) 20%, (b) 40%, (c) 60% ... 97
Figure 5.7: Modulation frequency effect on thrust and power (Teflon plate, 47.2 kVpp, 2 kHz, duty cycle 50%) ... 98
Figure 5.8: Duty cycle effect on thrust and power (Teflon plate, 47.2 kVpp, 100 Hz/2 kHz) ... 99
Figure 5.9: Flow effect on power consumption (Plexiglas plate, HV covered connection, 2.5 kHz, 100%) ... 100
Figure 5.10: An illustration of windows for PIV measurement ... 102
Figure 5.11: Contours of time-averaged axial velocity without actuation (refer to the highlighted window in Figure 5.10) ... 103
Figure 5.12: Time-averaged static pressure distribution along the flat plate without and with continuous actuation ... 103
Figure 5.13: Spectral analysis of axial velocities without actuation from hot-wire measurement at three points: (a) shear layer region near separation (point 1), (b) edge of shear layer (point 2), (c) core flow (point 3) ... 104
Figure 5.14: Pressure recovery with different actuator strengths ... 106 Figure 5.15: Time-averaged flow field with different actuator strengths: (a) 39.7 kVpp, (b) 47.1
kVpp, (c) 52.7 kVpp ... 107
Figure 5.16: Time-averaged boundary layer shape factor H for the cases with continuous actuation ... 108
Figure 5.17: Comparison of power consumption for continuous and pulsed actuation ... 109
Figure 5.18: Time-averaged flow field with Teflon plasma actuator at 68.4 kVpp, 100% ... 109
Figure 5.19: Pressure recovery with different actuator frequencies at 40% duty cycle...112
Figure 5.20: Instantaneous flow fields with pulsed actuation at 40 Hz, 47.1 kVpp, 40% ...114
Figure 5.21: Instantaneous flow fields with pulsed actuation at 15.63 Hz, 47.1 kVpp, 40% ...115
Figure 5.22: Instantaneous flow fields with pulsed actuation at 200 Hz, 47.1 kVpp, 40% ...116
Figure 5.23: x-t diagram of phase-locked unsteady boundary layer shape factor H for the case with actuation at 40 Hz, 40% ...117
Figure 5.24: x-t diagram of phase-locked unsteady boundary layer shape factor H for the case with actuation at 15 Hz, 40% ...117
Figure 5.25: x-t diagram of phase-locked unsteady boundary layer shape factor H for the case with actuation at 200 Hz, 40% ...118
Figure 5.26: Pressure recovery versus different duty cycles for pulsed actuation at 40 Hz ...119
Figure 5.27: x-t diagram of phase-locked unsteady boundary layer shape factor H for the case with actuation at 20%, 52.7 kVpp ... 120
Figure 5.28: x-t diagram of phase-locked unsteady boundary layer shape factor H for the case with actuation at 60%, 52.7 kVpp ... 120
Figure 5.29: Topos of velocity for the case without actuation (contours of axial velocity and streamlines) ... 123
Figure 5.30: Chronos of velocity for the case without actuation ... 124
Figure 5.31: Topos of velocity for cases with continuous actuation at 47.1 kVpp ... 125
Figure 5.32: Topos of velocity for cases with pulsed actuation at 47.1 kVpp, 40%, 40 Hz ... 126
Figure 5.33: Energy distribution for different cases ... 127
Figure 6.2: Flow visualization and simulated wall shear stress on ITD casing without actuation
... 132
Figure 6.3: Development of measured total pressure coefficients along the duct without actuation ... 133
Figure 6.4: Development of simulated total pressure coefficients along the duct without actuation ... 134
Figure 6.5: Flow visualization and simulated wall shear stress on ITD casing with actuation .. 138
Figure 6.6: Effect of plasma actuator location (as normalized axial location) on ITD total pressure loss ... 139
Figure 6.7: Effect of actuator strength on ITD total pressure loss for plasma actuator at optimal location in Figure 6.6 ... 139
Figure 6.8: Contour of simulated wall shear stress on ITD casing with actuation ... 140
Figure 6.9: Simulated total pressure coefficients at ITD outlet with actuation ... 141
Figure A.1: Contour of TKE for laminar separation case without actuation ... 154
Figure A.2: Contours of time-averaged TKE for different cases in laminar separation control (vertical extent expanded by a factor of two) ... 155
Figure A.3: Time-averaged axial wall shear for different cases in laminar separation control .. 156
Figure A.4: Contour of time-averaged axial velocity without actuation with indicated monitor points ... 158
Figure A.5: Time-averaged axial wall shear stress along the plate in Figure A.4 without actuation ... 159
Figure A.6: Time evolution of normal velocities at monitor points: (a) point 1 (separated shear layer region), (b) point 3 (turbulent separation region) ... 159
Figure A.7: Spectral analysis of normal velocities without actuation at two monitor points: (a) separated shear layer region (point 1), (b) turbulent separation region (point 3) ... 161 Figure A.8: Contours of time-averaged axial velocity with actuation: (a) LSP, co-flow, continuous (case L1), (b) LSP, co-flow, 100 Hz (case L2), (c) LSP, co-flow, 400 Hz (case L4), (d) TRP,
co-flow, continuous (case T1) ... 162
Figure A.9: Contours of instantaneous axial velocity with actuation: (a) LSP, co-flow, 100 Hz (case L2), (b) LSP, co-flow, 400 Hz (case L4), (c) TRP, co-flow, 100 Hz (case T3), (d) LSP, counter-flow, 100 Hz (case L6) ... 163
Figure A.10: Time-averaged axial wall shear stress for cases with actuation: (a) at the LSP, (b) at the TRP ... 165
Figure A.11: Time evolution of axial velocities with actuation at two monitor points: (a) separated shear layer region (point 1), (b) turbulent separation region (point 3) ... 167
Figure A.12: Spectral analysis of axial velocities with actuation: (a) LSP, co-flow, 100 Hz, (case L2), (b) LSP, co-flow, 400 Hz (case L4), (c) TRP, co-flow, 100 Hz (case T3), (d) TRP, co-flow, 400 Hz (case T5) ... 168
Figure C.1: A schematic representation of plasma generation system ... 183
Figure C.2: Plasma generation system ... 184
Figure C.3: LabView interface for signal generation ... 184
Figure C.4: Power amplifier connection ... 185
Figure C.5: Resistor module ... 186
Figure C.6: Transformers ... 187
Figure C.7: Main components of plasma generation system ... 188
Figure C.8: LabView interface for data acquisition ... 190
Figure C.9: Force/thrust measurement ... 190
Figure D.1: Different waveform shapes ... 193
Figure D.2: Exposed electrodes with different shapes ... 193
Figure D.3: Foil-type exposed electrode with different insulation ... 194
Figure D.4: Bi-electrode versus tri-electrode configurations ... 194
Figure D.5: Effect of dielectric material ... 195
Figure D.6: Contour of axial velocity with Teflon sheet and HV exposed electrode for different voltages ... 197
Figure D.7: Profile of axial velocity with Teflon sheet and HV exposed electrode for different
location ... 198
Figure D.8: Maximum induced axial velocity with Teflon sheet and HV exposed electrode for different voltages (x = 15 mm, y = 1 mm) ... 199
Figure D.9: Thrust versus power for various waveforms ... 200
Figure D.10: Electrical measurement for various waveforms at 2.5 kHz ... 201
Figure D.11: Thrust versus power for various AC frequencies ... 203
Figure D.12: Thrust versus peak-to-peak voltage for various AC frequencies ... 203
Figure D.13: Voltage measurement for various frequencies with square waveform ... 204
Figure D.14: Thrust versus RMS voltage for the effect of insulated exposed electrode ... 205
Figure D.15: Thrust versus power for the effect of insulated exposed electrode ... 205
Figure D.16: Plasma for the serrated and straight exposed electrodes (negative sawtooth) ... 208
Figure D.17: Thrust versus power for the effect of exposed electrode shape ... 209
Figure D.18: Thrust versus RMS voltage for the effect of exposed electrode shape ... 209
Figure D.19: Thrust versus RMS voltage for wire-type exposed electrode...211
Figure D.20: Thrust versus power for wire-type exposed electrode ...211
Figure D.21: Electrical measurement for the actuators with wire-type electrode at 2 kHz ... 212
Figure D.22: Plasma for wire-type exposed electrode with a diameter of 0.025 mm ... 213
Figure D.23: Thrust versus RMS voltage (negative sawtooth) for tri-electrode configuration .. 215
Figure D.24: Thrust versus RMS voltage for tri-electrode configuration... 216
Figure D.25: Thrust versus power for tri-electrode configuration ... 216
Figure D.26: AC power versus RMS voltage for tri-electrode configuration ... 217
List of Tables
Table 1: Comparison of transition location ... 60
Table 2: Characteristics of various dielectric materials ... 90
Table 3: Simulation cases for laminar separation control ... 153
Table 4: Pressure recovery for different cases with laminar/turbulent separation ... 160
Table 5: Cables and Connectors ... 191
Table 6: Transformer Leads ... 191
List of Appendices
Appendix A: Preliminary Numerical Results ... 153
Appendix B: Preliminary Experiment Tests and Results ... 170
Appendix C: Plasma Generation System ... 183
Appendix D: Parametric Study on DBD Plasma Actuators ... 192
Chapter 1
Introduction
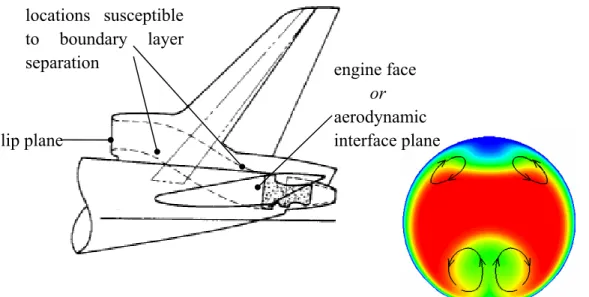
An air intake (engine inlet) on an aircraft is a passage or duct for the ambient air entering the aircraft engine. For an ideal intake, the flow properties, e.g., total pressure, should be uniformly distributed at the engine entrance face, or aerodynamic interface plane (AIP). However, this situation never happens in a real engine intake. The variation of total pressure across the engine face is named total pressure distortion. This is the most significant among inlet distortions (engine face flow distortions). The reduced velocity in the distorted region of the engine face is detrimental to engine performance and causes undesirable fluctuating forces on the turbomachinery blades as they pass in and out of this region, which may lead to fatigue and shortened engine component life. Moreover, the inlet distortion reduces the stall margin of the fan and compressor and can result in engine surge, a flow instability characterized by flow oscillation across the engine. This results in thrust drop and may cause damage to the engine. There are numerous sources of inlet distortion, among which are (Seddon and Goldsmith, 1999; Anderson et al., 1994): 1) flow separation at the cowl lip at high flow ratio (ratio of velocity at lip plane to freestream velocity V Vl/ ∞> ), 2) shock-induced boundary layer separation on1 the compression surfaces, 3) ingestion of vortices either from upstream disturbances or due to cross-wind flow separation from intake side-plates, 4) secondary flow and possibly flow separation within the inlet duct itself, either from the curvature of inside wall bends or from high diffusion rates.
Aircraft design considerations, such as in the case of turboprops and helicopters, can force the use of non-axial S-shaped engine inlets. The benefits of S-shaped inlets include: 1) conveying the air to engine buried in the fuselage, where axial air suction is not feasible, 2) reducing the overall engine length, thus the weight of engine and aircraft, as a result of ultra-compact, highly offset duct, with a specific area ratio D2/D1 (in Figure 1.2), 3) concealing the compressor face
and providing a multiple bounce cavity for reducing radar signature (Wellborn et al., 1994).
Figure 1.1: S-shaped intake and the total-pressure distortion at the engine face
A typical diffusing serpentine duct, as shown in Figure 1.2, has a curved centerline, two bends and a cross-sectional area increase (D2>D1). The curvature of the bends and the cross-sectional area change lead to streamline curvature. The cross-stream pressure gradient, resulting from the streamline curvature, leads to cross-stream flow. The cross-stream flow develops along the duct, and eventually a pair of counter-rotating vortices arises, as shown in Figure 1.3. A similar situation happens for the second bend, with a smaller counter-rotating vortex pair. These two sets of counter-rotating vortex pairs at the engine face, originating, respectively, near the insides of the two bends, are shown in Figure 1.1. In addition, adverse streamwise pressure gradient, as a result of the increased cross-sectional area (diffusing duct), can induce flow separation. This can accelerate the formation of vortex pairs, because the secondary flow is relatively stronger in the separation region. The formation of counter-rotating vortex pairs with streamwise flow separation in a diffusing S-duct was demonstrated in the experiment of Wellborn et al. (1994). The secondary flow and possibly flow separation within the diffusing S-shaped inlet duct, is the primary source of flow distortion.
locations susceptible to boundary layer
separation engine face
or aerodynamic interface plane lip plane
Figure 1.2: A schematic of diffusing serpentine duct
Figure 1.3: Vortex development in a serpentine duct (Sullivan et al., 1982)
Another S-shaped duct generally used in aircraft engines is the inter-turbine duct (ITD), which is located between the high-pressure turbine (HPT) and low-pressure turbine (LPT), as shown in Figure 1.4. The ITD is a key gas turbine component for keeping the overall engine weight and fuel consumption low. The design of ITDs is likely to become more aggressive with the demands for lighter, more efficient and environment-friendly aircraft engines. Such aggressive inter-turbine ducts (AITD) could have shorter axial length and/or larger HP-to-LP radial offset, which will reduce the hot-end cost, size and weight. Compared to S-shaped intake
ducts, the ITDs are annular diffusers. These aggressive ITDs may suffer large pressure losses due to turbulent boundary layer separation leading to reduced engine performance, and therefore require the application of flow control techniques.
Figure 1.4: Typical ITD region in a turbofan engine (Hu et al., 2011)
Various flow control techniques have been applied on the S-shaped ducts for performance improvement, such as vortex generator jets (VGJs) and zero-net-mass-flow (ZNMF) jets. VGJs require an air supply system, likely taken from engine bleed, and associated pipes and valves, which imply penalty in engine performance and in weight. ZNMF jets require a system with oscillating mechanical parts that may limit the robustness of the actuator under operational conditions. Moreover, there is a risk of clogging of the orifices, especially if small actuators are used to minimize actuation power and response time.
Compared to these relatively complex actuators, the recent advent of dielectric barrier discharge (DBD) plasma actuators can potentially provide a non-intrusive and robust method for suppressing inlet distortion in engine intakes and flow separation in ITDs. A plasma actuator consists of two electrodes, as shown in Figure 1.5, one exposed to the air and the other hidden
beneath a layer of dielectric material. When the electrodes are subjected to a sufficiently high amplitude AC voltage, the air above the hidden electrode partially ionizes. In the presence of the electric field, this results in a flow acceleration (momentum addition to the flow) near the surface. More information on plasma actuators can be found in Enloe et al. (2004), Forte et al. (2007) and Roth et al. (2006).
Figure 1.5: A schematic representation of plasma actuator
The relative low-power consumption, simplicity, non-intrusion and potential robustness of these new actuators make them ideal for aerodynamics applications. Several applications have been proposed in recent years in external flow, such as increasing lift on airfoils (Orlov et al., 2007; Patel et al., 2008) and vortex control on delta wings (Visbal and Gaitonde, 2006). However, applications of plasma actuation in more challenging internal aerodynamics are just beginning. The new concept proposed in this project is among the first such application and consists of using plasma actuators to increase flow momentum at strategic locations to suppress boundary layer separation in engine ducts. The actuator can be used in continuous or pulsed mode. In the latter mode, the pulsing frequency can be chosen to amplify turbulent flow structures in the boundary layer to improve momentum transfer from the outer high-velocity fluid and thus suppress separation with minimal power input. This project is done in collaboration with the National Research Council Gas Turbine Laboratory (NRC GTL) in Ottawa.
electrodes
plasma
induced flow acceleration air
dielectric material
Research Question
How can one achieve optimal suppression of separation in engine ducts by the use of plasma actuation? In other words, how to choose actuator parameters, e.g., actuator position, strength and mode (continuous or pulsed), such that the separation in a given engine duct can be suppressed by plasma actuators with minimal power input?
Objectives
1) Assess and demonstrate boundary layer control technology using plasma actuators to significantly reduce flow distortion from turbulent boundary layer separation in engine ducts
2) Develop and validate design rules for implementing plasma actuators in engine ducts
Chapter 2 presents a review of the previous literature, which focuses on three topics. The first is the flow distortion within S-shaped engine ducts. The second discusses various flow control techniques and associated examples for boundary layer separation suppression and flow control in S-shaped ducts. The last section deals with the mechanism and the application of plasma actuation.
Chapter 3 presents the chosen methodology which consists of three phases: 1) conceptual study on separation control in 2-D generic diffusers by numerical simulations, 2) experimental study on separation control in 2-D generic diffusers, and 3) the application of plasma actuators in a 3-D S-shaped duct. The detailed research procedures are also included.
Numerical study on separation control in 2-D diffusers is presented in Chapter 4. First, a computational tool with integration of a plasma actuator model is validated. Second, the effects of plasma actuation, in different modes, on the control of boundary layer separations in 2-D diffusers are demonstrated. Third, a preliminary design rule for the continuous plasma actuation
on turbulent boundary layer separation control is developed and discussed.
Following the numerical study, the corresponding experimental study on the boundary layer separation control in 2-D diffusers is carried out and the results are presented in Chapter 5. Prior to this, a parametric study on DBD plasma actuators is conducted in order to optimize them for flow control.
In Chapter 6, plasma actuators are applied to a realistic S-shaped ITD duct in order to suppress the boundary layer separation within it and thus improve duct performance.
Finally, the conclusions of the current study and suggestions for the future work are presented in Chapter 7.
Chapter 2
Literature Review
2.1 Flow Distortion in Serpentine Ducts
Inlet distortion (e.g., total pressure distortion) always happens in a realistic engine intake as introduced in Chapter 1. The main cause of inlet distortion in a serpentine (S-shaped) duct, a commonly used intake geometry, is the secondary flow and possibly flow separation within the inlet duct itself, either from the curvature of inside wall bends or from high diffusion rates.
Singh et al. (2008) investigated numerically the influence of the entry shape on the performance of diffusing S-ducts. With the same circular S-duct exit, various entry shapes, including square, rectangle, oval, ellipse and semi-circle, were investigated. The entry area for different shapes was the same, and an area ratio of exit area to entry area was always AR = 2. The chosen turbulence model was the RNG k− , which had been validated by experiments. ε Cross-flow distribution at the duct exit showed the presence of two pairs of counter-rotating vortices, one being smaller. As for the shape effect, oval and elliptical entry section gave better performance whereas square entry section had relatively worse performance, based on the comparison of distortion coefficient and swirl coefficient.
Berrier and Allan (2004) conducted experimental and computational evaluations of flush-mounted, boundary layer ingesting (BLI) S-duct inlets. In this evaluation, a large range of Mach numbers (0.25-0.83) and Reynolds numbers (up to realistic operating conditions) were considered. Increased free-stream Mach number was generally detrimental to BLI S-duct inlet performance (pressure recovery and inlet distortion), with the losses at high subsonic speeds dominated by duct curvature. However, increased Reynolds number had a negligible effect on inlet distortion but increased inlet pressure recovery. As for the numerical prediction, CFD, with k− shear stress transport (SST) turbulence model, was able to capture the pressure recovery ω
and distortion trends with increasing Mach number and inlet mass flow, while the CFD results generally predicted larger losses than experimental measurements.
Brear et al. (2004) examined the flow separation effect within the engine inlet of an UCAV (Unmanned Combat Air Vehicle). The performance of the inlet strongly depended on the flow separation within the inlet, as shown in Figure 2.1. The time-averaged structure and unsteadiness of this separation were also studied. The separation accompanied by unsteady structures, caused both a reduction in inlet pressure recovery and an increase in inlet unsteadiness (e.g., total pressure fluctuation). Finally, separation flow control should be applied in S-shaped ducts, because inlet size reduction and Mach number increase led to stronger adverse pressure gradient and thus stronger separation, which eventually led to poorer inlet performance.
The above review is on flow development in S-shaped engine intake ducts. Flow development in annular ITDs is discussed next. Compared to intake ducts, the flow in ITDs on normal operation has rotational-periodic structures and influence from complex upstream flow conditions such as blade wakes and swirl. Some fundamental work has been conducted to investigate the influence of non-rotating wakes (Dominy and Kirkham, 1996) and swirl (Dominy and Kirkham, 1995) on the performance of inter-turbine diffusers through flow measurements within an annular cascade test rig. Dominy et al. (1998) discussed data from experiments with and without upstream swirl vanes and compared them with computational results. Although the blade wakes and swirl did not result in large changes in overall loss, the experimental data showed that the secondary flow structures and the distribution of losses within the duct were significantly modified by the wakes and swirl. Subsequently, Norris and Dominy (1997) experimentally and numerically compared the diffusion of two ITD geometries with the same exit-to-entry area ratio of 1.5 but different lengths. The wake intensity was found to have little effect on the freestream flow. However, for the 30% shorter duct, both numerical and experimental results showed a 10% decrease in static pressure recovery.
Figure 2.1: Total-pressure contours along the center-plane of an inlet (Brear et al., 2004)
To generate more realistic turbine inlet conditions, a large scale low-speed facility with an HPT stage upstream of the ITD was examined by Arroyo et al. (2006). Using this facility, Axelsson et al. (2007) and Axelsson and Johansson (2008) experimentally investigated the flow features in the ITD, with the installation of an LPT vane downstream of the ITD to simulate real exit boundary conditions. The time-averaged results demonstrated the development of vortex structures along the ITD. Two co-rotating vortices were formed near the casing and started to pair together upon reaching the LPT vanes.
Marn et al. (2007) and Göttlich et al. (2007) experimentally investigated the influence of the upstream rotor tip gap size on the performance of an aggressive ITD in a transonic turbine test facility. An unsteady numerical investigation of the above AITD was then performed by Sanz et al. (2009). It was observed that CFD simulations could capture the influence of changes in tip clearance on flow field behavior. From both experimental and numerical investigations, no separation was detected in this duct. The results also showed that the tip leakage flow had a significant beneficial effect on the static pressure recovery. Although the tip leakage flow only
AIP
affected the outer 20% of the duct span, it brought a very different flow field to the downstream section of the duct. Marn et al. (2009) later experimentally and numerically investigated the effect of tip clearance size on the flow development in a highly-aggressive ITD, which was 20% shorter than the one presented in Marn et al. (2007). Oil flow visualizations showed massive separation along the casing.
Shorter, more compact, more offset S-shaped inlets and ITDs result in larger flow separation, higher flow unsteadiness, and thus decreased duct pressure recovery and higher flow distortion, which cause a deterioration in the performance of the propulsion system. Therefore, to utilize the aggressive geometry of S-shaped engine ducts with an acceptable performance, flow control techniques are needed. Flow control is discussed in the next section.
2.2 Flow Control
Flow control involves employing passive or active devices to change the characteristics of a naturally developed flow field, e.g., wall-bounded and free-shear flows, to a new desired state (Gad-el-Hak, 2000). The goals of flow control include laminar-turbulent transition delay or advancement, suppression of boundary layer separation, lift increase, drag reduction, noise reduction, flow-induced vibration damping, etc.
The classifications based on different criteria are many. Two obvious categories are passive and active flow controls as shown in Figure 2.2. Passive flow control involves a fixed modification to the flow field, requiring no auxiliary power, such as the shaping of the bodies, addition of riblets and vortex generators. In contrast, active flow control requires energy input to modify the flow, such as blowing, suction, acoustic actuation, magneto-hydrodynamic and electro-hydrodynamic actuations. Active flow control can further be divided into predetermined and reactive flow controls. Predetermined flow control is the application of control devices regardless of the specific flow state, while reactive control, i.e., feedforward or feedback looped, strongly depends on the current flow field information, obtained by various sensors.
Predetermined active flow control can be divided into steady and unsteady regimes. In the steady regime, energy is added to the flowfield to obtain a beneficial result, such as separation suppression and laminar-turbulent transition advancement. The amount of energy input is strongly dependent on the energy or momentum deficit in the flow. For example, the suppression of larger and stronger turbulent boundary layer separation would require higher external energy input.
Figure 2.2: Classifications of different flow control strategies
In contrast, unsteady flow control, widely researched since the 1990s, is primarily based on suppressing or amplifying the instabilities present in the flow, such as Tollmien-Schlichting waves in laminar-turbulent transition and instabilities in mixing layers. As for the suppression of turbulent boundary layer separation, unsteady control mode with an actuation frequency related to a natural frequency in the flow can be used to enhance mixing between the higher momentum fluid in the outer region and the lower momentum fluid near the wall. The energy consumption for unsteady flow control is relatively small compared to that for steady flow control. Efficient unsteady flow control relies on the identification and understanding of the instabilities in the flow. These instabilities can be classified as convective or absolute based on the linear response of the system to an initial localized impulse (Huerre and Monkewitz, 1990). A flow is convectively unstable, if its response to an initial impulse at any fixed location decays in time, or if all growing disturbances convect downstream from their source. Suppression of convective instabilities is especially effective when applied near the source point. On the other hand, the flow is absolutely unstable, if the local response to an initial impulse grows in time. Absolute
Passive Flow control Active Predetermined Reactive Feedforward Feedback Steady Unsteady
instabilities are generally more dangerous and more difficult to control. However, absolute instabilities are more easily amplified as needed in some flow control cases.
In the control of turbulent flow, such as wall-bounded or free-shear layers, coherent structures naturally present in this flow should be understood and utilized. However, there are no universal coherent structures. For example, organized motions in wakes are different from those in boundary layers (Gad-el-Hak, 2000). The coherent structures in free-shear flows are generally easier to detect and identify than those in the wall-bounded flow. This difference can also be shown by the characteristic length scales in these flows: one in the free-shear flow versus at least two (e.g., in outer and inner layers) in the wall-bounded flow. Issues about the origin of the different structures in the shear layer, the inner-outer layer interaction, regeneration mechanism and Reynolds number effects remain unresolved to date.
While a large amount of literature exists on flow control techniques and applications, only a few will be discussed, mainly pertaining to boundary layer separation control and flow control in the S-shaped ducts.
Sullerey et al. (2002) studied the effect of various fences and vortex generator configurations (Figure 2.3) in reducing distortion and improving total pressure recovery in 2D diffusing S-ducts. To obtain the best performance, the fence height was chosen as 120 percent of the boundary layer thickness without flow control, while the height of vortex generator was 50 percent. The vortex generators were fixed in such a way that the vortices shed by the vortex generators opposed the naturally occurring secondary flows and thus aiding in control of secondary flow losses. It was observed that the performance of these two techniques depended on the centerline curvature or radius ratio (ratio of centerline radius of curvature to half duct height). The fences performed better when used in diffusing ducts of greater radius ratio while tapered-fin vortex generators performed better in diffusing ducts of smaller radius ratio.
(a) fences
(b) vortex generator
Figure 2.3: Configurations of fences and vortex generators (Sullerey et al., 2002) front view top view top/bottom wall fences
top/bottom wall fences (side view)
Figure 2.4: An illustration of vortex generator jet (VGJ) and definition of VGJ angles (Pradeep and Sullerey, 2006)
Pradeep and Sullerey (2006) later investigated the performance enhancement of 3D diffusing S-ducts (circular and rectangular-to-circular transitioning) by secondary flow and separation control using vortex generator jets (VGJs), as shown in Figure 2.4. In the active separation control, both steady VGJs and VGJs with feedback control were tried, with feedback control further improving the effectiveness of VGJs. Besides, the active control type was shown to be significantly more effective than tapered fin vortex generators in Figure 2.3(b) (passive flow control). Moreover, an attempt was made to explain the physical mechanism of VGJs in secondary flow and separation control. The larger the size of the vortex, the better would be the
Connecting tube Air supply
from blower Block
Nozzle Flow distributor
Wall Jet Jet orifice Direction of secondary flow Jet orifice Jet centerline Projection of jet centerline on the wall
Freestream direction Pitch angle
control and thus more mixing of the low momentum boundary layer fluid with the high momentum freestream fluid. It was observed that the vortices generated when the VGJs were oriented at 135 deg skew angle have sizes greater than those at other orientations.
Figure 2.5: Schematic of (a) ZNMF jet actuator and (b) induced flow by ZNMF jets (Smith and Glezer, 1998)
Separation control using zero-net-mass-flow (ZNMF) jets in diffusing S-ducts was studied by Mathis et al. (2008). To generate ZNMF jets, the devices should contain three elements: a cavity, a slot and a pressure fluctuation generator, as shown in Figure 2.5(a). The cavity pressure fluctuations are generated by an oscillating piezoelectric element, which is driven by an electric AC signal. Consequently, velocity oscillations and vortices (see Figure 2.5(b)) are formed at the exit slot. With the ZNMF jets, the momentum is transferred from the actuator to the fluid without net mass injection, which is similar to plasma actuator (the main difference is actuation direction, i.e., non-tangential to wall for ZNMF jets versus tangential to wall for plasma actuators). One important parameter is actuation frequency or strouhal number St = fD/Uj,rms, where Uj,rms is the rms velocity and D is the diameter of the ZNMF jet. A stability analysis of the wall normal base flow at the location of the applied control was presented and the most effective actuation frequency was estimated, corresponding to the most spatially unstable mode in the original flow.
With this actuation frequency and the jet located close to the time-averaged separation point, only a very low energy input was necessary to suppress the separation in the duct with high degree of curvature.
Cierpka et al. (2007) investigated the electromagnetic control of separated flows above a stalled plate using periodic excitation with different frequencies, amplitudes and wave forms. In the electromagnetic control, the fluid is electrically conducting and the momentum addition can be achieved by electromagnetic (Lorentz) force. The Lorentz force appears as a body force on the flow. This situation is similar to the mechanism of DBD plasma actuators, where the electric force imposes the mass fluxes (no mass injection). The optimal frequency was found to correspond to the dimensionless frequency F+ =O(1), a widely recognized value for the stalled airfoil control, based on chord length and freestream speed. As for the effect of wave form, the rectangular wave form generated the smallest separation bubble compared to sinusoidal and triangular wave forms.
The influence of periodic excitation on a turbulent separation bubble was studied by Herbst and Henningson (2006), using direct numerical simulations (DNS). The excitation was generated by an oscillating body force perpendicular to the surface, similar to ZNMF jets above. In this work, the influence of forcing position, forcing amplitude and forcing frequency was considered. To effectively control the turbulent separation, the excitation position should be near the separation point, as the critical point, and the dimensionless frequency, based on free-stream velocity and mean reattachment length without forcing, should be F+ ≈O(1). Relatively high amplitudes (above a threshold) were necessary in order to prevent separation. Figure 2.6 shows the instantaneous streamwise velocity for periodic forcing with optimal parameters. To understand why low frequencies were necessary to eliminate separation by time periodic forcing, a linear stability analysis was performed. From the analysis, only low frequency modes were unstable, corresponding to wavelength of the order of the bubble length, and also indicating a possibility of a global instability of the turbulent separation bubble.
Figure 2.6: Instantaneous streamwise velocity (white line: zero) for periodic forcing (a) and without forcing (b) (Herbst and Henningson, 2006)
Various flow control regimes and techniques have been introduced in the above review. Effective suppression of boundary layer separation by unsteady/pulsed actuation requires that the actuation location be near the separation point and actuation frequency be related to some natural frequency of the uncontrolled flow. To suppress the secondary flow in S-shaped ducts, the vortex generated by actuators should oppose the natural secondary flow.
2.3 Plasma Actuation
Applications of weakly ionized plasmas in propulsion and aerodynamics are a group of emerging technologies. In weakly ionized plasmas, the ionization fraction of gas molecules ranges from 10−8 to 10−2 (Macheret, 2008). Plasma-based actuation is generally based on the
following mechanisms (Shin et al., 2007): 1) thermal effect, which is rapid gas heating resulting from the Joule dissipation, such as through direct-current (DC) filamentary discharges, 2) non-thermal effect, which comes as magneto-hydrodynamic (MHD) or electro-hydrodynamic (EHD) forcing to accelerate or decelerate the gas in the flow, such as through DC glow discharges and single dielectric barrier discharge (DBD), as shown in Figure 2.7.
Figure 2.7: Induced flow in quiescent air by DBD (Enloe et al., 2004)
The DBD plasma actuator is a pretty simple and potentially robust device without moving parts that can effectively induce laminar-turbulent transition, suppress and/or delay boundary layer separation. A typical DBD plasma actuator, as illustrated in Figure 1.5, consists of two electrodes arranged asymmetrically, one exposed to the air and the other hidden beneath a layer of dielectric material. When the electrodes are subjected to a sufficiently high amplitude AC voltage (~1-10 kVpp) at high frequency (~1-10 kHz), the air above the hidden electrode partially ionizes. In the presence of the electric field, this results in a flow acceleration (momentum
addition to the flow) near the surface. The time evolution of AC voltage, current, induced axial and normal velocity above the actuator (Forte et al., 2007) is shown in Figure 2.8. One can notice that the discharge does not behave similarly during the positive and negative half-cycles. The negative half-cycle induces more velocity than the positive one. The time-averaged velocity induced by the plasma actuator has positive axial and negative normal components. This effect can be represented by a volumetric force distribution, with the direction from the exposed electrode to the hidden electrode.
Figure 2.8: Time evolution of voltage, current, induced axial and normal velocity above the actuator (Forte et al., 2007)
Though the generation mechanism of plasma actuator is beyond the scope of the current work, some basic knowledge need be introduced here because it will be used to explain the trends in the parametric study to optimize plasma actuators for experiments. When the applied voltage is positive and increases (positive-going), the plasma is ignited. This is termed the backward discharge because the electrons accelerate backward and toward the upstream exposed electrode. When the applied voltage is positive and decreases, the plasma is quenched. When the applied voltage is negative and decreases (negative-going), the plasma is ignited again. This is
termed the forward discharge because the electrons accelerate forward and away from the exposed electrode. When the applied voltage is negative and increases, the plasma is quenched.
The forward discharge performs most of the momentum transfer to the neutral fluid (force generation)(Boeuf et al., 2009; Enloe et al., 2008). A few high current pulses (corresponding to streamers) are observed during the backward discharge, while the forward discharge is composed of a much larger number of current pulses of smaller amplitudes. The streamers can perturb the development of the force such that the force is zero during the streamer formation and restarts from zero after each streamer.
Enloe et al. (2004) investigated the working mechanism of single DBD by taking optical, electrical, and thrust measurements. The temporal and macro-scale structure of the plasma actuator was revealed. Their work also indicated that an interaction of the plasma with the applied electric field in the discharge was responsible for the momentum transfer to the neutral fluid through plasma-neutral collisions (collisions between drifting ions and neutral particle). Boeuf et al. (2005) however focused on the calculation of electro-hydrodynamic force produced by the plasma actuator, based on a 2-D fluid model of the surface discharge. They showed that the nature of the force was same as that of the electric wind in a corona discharge, and the force magnitudes in two cases were also comparable.
The DBD plasma actuator can be used in continuous mode or pulsed mode. For the latter mode, the significant parameters, as shown in Figure 2.9, include actuation/modulation frequency (1/Tc), duty cycle and strength. The continuous mode can be regarded as a duty cycle of 100%. In the pulsed mode, the pulsing frequency can be chosen to excite resonant turbulent flow structures in the boundary layer to improve momentum transfer from the outer high-velocity fluid and thus suppress separation with minimal power input.
Figure 2.9: An illustration of pulsed actuation
Optimization of the plasma actuator to obtain increased body force and velocity of plasma wind was studied by Forte et al. (2007), Roth et al. (2006) and Thomas et al. (2009). The investigated parameters include dielectric material and thickness, applied voltage amplitude and frequency, voltage waveform, exposed electrode geometry, covered electrode width and multiple actuator arrays (Thomas et al., 2009). From the above parametric study, actuators with thick dielectric material of low dielectric constant produce a body force that is an order of magnitude larger than those with Kapton dielectric material used in many previous plasma flow control studies.
In order to investigate the physics and the flow control applications of DBD plasma actuators, significant effort has been made in modeling the actuator for numerical simulations. Generally, Lemire and Vo (2011) classified these models into two main categories: 1) the sophisticated “scientific” models that aim to simulate the physics and working of plasma actuators on a microscopic scale, and 2) the “engineering” or “phenomenological” models that aim to reproduce the global effects of the actuators on the flow with minimal computational cost.
The “scientific” models include those by Roy and Gaitonde (2006) and Jayaraman et al. (2006). These models solve the transport equations of discharge species to obtain the force generated by the actuator. Although these models use only three species (i.e., ions, electrons and
neutrals), they are computationally expensive and their direct implementation into CFD simulations in macroscopic aerodynamic applications is not yet practical.
Among the simplified “engineering” models are those by Shyy et al. (2002), Suzen et al. (2005) and Orlov et al. (2007). The model proposed by Shyy et al. (2002) adopted an empirically-guided approach to produce a linear time-averaged (over an AC input cycle) force distribution to study the momentum coupling with the neutral fluid. Suzen et al. proposed a more sophisticated model to obtain a more realistic non-linear spatial body force distribution, by solving for the spatial distribution of electric potential and charge density taking into account the actuator geometry and dielectric/air material properties. Orlov et al. employed a lumped-element circuit model, which incorporated more of the plasma physics, to solve the spatial and temporal variation of the body force (variation of the electric potential and discharge). Moreover, a “hybrid” model, which combines the features of the models of Suzen et al. and Orlov et al., is found to predict a spatial body force distribution that most resembles that obtained with a sophisticated scientific model (Lemire and Vo, 2011).
The hybrid actuator model basically consists of solving two equations, at each time step in the AC input cycle, for the spatial distributions of electric potential (ϕ) and charge density (ρc), as given by Suzen et al. (2005):
(ε φ) 0 ∇ ∇ = (2.1) 2 ( ) c c d ρ ε ρ λ ∇ ∇ = (2.2) where ε is the local relative permittivity (compared to air) and λd is the Debye length (a plasma characteristic).
Orlov et al. (2007) basically divides the domain over the dielectric surface into N volumes (Figure 2.10) to which a network of N parallel electric circuits is associated. The electric potential Vn(t) and the current Ipn(t) for each circuit at every time step of the AC period can then
be obtained from the input voltage properties (amplitude, frequency) and from the properties associated to the spatial position of the circuit. The charge density on the dielectric surface over the covered electrode ρcn(t) is computed as a function of the current through the plasma resistance Ipn(t) and the volume associated to the electric circuit (Figure 2.10) as follows:
( ) ( ) pn 1, 2,..., cn n I t t t n N Volume ρ = ⋅Δ = (2.3) where Δt corresponds to the time step increment used in the computation of Vn(t) and Ipn(t) over one AC input period.
Once the spatial distributions of electric potential and charge density in the plasma are solved from Equations (2.1) and (2.2) at each time step, the corresponding body force distribution (per unit actuator length into the paper) can be computed with Equation (2.4):
( ) [ / ]
c c
F =ρ EA=ρ −∇φ A N m
(2.4) where A is the area of the mesh.
Figure 2.10: Subdivision of the domain over the covered electrode into N volume (Lemire and Vo, 2011)
The effect of a single DBD plasma actuator on flow control, at least for low Mach number/incompressible flow regimes, can be modeled as a time-averaged spatial body force distribution, which is the usual approach taken for simulating flow control concepts with plasma actuators. This is justified by the fact that the time scales associated with the ionization and with
the AC input cycle of the actuator are, respectively, several and at least one order of magnitude faster than the response of the flow (Jayaraman and Shyy, 2008). The plasma formation process is thus quasi-steady from the point of view of the flow. Numerical investigation of DBD plasma actuators in flow control with the integrated engineering plasma actuator model includes laminar separation control on airfoils (Orlov et al., 2007) and on turbine blades (Rizzetta and Visbal, 2008) and turbulent separation control (He et al., 2007). More information on the modeling of DBD plasma actuators can be found in the review by Jayaraman and Shyy (2008).
In the following review, only a few applications of plasma actuators on flow control are discussed, from which some useful ideas for the current work such as related to actuation mode (continuous versus pulsed), actuation frequency and actuation direction can be obtained.
Many researchers have studied the application of plasma actuators on airfoils and gas turbines. Orlov et al. (2007) numerically and experimentally studied the effects of DBD actuator to control the leading edge separation and thus increase airfoil lift at different angles of attack. It was found that steady actuation delayed stall by approximately 2 degrees of angle of attack, while unsteady actuation was shown to produce even better results, with the stall angle delayed by 5 degrees.
Due to the limited velocity induced by existing DBD plasma actuators, experimental tests of plasma actuator in real flight conditions are presently impossible. Thus Patel et al. (2008) investigated the scaling effects of an aerodynamic plasma actuator for leading edge separation control on airfoils between laboratory and real flight conditions. An optimum pulsed actuation frequency for minimizing the actuator voltage to reattach the flow was F+ fc U/ O(1)
∞
= = ,
where c is the chord length and U∞ freestream velocity. At this optimum frequency, the required minimum voltage was weakly dependent on chord Reynolds number and strongly dependent on the poststall angle of attack and leading edge radius.
low-pressure turbines, for which the separation was effectively controlled by laminar-turbulent transition induced by plasma actuators. In this work, the strategies of plasma-based control included chordwise location of actuation (Figure 2.11(a) versus (b)), spanwise periodic arrays of actuators (Figure 2.11(d) and (e)), multiple actuation in the streamwise direction (Figure 2.11(c)), and spanwise actuation (Figure 2.11(e) and (f)). As for the working modes of DBD plasma actuator, comprehensive tests and comparisons of continuous co-flow, pulsed co-flow and pulsed counter-flow actuation were done by Visbal and Gaitonde (2006). These working modes were used for triggering laminar-turbulent transition to delay stall of an airfoil at high attack angles, and also for changing the vortex breakdown location on the vertical flow above a swept delta wing.
Figure 2.11: Different plasma actuator configurations (Rizzetta et al., 2008)
Hultgren and Ashpis (2003) experimentally studied the effect of plasma actuator on suppression of laminar boundary layer separation. The test section in this work is shown in Figure 2.12,which is similar to our test section in this project (in contrast, the turbulent boundary layer separation control is the main goal in this project). The separation was generated near the test wall by the suction on top wall. The plasma actuator was placed upstream of the separation point, and worked by triggering early laminar-turbulent transition in the shear layer above the