UNIVERSITÉ DE MONTRÉAL
NUMERICAL, ANALYTICAL AND EXPERIMENTAL STUDIES OF THE HYDRO-GEOTECHNICAL BEHAVIORS OF SLURRIED MATERIALS
JIAN ZHENG
DÉPARTEMENT DE GÉNIES CIVIL, GÉOLOGIQUE ET DES MINES ÉCOLE POLYTECHNIQUE DE MONTRÉAL
THÈSE PRÉSENTÉE EN VUE DE L’OBTENTION DU DIPLÔME DE PHILOSOPHIAE DOCTOR
(GÉNIE MINÉRAL) NOVEMBRE 2018
UNIVERSITÉ DE MONTRÉAL
ÉCOLE POLYTECHNIQUE DE MONTRÉAL
Cette thèse intitulée :
NUMERICAL, ANALYTICAL AND EXPERIMENTAL STUDIES OF THE HYDRO-GEOTECHNICAL BEHAVIORS OF SLURRIED MATERIALS
présentée par : ZHENG Jian
en vue de l’obtention du diplôme de : Philosophiae Doctor a été dûment acceptée par le jury d’examen constitué de :
M. SIMON Richard, Ph. D., président
M. LI Li, Ph. D., membre et directeur de recherche M. MARTIN Vincent, Ph. D., membre
DEDICATION
To my family To my country
ACKNOWLEDGEMENTS
First of all, I would like to express my deepest appreciation and respect to my supervisor, Prof Li Li, for your constant support, guidance and encouragement for my pre-doctoral research proposal, journal articles and this Ph.D. thesis, for your patience, motivation and immense knowledge. Thank you for always taking time out of your busy schedule to discuss with me and help me overcome many difficulties in my research project. Also, many thanks for giving me the chance to present my research in many occasions.
I’m very grateful to Prof. Richard Simon, Prof. Paul Simms, Dr. Vincent Martin and Prof. Anoui Lakis for your acceptance to be members of jury for my Ph.D. thesis. I’m aware that you are very busy with many commitments. Thank you!
I would also like to thank Prof. Mamert Mbonimpa and Prof. Thomas Pabst for their time, discussion and comments on my pre-doctoral proposal and articles. I especially want to thank Prof. Yuchao Li for his support, advices and encouragements during my studies in both China and Canada. Many thanks to Prof. Robert P Chapuis, Michael James, and Tikou Belem for their courses. Noura EI-Harrak, Samuel Chénier, Vincent Martin, Karim Essayad, Natasha Carrière, Maxime Daviault, Ghislain Charly Mube Soh and Yousra EI Bahraoui are also acknowledged for their kind help in my laboratory work.
My time in Montréal was so enjoyable and enriched due to many friends and groups. I would like to thank all my colleagues, friends and members of RIME-IRME research group for their kind help and advices. Also, many thanks to my teammates, friends and leaders I met in the volunteer organization “les amis de la montagne Montréal”, we had a great time in the past three years. I acknowledge the financial support from Natural Sciences and Engineering Research Council of Canada (NSERC), Institut de recherche Robert-Sauvé en santé et en sécurité du travail (IRSST), Fonds de recherche du Québec - Nature et Technologies (FRQNT), and also our industrial partners of the Research Institute on Mines and the Environment (RIME UQAT-Polytechnique).
Lastly, I would like to express my profound appreciation to my family, for their unconditional support, love and patient during my life and studies. I love them so much, it is impossible for me to make it so far without their support. There are no words to express how grateful I am to the sacrifices they have made on my behalf.
RÉSUMÉ
Les mines produisent des minéraux précieux, mais aussi une grande quantité de rejets miniers solides, y compris des résidus miniers et des stériles. Dans la plupart des cas, les résidus sont transportés par des canalisations et confinés dans des parcs à résidus, tandis que les stériles sont entreposés sous forme de haldes à stérile. Ces méthodes traditionnelles de gestion des rejets miniers peuvent poser des problèmes environnementaux et géotechniques. Une autre méthode consiste à utiliser les rejets miniers pour remblayer les chantiers miniers sous terre, ce qui peut améliorer la stabilité du terrain, augmenter la récupération du minerai et réduire le stockage en surface des rejets miniers.
Cependant, les digues des parcs à résidus et les barricades dans les chantiers miniers peuvent se rompre. Dans la plupart des cas, les conséquences d’une rupture d’une digue de retenue ou d’une barricade sont très graves et même catastrophiques. Il est donc très important d’évaluer correctement la pression interstitielle lors du remplissage afin de garantir la stabilité des digues de retenue des résidus et des barricades de chantiers remblayés. C'est l'objectif principal de la thèse. Pour le dépôt de matières en suspension (résidus miniers ou boues de dragage), Gibson a proposé un modèle en 1958 pour évaluer la pression interstitielle en excès. Sa solution contient une intégrale qui ne peut être évaluée que numériquement. Des solutions analytiques sont donc proposées dans le cadre de cette thèse basées sur le modèle de Gibson (1958). Les solutions analytiques proposées peuvent être résolues à l’aide d’outils de calcul couramment disponibles (e.g. Excel de Microsoft). Les solutions proposées ont été validées par les résultats numériques obtenus par SIGMA/W. Le bon accord entre les résultats analytiques et numériques indique que les solutions proposées peuvent être un outil utile pour évaluer la pression interstitielle pendant le dépôt de matière en suspension, en particulier au stade préliminaire du projet. Dans le cas d'une opération après la fin du dépôt, Gibson n'a proposé qu'une équation différentielle en 1958. Cette équation différentielle ne peut pas être appliquée directement pour évaluer la pression interstitielle ou l’excès de celle-ci. De nouveaux développements ont été réalisés, menant à une nouvelle solution qui peut être utilisée pour évaluer la pression interstitielle avec des outils de calcul tels que MATLAB. Les solutions proposées ont également été validées par les résultats numériques obtenus par SIGMA/W. Elles peuvent être utilisées pour évaluer la pression interstitielle après le dépôt de matières en suspension (résidus miniers ou boues de dragage) au stade préliminaire d'un projet.
Pour la conception de barricade dans les chantiers remblayés, le facteur le plus important à considérer est la contrainte totale exercée sur celle-ci pendant et peu de temps après le dépôt du remblai. Au cours de ce processus, une consolidation du dépôt sous son poids propre peut avoir lieu, accompagnée de la génération d'une contrainte effective et d'un effet d’arche le long des interfaces de contact. Jusqu'à présent, la consolidation sous le poids propre et l'effet d’arche n'avaient jamais été pris en compte simultanément dans l'évaluation des contraintes dans les chantiers remblayés. Dans cette thèse, de nouvelles solutions sont proposées pour évaluer les contraintes totales et effectives des chantiers remblayés en prenant en compte la consolidation sous le poids propre et l’effet d’arche. Pour les remblais à très haute perméabilité, la solution proposée pour le cas de base imperméable peut être réduite à la solution proposée par Li et Aubertin en 2009 pour les chantiers remblayés à pression hydrostatique. Les solutions proposées sont également validées par une modélisation numérique réalisée avec Plaxis2D. Un exemple d'application des solutions proposées montre qu'un coefficient de consolidation élevé et un faible taux de remblayage sont favorables au drainage, ce qui se traduit par une contrainte effective élevée et une contrainte totale faible dans le chantier remblayé.
Malgré les nombreuses études sur la pression et les contraintes exercées sur les chantiers remblayés, un dilemme existe. Dans les quelques manuels disponibles sur les remblais miniers, les pressions dans les chantiers remblayés avec du remblai en pâte ont été jugées très faibles. Une légère construction de barricade a été recommandée pour conserver le remblai en pâte dans les chantiers miniers. Cela ne correspond pas aux mesures in situ, qui ont montré que les pressions interstitielles et les contraintes totales au cours de l'opération de remblayage peuvent être aussi élevées que la pression iso-géostatique due au poids des terres. Une révision de la définition du remblai en pâte donnée dans les manuels révèle qu'un remblai en pâte répondant au critère en termes de saignement d'eau peut être très visqueux et probablement non saturé. Lorsque ce remblai est placé dans un chantier, il se produit un effet d’arche associé à la cohésion apparente, ce qui entraîne de faibles contraintes dans les chantiers remblayés. En pratique, l'application d'un tel remblai en pâte peut être très difficile. Il faut ajouter plus d'eau dans le remblai pour réduire la consommation d'énergie nécessaire au pompage et au transport, pour obtenir une surface de remblayage horizontale ou pour assurer des contacts étroits entre le remblai et le plafond du chantier. Lorsque le remblai en pâte est placé dans le chantier sous forme de boue, le remblai n'a aucune résistance effective au cisaillement. Les pressions interstitielles et les contraintes totales
peuvent être aussi élevées que la pression iso-géostatique due au poids des terres. Ces deux cas extrêmes indiquent que les pressions et les contraintes dans les chantiers remblayés dépendent de la teneur en eau ou en solides du remblai. Pour étayer cette hypothèse, une série d’essais sur colonne a été réalisée avec un remblai en pâte de différents pourcentages de solides. Les contraintes totales verticales ont été mesurées au centre et près du mur. Les résultats montrent que les contraintes totales verticales dans un chantier diminuent à mesure que le pourcentage de solides augmente. Lorsque le pourcentage de solide du remblai est très élevé, une contrainte totale verticale faible au centre et près du mur a été obtenue. Une légère construction de barricade suffit. Lorsque le pourcentage de solides est faible, les contraintes totales verticales aussi élevées que la pression iso-géostatique ont été obtenues. Une légère construction de barricade peut ne pas suffire.
Les principaux résultats de ce projet sont présentés dans sept articles de revue, dont deux publiés et cinq soumis. Les résultats des travaux connexes ont été présentés dans les annexes, incluant notamment les résultats des essais de laboratoire effectués pour mesurer le coefficient de pression des terres dans les chantiers remblayés et ceux sur l'efficacité de la réduction du frottement en utilisant différents matériaux lubrifiants.
ABSTRACT
Mines produce not only valuable minerals, but also a large amount of solid wastes including tailings and waste rocks. For most cases, the tailings are transported by pipes and confined in tailings impoundments while the waste rocks are disposed as waste rock piles. These traditional mine waste management methods can pose some environmental and geotechnical problems. Thus, more and more mines use the mine wastes to fill underground mine stopes. This practice allows improved ground stability, increased ore recovery and reduced surface disposal of mine wastes.
However, tailings dams and barricades can fail. In most cases, the consequences associated with a tailing dam or barricade failure are very serious and catastrophic. It is thus very important to correctly evaluate the pore water pressure (PWP) in the tailings impoundments and in mine backfilled stopes during and after the deposition operation to ensure stable tailings dams and barricades of backfilled stopes. This is the main objective of the thesis.
For the case of ongoing deposition of a slurry, Gibson proposed a model in 1958 to evaluate the excess PWP. His solution contains an integral part, which can only be evaluated numerically. Analytical solutions are thus proposed in the context of this thesis based on the Gibson (1958) model. The proposed analytical solutions can be solved by commonly available tools of calculation (e.g. Excel of Microsoft). The proposed solutions have been validated by numerical results obtained by SIGMA/W. The good agreement between the analytical and numerical results indicates that the proposed solutions can be a useful tool to evaluate the PWP during the slurry deposition, especially in the preliminary stage of a project. For the case of after the end of deposition operation, Gibson only proposed a governing equation in 1958. The differential equations cannot directly be applied to evaluate the PWP or excess PWP. New development has been done, resulting in a new solution that can be used to evaluate the PWP with some commercial calculation tools like MATLAB. The proposed solutions have also been validated by numerical results obtained by SIGMA/W. They can be used to evaluate the PWP after the slurry deposition, in the preliminary stage of a project. For the case of barricade design in backfilled stopes, the most critical factor is the total stresses during and shortly after the slurry deposition. During theses processes, self-weight consolidation can take place, accompanied with the generation of effective stress and arching effect along the fill-wall contact interfaces. Until now, the self-weight consolidation and the arching effect have never been considered simultaneously in the evaluation of stresses in backfilled stopes. In this
thesis, new solutions are proposed to evaluate the total and effective stresses in backfilled stopes by considering the self-weight consolidation and arching effect. For backfill with very high permeability, the proposed solution for the case of impervious base can reduce to the solution proposed by Li and Aubertin in 2009 for backfilled stopes with hydrostatic pressure. The proposed solutions are also validated by numerical modeling conducted with Plaxis2D. Sample application of the proposed solutions shows that high consolidation coefficient and low filling rate are favorable to the drainage, resulting in high effective stress and low total stress in the backfilled stope.
Despite the numerous studies on the pressure and stresses in backfilled stopes, a dilemma exists. In the few available handbooks on mine backfills, light barricades are recommended to retain paste backfill in mine stopes because the pressures in stopes backfilled with paste backfill were evaluated as very small. This does not correspond to the in situ measurements, which showed that the PWP and total stresses during the backfilling operation can be as high as the iso-geostatic pressure based on the overburden of the backfill. A revision on the definition of paste backfill given in the handbooks reveals that a paste backfill meeting the criterion in terms of water bleeding can be very viscous and probably unsaturated. When such backfill is placed in a stope, arching associated with the apparent cohesion takes place, resulting in small stresses in the backfilled stopes. In practice, the application of such paste backfill can be very difficult. More water has to be added in the backfill to minimize the energy consumption for the pumping and transportation, to obtain horizontal backfill surface or to ensure tight contacts between the backfill and stope roofs. When the paste backfill is placed in the stope in form of slurry, the backfill has no effective shear strength. The PWP and total stresses can be as high as the iso-geostatic pressure based on the overburden of the backfill. These two extreme cases indicate that the pressures and stresses in the backfilled stope depend on the water or solid content of the backfill. To verify this hypothesis, a series of column tests were conducted with a paste backfill of different solid contents. The vertical total stresses were measured at the center and near the wall. The results show that the vertical total stresses in a backfilled stope decrease as the solid content increases. When the solid content of backfill is very high, low vertical total stress at the center and near the wall were obtained. A light barricade may be enough. When the solid content is low, the vertical total stresses as high as the iso-geostatic pressure were obtained. A light barricade may not be enough.
The main results of this project are presented in seven journal articles with two published and five submitted. The laboratory test results conducted to measure the earth pressure coefficient in backfilled stopes and those performed to investigate the efficiency of friction reduction by using different lubricant materials have been presented in Appendices.
TABLE OF CONTENTS
DEDICATION ... III ACKNOWLEDGEMENTS ... IV RÉSUMÉ ... V ABSTRACT ...VIII TABLE OF CONTENTS... XI LIST OF TABLES ... XVII LIST OF FIGURES ... XVIII LIST OF SYMBOLS AND ABBREVIATIONS ... XXX LIST OF APPENDICES ... XXXVCHAPTER 1 INTRODUCTION ... 1
1.1 Statement of the problem ... 1
1.2 Objectives of the research ... 2
1.3 Contributions ... 3
1.4 Organization ... 5
CHAPTER 2 LITERATURE REVIEW ... 6
2.1 Underground mining with backfill ... 6
2.1.1 Underground mining methods and the possible application of backfill ... 6
2.1.2 Critical concerns in backfilled stope design ... 14
2.2 Tailings and mining backfills ... 14
2.2.1 Tailings ... 14
2.2.2 Mining backfills ... 17
2.3.1 Pressure and stresses during and shortly after the slurry deposition – Backfill in
undrained or quasi undrained conditions ... 27
2.3.2 Pressures and stresses long-time after the slurry deposition − Backfill in or close to fully drained conditions ... 44
2.3.3 Earth pressure coefficient ... 65
2.4 Barricades to retain different types of backfills ... 67
2.4.1 Barricades to retain dry or high hydraulic conductivity backfill ... 69
2.4.2 Barricades to retain low hydraulic conductivity backfill ... 69
CHAPTER 3 ARTICLE 1: AN ANALYTICAL SOLUTION OF GIBSON’S MODEL FOR ESTIMATING THE PORE WATER PRESSURES IN ACCRETING DEPOSITION OF SLURRIED MATERIAL UNDER ONE-DIMENSIONAL SELF-WEIGHT CONSOLIDATION. PART I: PERVIOUS BASE ... 71
3.1 Introduction ... 71
3.2 Formulation of an analytical expression for the Gibson solution ... 74
3.3 Comparison with numerical results... 77
3.4 Sample applications ... 81
3.4.1 PWP estimation in tailings ponds ... 81
3.4.2 Sample application in mine backfilled stopes... 83
3.5 Discussion ... 86
3.6 Conclusion ... 90
3.7 Appendix I: Sample calculations of PWP distribution with Microsoft Excel... 91
3.8 Appendix II: Sensitivity analyses of h0 and n in the application of the proposed analytical solution [Eq. (3.12)] ... 92
3.9 References: ... 93 CHAPTER 4 ARTICLE 2: AN ANALYTICAL SOLUTION OF GIBSON’S MODEL FOR ESTIMATING PORE WATER PRESSURES IN ACCRETING DEPOSITION OF SLURRIED
MATERIAL UNDER ONE-DIMENSIONAL SELF-WEIGHT CONSOLIDATION. PART Ⅱ:
IMPERVIOUS BASE... 98
4.1 Introduction ... 99
4.2 Formulation of an analytical expression for the Gibson solution ... 101
4.3 Comparison with numerical results... 104
4.4 Sample applications ... 107
4.4.1 Sample application in tailings pond ... 107
4.4.2 Sample application in mine backfilled stopes... 109
4.5 Discussion ... 112
4.6 Conclusion ... 113
4.7 References ... 113
CHAPTER 5 ARTICLE 3: A NEW SOLUTION TO EVALUATE THE PWP DURING AND AFTER SLURRY DEPPOSITION ON A PERVIOUS BASE ... 116
5.1 Introduction ... 117
5.2 Proposed solutions ... 118
5.2.1 Solution for PWP during the slurry deposition ... 119
5.2.2 Solution for PWP after the slurry deposition ... 120
5.3 Comparison with numerical simulations ... 121
5.4 Sample application of the proposed solutions ... 123
5.4.1 Tailings dams ... 123
5.4.2 Underground mine backfilled stopes... 127
5.5 Discussion ... 129
5.6 Conclusion ... 130
5.7 Appendix I: Derivation process for the proposed solution [Eq. (5.7)] ... 131
5.9 References ... 135
CHAPTER 6 ARTICLE 4: A SOLUTION TO ESTIMATE THE EXCESS PWP DURING AND AFTER SLURRY DEPOSITION ON AN IMPERVIOUS BASE ... 139
6.1 Introduction ... 140
6.2 Gibson model ... 141
6.2.1 Gibson’s solution for excess PWP during the slurry deposition ... 142
6.2.2 Gibson’s solution for excess PWP after the slurry deposition... 143
6.3 Proposed solutions ... 143
6.3.1 Solution for excess PWP during the slurry deposition ... 144
6.3.2 Solution for excess PWP after the slurry deposition ... 144
6.4 Validation of the proposed solutions by numerical modeling ... 146
6.5 Sample application of the proposed solutions ... 148
6.5.1 Tailings ponds ... 148
6.5.2 Underground mine backfilled stopes... 152
6.6 Discussion ... 155
6.7 Conclusion ... 156
6.8 Appendix I: Derivation process for the proposed solution [Eq. (6.8)] ... 157
6.9 Appendix II: MATLAB program for solving Eq. (6.8) ... 160
6.10 References ... 161
CHAPTER 7 ARTICLE 5: A SOLUTION TO ESTIMATE THE TOTAL AND EFFECTIVE STRESSES IN BACKFILLED STOPES WITH AN IMPERVIOUS BASE DURING THE FILLING OPERATION ... 167
7.1 Introduction ... 168
7.2 Proposed solution ... 170
7.2.2 Arching model ... 173
7.3 Validation of the proposed solution against numerical modeling ... 178
7.4 Sample applications ... 180
7.5 Discussion ... 184
7.6 Conclusion ... 185
7.7 Appendix I: Process for the deduction of Eq. (7.27) ... 186
7.8 Appendix II: MATLAB program for solving Eq. (7.32) ... 187
7.9 References ... 189
CHAPTER 8 ARTICLE 6: TOTAL AND EFFECTIVE STRESSES IN BACKFILLED STOPES DURING THE FILL PLACEMENT ON A PERVIOUS BASE FOR BARRICADE DESIGN 193 8.1 Introduction ... 194
8.2 Proposed solution ... 195
8.2.1 Solution to estimate the (excess) PWP ... 196
8.2.2 Solution to evaluate the effective and total stresses ... 199
8.3 Validation of the analytical results by numerical results ... 202
8.4 Sample applications ... 206
8.5 Discussion ... 210
8.6 Conclusions ... 211
8.7 Appendix I: MATLAB program to solve Eq. (8.30) ... 211
8.8 References ... 214
CHAPTER 9 ARTICLE 7: VARIATION OF THE “SHORT-TERM” PRESSURES OF PASTE BACKFILL AS A FUNCTION OF THE SOLID CONTENT ... 219
9.1 Introduction ... 220
9.3 Laboratory tests ... 225
9.3.1 Testing material... 226
9.3.2 Slump test ... 227
9.3.3 Pressure measurement with column tests ... 227
9.4 Test results and interpretation ... 230
9.5 Discussion ... 238
9.6 Conclusions ... 239
9.7 References ... 240
CHAPTER 10 SUMMARY AND DISCUSSION ... 245
10.1 Main results ... 245
10.2 Discussion ... 248
CHAPTER 11 CONCLUSIONS AND RECOMMENDATIONS ... 252
11.1 Conclusion ... 252
11.2 Recommendations ... 254
BIBLIOGRAPHY ... 257
LIST OF TABLES
LIST OF FIGURES
Figure 2-1: Plan view of a room-and-pillar mine (taken from Darling 2011) ... 7 Figure 2-2: Schematic diagram of the (a) blasthole stoping and (b) long hole stoping (taken from
Hamrin et al. 2001) ... 8 Figure 2-3: The layout of shrinkage stoping (taken from Hamrin et al. 2001) ... 9 Figure 2-4: Schematic diagram of vertical crater retreat (a) primary stopes mined and (b) secondary
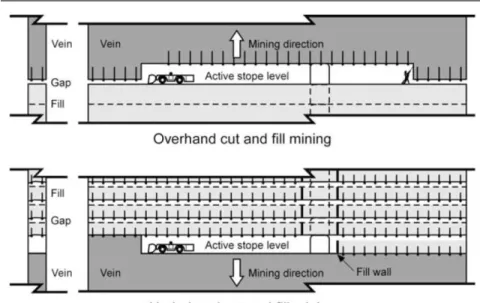
stopes mined (taken from Darling 2011) ... 10 Figure 2-5: Schematic diagram of the overhand and underhand cut and fill mining methods (taken
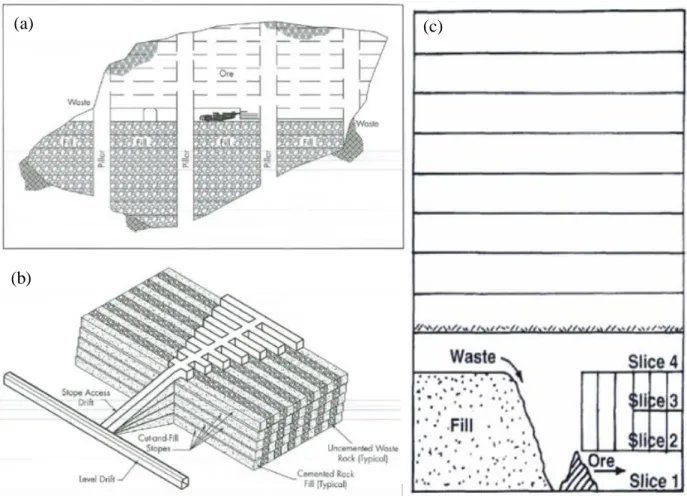
from Williams et al. 2007) ... 11 Figure 2-6: Variations of cut-and-fill mining methods (a) post pillar mining (taken from Darling
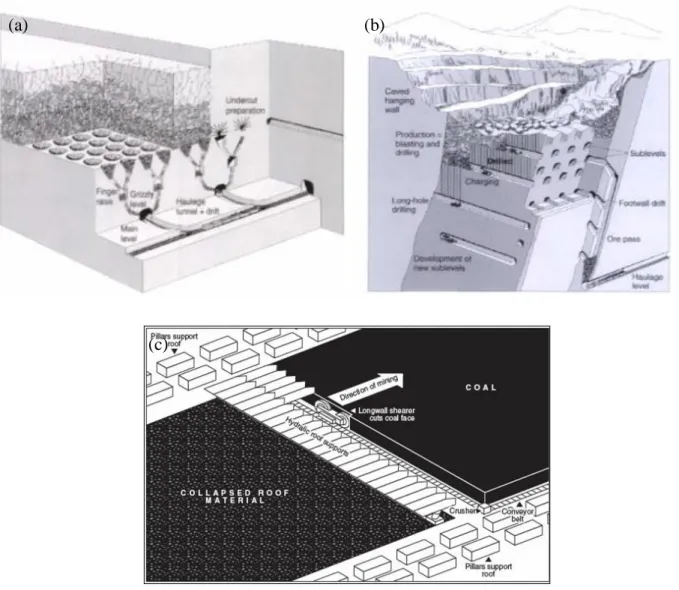
2011); (b) drift and fill (taken from Darling 2011), and (c) Avoca mining (taken from Hamrin et al. 2001) ... 12 Figure 2-7: Schematic diagram of (a) block caving, (b) sublevel caving and (c) longwall mining
(taken from Hamrin et al. 2001) ... 13 Figure 2-8: Grain size distribution curves of nine Canadian hard rock tailings (taken from Bussière
2007) ... 15 Figure 2-9: Three types of tailings dams constructed with: (a) upstream method, (b) downstream
method and (c) centerline method (taken from Vick 1990) ... 17 Figure 2-10: Accreting deposition of slurried tailings through pipeline system and confined in
tailings dams (photo taken by Li 2014 in a Québec mine) ... 17 Figure 2-11: Grain size distribution curves of paste fill, hydraulic fill and cemented hydraulic fill
used in Australian mines (taken from Sivakugan et al. 2006) ... 18 Figure 2-12: Typical grain size distribution curves of the hydraulic fills used in Australian mines
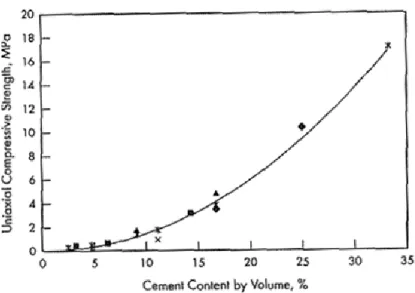
(taken from Rankine et al. 2006) ... 19 Figure 2-13: Variation of uniaxial compressive strength of CHF as a function of cement content by
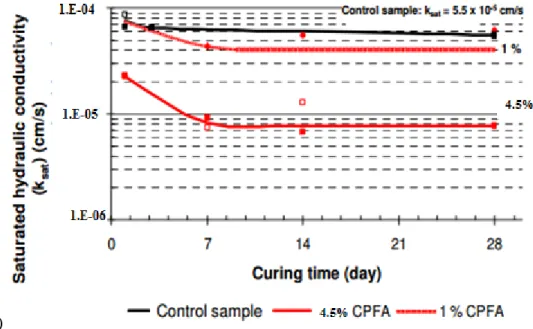
Figure 2-14: Evolution of saturated hydraulic conductivity with curing time for: (a) CPSG, and (b) CPFA, under different binder content (taken from Godbout et al. 2007) ... 24 Figure 2-15: Evolution of the shear modulus of cemented paste backfill with curing time (taken
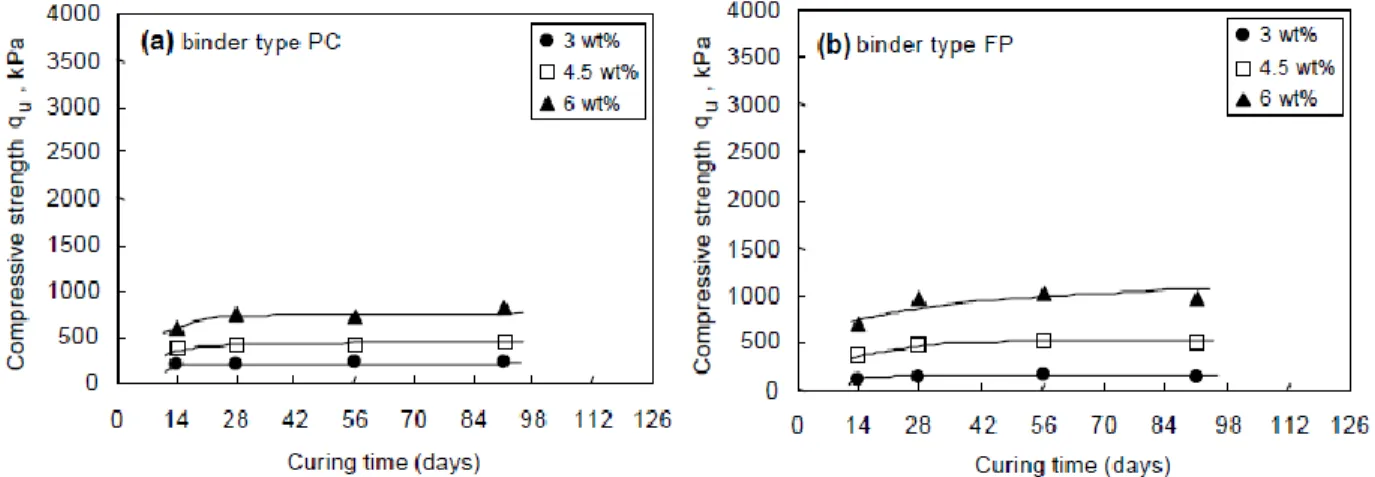
from Abdelaal 2011) ... 25 Figure 2-16: Evolution of the compressive strength qu with curing time for paste backfill with
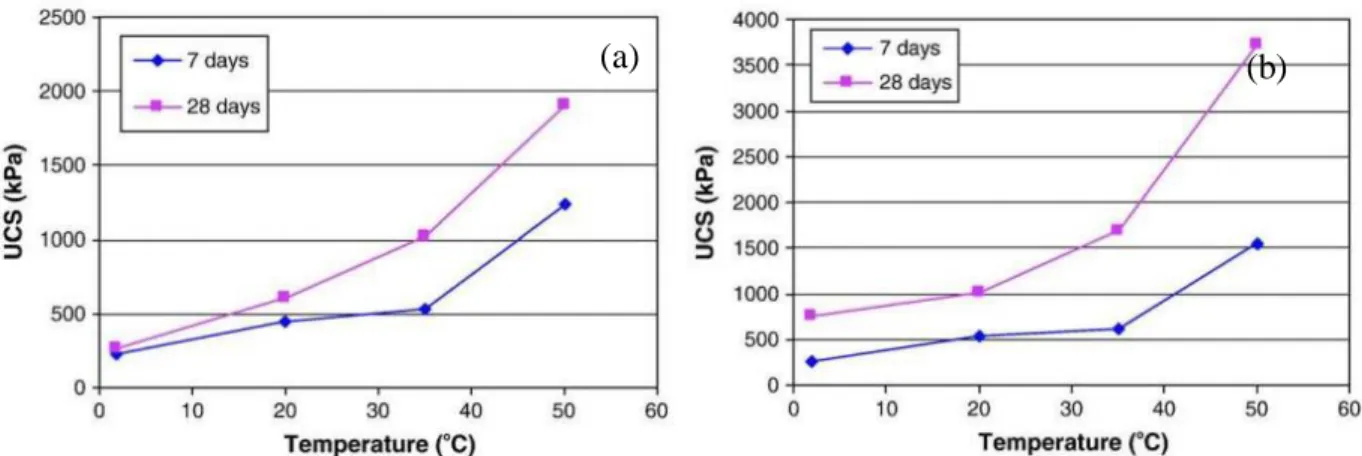
different types of binder: (a) PC, (b) FP (taken from Belem et al. 2000) ... 25 Figure 2-17: Effect of curing temperature on the UCS development of cemented paste backfill
made of (a) Portland cement and (b) Portland cement/blast furnace Slag (50/50) (taken from Fall et al. 2010) ... 26 Figure 2-18: Accreting deposition of slurried material on a pervious/impervious base (taken from
Gibson 1958) ... 28 Figure 2-19: (a) void ratio-effective stress and (b) permeability-void ratio relationship based on the
test results (taken from Pedroni and Aubertin 2008) ... 32 Figure 2-20: Photograph of the column test apparatus (taken from Li et al. 2013) ... 33 Figure 2-21: Relationship between (a) hydraulic conductivity and void ratio and (b) void ratio and
vertical effective stress, obtained by the experimental data and predicted by the proposed relationships (taken from Li et al. 2013) ... 33 Figure 2-22: Schematic diagram of the self-weight consolidation tests with backfill from (a) LRD
mine (CT1 tailings sample), and (b) LVT mine (CT2 tailings sample) (taken from Belem et al. 2016) ... 34 Figure 2-23: (a) a mine stope filled with backfill in two stages and the installation of earth pressure
cells, (b) evolution of pressure on the barricade with the filling time (taken from Belem et al. 2004) ... 35 Figure 2-24: (a) The layout of the instruments in the KB mine stope, (b) the measured stresses
during the filling operation (taken from Helinski et al. 2011) ... 36 Figure 2-25: (a) Variation of the total pressure with the filling time, (b) layout of the pressure
Figure 2-26: Schematic diagram of the layout of the instruments in the stope 685 and 715 (taken from Thompson et al. 2012) ... 38 Figure 2-27: (a) Measured horizontal pressure, pore water pressure and temperature on the
barricade; (b) Horizontal total pressure for Cages 1-3 and barricade TEPCs 1 (1.4m height) and 2 (2.8 m height) in the 685 stope, measured along the axis of the stope (toward the barricade) (taken from Thompson et al. 2012) ... 39 Figure 2-28: Evolution of the total pressure, pore water pressure and temperature with the filling
time: (a) on the barricade; (b) cage 3 in the stope 685 (H1 = perpendicular to strike direction, H2 = along strike direction, V = vertical) (taken from Thompson et al. 2012) ... 40 Figure 2-29: Distribution of the vertical and horizontal total stresses along the height of the
backfilled stope obtained by Plaxis with different value of k (taken from Fahey et al. 2009) ... 41 Figure 2-30: Variation of (a) vertical total stress, (b) pore water pressure and (c) vertical effective
stresses in the backfilled stope obtained by SIGMA/W (taken from El Mkadmi et al. 2014) ... 42 Figure 2-31: Evolution of the (a) vertical total stress and (b) horizontal total stress near the base of
the stope with different filling rate (taken from El Mkadmi et al. 2014)... 43 Figure 2-32: Distribution of the total pore water pressure along the height of the backfill with (a)
0.5 m and (b) 3.0 m slurry on top of the backfill (taken from Shahsavari and Grabinsky 2014) ... 44 Figure 2-33: Variation of the (a) vertical and (b) horizontal stresses along the vertical center line
of the backfilled stope obtained by the numerical simulations with FLAC and calculated by the Marston theory (taken from Li et al. 2003) ... 46 Figure 2-34: Model of Terzaghi (1943) to calculate the stresses in cohesion soil (taken from
Terzaghi 1943)... 47 Figure 2-35: A vertical narrow backfilled stope with forces acted on an isolated layer and the floor
Figure 2-36: Distribution of the (a) lateral pressure on the wall and (b) vertical stress along the height of the backfill obtained by the numerical simulation and calculated by Eqs. (2-8) and (2-9) (taken from Aubertin et al. 2003) ... 49 Figure 2-37: Schematic diagram of an inclined stope with two non-parallel walls (taken from Ting
et al. 2014) ... 55 Figure 2-38: Partially submerged backfill in a vertical backfilled stope (take from Li and Aubertin
2009a) ... 58 Figure 2-39: Schematic diagram of a vertical backfilled opening (taken from Li and Aubertin
2009b) ... 59 Figure 2-40: Schematic diagram of a vertical backfilled stope (without water) with its access drift
and an isolated layer element (taken from Li and Aubertin 2009c). ... 63 Figure 2-41: Schematic diagram of a vertical backfilled stope in submerged condition and access
drift with an isolated vertical layer element (taken from Li and Aubertin 2009d)... 64 Figure 2-42: The confining structure to retain the backfill: a) permeable barricade (Rankine 2005);
b) impermeable bulkhead (taken from Revell 2007) ... 68 Figure 2-43: A barricade failure (taken from Revell and Sainsbury 2007) ... 68 Figure 2-44: Evolution and variation of pore water pressure for three cases: considering only
consolidation (represented by dotted lines), only shrinkage (represented by chain dotted lines), and combined effects of consolidation and shrinkage (represented by solid lines) (taken from Wood et al. 2016) ... 70 Figure 3-1: Deposition of slurried material in a (a) tailings pond (photo taken by Li 2014 in one
Québec mine) and (b) mine stope (photo taken by Li 2013 in another Québec mine) ... 73 Figure 3-2: Model of Gibson (1958) ... 75 Figure 3-3: (a) a backfilled stope considered in the numerical model of Shahsavari and Grabinsky
(2015); (b) comparisons between the PWP estimated by the proposed analytical solution [Eq. (3.12)] using h0 = 0.5 and n = -55 to 55 and those obtained by Shahsavari and Grabinsky (2015) through FLAC3D simulations. ... 78
Figure 3-4: (a) A conceptual physical model of backfilled stope with the top and base as pervious and under zero PWP condition; (b) numerical model of (a) built by SIGMA/W. ... 80 Figure 3-5: Distribution of the (excess) PWP obtained by numerical modeling and predicted by the
analytical solution along the height of the backfill at the end of the full filling of the plug with different hydraulic properties and filling rate: (a) cv = 0.1 m2/h, m = 0.2 m/h; (b) cv = 0.1 m2/h and m = 1.0 m/h. ... 81 Figure 3-6: Variation of the (excess) PWP distribution with different cv along the height of tailings
pond at the end of the filling operation, calculated with the proposed analytical solution [Eq. (3.12)] by considering a tailings pond 20 m high realized at a filling rate m = 4.8 m/year. .. 82 Figure 3-7: Variation of the (excess) PWP distribution predicted with the proposed analytical
solution with different filling rates along the height of the tailing at the end of filling operation. Calculation made by considering a tailing height of 20 m and a consolidation coefficient cv =
0.05 cm2/s. ... 83 Figure 3-8: Variation of the (excess) PWP distribution with different cv along the height of the plug
at the end of the plug filling operation, calculated with the proposed analytical solution [Eq. (3.12)] by considering plug height of 8 m and a filling rate m = 0.2 m/h. ... 84 Figure 3-9: Variation of the (excess) PWP distribution with different filling rates along the height
of the plug at the end of filling operation, calculated with the proposed analytical solution [Eq. (3.12)] by considering a plug height of 8 m and a consolidation coefficient cv = 0.1 m2/h. .. 85
Figure 3-10: Variation of the (excess) PWP distribution as a function of the (a) elevation z and (b) normalized elevation z/H at the end of filling operation with different backfill height, calculated with the proposed analytical solution [Eq. (3.12)] by considering a filling rate of m = 0.2 m/h and a consolidation coefficient of cv = 0.1 m2/h. ... 86
Figure 3-11: Variation and evolution of the PWP obtained by SIGMA/W with zero pressure (pw=0)
and non-zero PWP (pw≠0) on the top of each new added layer backfill for case a: k = 2.83×10
-7 m/s, m = 0.2 m/h and H = 8 m and case b: k = 2.83×10⁻⁶ m/s, m = 0.2 m/h and H = 8 m. .. 88 Figure 3-12: Sample calculations of the (excess) PWP using the proposed solution [Eq. (3.12)] with
Figure 3-13: Sensitivity analysis of h0 and n in application of the proposed analytical solution [Eq. (3.12)] to ensure stable results ... 93 Figure 4-1: Confining structures of mine slurried deposition: (a) a tailings dam on the surface; (b)
a barricade in an underground mine ... 99 Figure 4-2: A slurry deposition on an impervious base (Gibson 1958) ... 101 Figure 4-3: Simulation of a vertical sequentially backfilled stope with an impervious base (a)
schematic representation of the physical model; (b) numerical model built with SIGMA/W ... 105 Figure 4-4: Distributions of the excess PWP obtained by the numerical simulations and calculated
by the proposed analytical solution [Eq. (4.12)], using h0 = 0.3 and n = -91 to 91) within the backfill at the end of deposition: (a) cv = 0.1 m2/h, m = 0.2 m/h; (b) cv = 0.1 m2/h and m = 1.0 m/h ... 107 Figure 4-5: Distribution of excess PWP within the tailings pond at the end of the filling operation,
calculated using the proposed analytical solution [Eq. (4.12)] by considering a tailings height of 20 m at a filling rate of m = 4.8 m/year ... 108 Figure 4-6: Variation of the excess PWP distribution with different filling rates at the end of filling
operation, calculated by the proposed analytical solution [Eq. (4.12)] by considering a tailing height of 20 m and a consolidation coefficient cv = 0.05 cm2/s ... 109
Figure 4-7: Variation of the PWP distribution within the stope at the end of filling operation with different consolidation coefficients, calculated with the proposed analytical solution [Eq. (4.12)] by considering a backfill height of 8 m and a filling rate of m = 0.2 m/h ... 110 Figure 4-8: Variation of the PWP distribution at the end of filling operation with different filling
rates, calculated with the proposed analytical solution [Eq. (4.12)] by considering H = 8 m and cv = 0.1 m2/h ... 111
Figure 4-9: Variation of the PWP distribution at the end of the filling operation as the final backfill height increases from 8 to 32 m, calculated by the proposed analytical solution by considering a filling rate m = 0.2 m/h and a consolidation coefficient cv = 0.1 m2/h ... 112
Figure 5-2 : An underground mine backfilled stope: (a) physical model; (b) numerical model built with SIGMA/W ... 122 Figure 5-3: Distribution and evolution of the (excess) PWP along the height of the backfill during
and after the deposition on a pervious base, obtained by numerical modeling with SIGMA/W and calculated with the proposed solutions [Eqs. (5.4) and (5.7)]. Calculation made with cv = 0.1 m2/h, m = 0.2 m/h, γ = 20 kN/m3, and H = 8 m ... 123 Figure 5-4: Distribution and evolution of the (excess) PWP in tailings during and after the
deposition on a pervious base at a filling rate of m = 4.8 m/year (= 0.548 mm/h; Seneviratne et al. 1996) to a final height of H =20 m, calculated with the proposed solutions [Eqs. (5.4) and (5.7)]: (a) with cv = 0.018 m2/h for typical hard rock tailings; (b) with cv = 0.00057 m2/h for typical oil sand tailings ... 125 Figure 5-5: Distribution and evolution of the PWP along the height of a tailings after the end of
slurry deposition, calculated with the proposed solutions [Eqs. (5.4) and (5.7)] by considering
H = 20 m, m = 4.8 m/year, and γsat= 20 kN/m3 ... 126 Figure 5-6: Distribution and evolution of the PWP within tailings after the tailings deposition,
calculated with the proposed solution [Eqs. (5.4) and (5.7)] by considering H = 20 m, cv = 0.018 m2/h, and γsat = 20 kN/m3 ... 127 Figure 5-7: Distribution and evolution of the PWP within a backfilled stope during and after the
deposition, calculated with the proposed solution [Eqs. (5.4) and (5.7)] by considering H = 8 m, cv = 1 m2/h, and m = 0.5 m/h ... 128 Figure 5-8: Distribution and evolution of the (excess) PWP along the height of the backfill after
the end of backfilling operation, calculation made with the proposed solutions [Eqs. (5.4) and (5.7)] by considering H = 8 m and γ = 20 kN/m3: (a) with m = 0.2 m/h and different coefficient consolidations, cv; (b) with cv = 0.1 m2/h and different filling rates, m ... 129 Figure 5-9 : A sensitivity analysis on the value of nmax to ensure stable and accurate (excess) PWP
by using the MATLAB program ... 135 Figure 6-1: Accreting deposition of slurried material on an impervious base (Gibson 1958) .... 142
Figure 6-2: Sensitivity analysis of nmax to obtain stable and accurate excess PWP at x = 0 at t1 = 10 h by using the MATLAB program; calculation made with H = 8 m, γsat = 20 kN/m3, γw = 9.8 kN/m3, m = 0.5 m/h, cv = 1 m2/h, t0 = 16 h, and t1 = 10 h ... 146 Figure 6-3: (a) Physical and (b) numerical model built in the SIGMA/W for the backfilled stope ... 147 Figure 6-4: Distribution and evolution of the excess PWP obtained by the numerical modeling and
calculated with the proposed solutions [Eqs. (6.6) and (6.8)] along the height of the backfill before and after the end of deposition. Calculations made with cv = 1 m2/h, m = 0.2 m/h, γsat = 20 kN/m3, H = 8 m, μ = 0.2, E' = 864 kPa, k = 1.02×10⁻² m/h ... 148 Figure 6-5: Distribution and evolution of the excess PWP within a tailings pond during and after
the end of tailings deposition on an impervious base, calculated with the proposed solutions [Eqs. (6.6) and (6.8)]: (a) for hard rock tailings with H =20 m, γsat = 20 kN/m3, cv = 0.018 m2/h, and m = 0.548 mm/h; (b) for oil sand tailings with H =20 m, γsat = 13.3 kN/m3, cv = 0.00057 m2/h, and m = 0.548 mm/h... 150 Figure 6-6: Distribution and evolution of the excess PWP within a tailings dam after the tailings
deposition, calculated with the proposed solution [Eq. (6.8)] by considering H = 20 m, m = 4.8 m/year (= 0.548 mm/h), and γsat= 20 kN/m3 ... 151 Figure 6-7: Distribution and evolution of the excess PWP in a tailings slurry after the tailings
deposition for different filling rates m, calculated with the proposed solution [Eq. (6.8)] by considering H = 20 m, cv = 0.018 m2/h, and γsat = 20 kN/m3 ... 152 Figure 6-8: Distribution and evolution of the excess PWP in a backfilled stope before and after the
backfill deposition, calculated with the proposed solutions [Eqs. (6.6) and (6.8)] by considering H = 8 m, γsat = 20 kN/m3, cv = 1 m2/h, and m = 0.5 m/h ... 153 Figure 6-9: Distribution and evolution of the excess PWP in a backfilled stope during and after the
backfill deposition for different filling rates m, calculated with the proposed solution [Eqs. (6.6) and (6.8)] by considering H = 8 m, cv = 0.1 m2/h, and γsat = 20 kN/m3 ... 154 Figure 6-10: Distribution and evolution of the excess PWP in a backfilled stope during and after
the backfill deposition for different consolidation coefficient cv, calculated with the proposed solution [Eqs. (6.6) and (6.8)] by considering H = 8 m, m = 0.2 m/h, and γsat = 20 kN/m3 . 155
Figure 7-1: A vertical backfilled stope with saturated backfill and an isolated horizontal layer element. ... 170 Figure 7-2: Sensitivity analysis of nmax to obtain stable and reliable results of σh by using the
MATLAB program (plotted using Microsoft Excel); Calculation made with H = 40 m, B = 6 m, m = 0.2 m/h, cv = 5 m2/h, γsat = 20 kN/m3, γw = 10 kN/m3, ϕ' = 20, and K = Ka ... 176 Figure 7-3: Variation of the (a) vertical and (b) horizontal total stresses along the VCL of the stope
at the end of the stope filling for different consolidation coefficients, calculated with the Li and Aubertin (2009a)solution [Eq. (7.33)] and the proposed solution [Eqs. (7.31) and (7.32)]; calculation made with H = 40 m, B = 6 m, m =0.2 m/h, γsat = 20 kN/m3, γw = 10 kN/m3, ϕ' = 20, and K = Ka ... 177 Figure 7-4: (a) A backfilled stope; (b) the numerical model of Plaxis2D by taking into account the
plane of symmetry at x = 0 ... 179 Figure 7-5: Variation of the (a) excess PWP, (b) total and effective stresses along the VCL of the
stope at the end of filling operation (at t = 24 h and h = H = 12 m), obtained by numerical modeling with Plaxis2D and calculated with the proposed solution [Eqs. (7.10), (7.29), (7.30), (7.31) and (7.32)] using Rankine active coefficient Ka and Jaky at-rest coefficient K0; calculations made with H = 12 m, B = 4 m, m = 0.5 m/h, cv = 4 m2/h, γsat = 20 kN/m3, γw = 10 kN/m3, and ϕ' = 10... 180 Figure 7-6: Variation of the horizontal and vertical effective (a) and total (b) stresses along the
height of the stope at the end of filling for different consolidation coefficients cv, calculated with the proposed solution [Eqs. (7.29), (7.30), (7.31) and (7.32)] by considering H = 40 m,
B = 6 m, m = 0.2 m/h, γsat = 20 kN/m3, γw = 10 kN/m3, ϕ' = 20, and K = Ka ... 181 Figure 7-7: Variation of the horizontal and vertical effective (a) and total (b) stresses along the
height of the stope at the end of filling for different filling rate m, calculated with the proposed solution [Eqs. (7.29), (7.30), (7.31) and (7.32)] by considering H = 40 m, B = 6 m, cv = 5 m2/h,
γsat = 20 kN/m3, γw = 10 kN/m3,ϕ' = 20°, and K = Ka... 182 Figure 7-8: Variation of the horizontal and vertical effective (a) and total (b) stresses along the
(7.30), (7.31) and (7.32)] by considering H = 40 m, B = 6 m, m = 0.2 m/h, cv = 5 m2/h, γsat = 20 kN/m3, γ
w = 10 kN/m3, and K = Ka ... 183 Figure 7-9: Variation of the horizontal and vertical effective (a) and total (b) stresses along the
height of the stope at the end of filling, calculated with the proposed solution [Eqs. (7.29), (7.30), (7.31) and (7.32)] by considering H = 40 m, m = 0.2 m/h, cv = 5 m2/h, ϕ' = 20, γsat = 20 kN/m3, γ
w = 10 kN/m3, and K = Ka ... 184 Figure 8-1: Schematic diagram of a vertical backfilled stope with a pervious base and continuously
filled with slurried backfill. ... 196 Figure 8-2: Variation of σh with the value of nmax obtained by calculations with the MATLAB
program; calculated with H = 20 m, B = 4 m, m = 0.1 m/h, cv = 5 m2/h, γw = 10 kN/m3,γ = 20 kN/m3, ϕ' = 10 and K = Ka. ... 202 Figure 8-3: (a) The physical model and (b) numerical model of the backfilled stope built by
Plaxis2D after considering the vertical symmetry plane (VSP). ... 204 Figure 8-4 : Distribution of the (a) (excess) PWP, (b) total and (c) effective stresses along the VCL
at the end of backfill deposition (at t = 24 h and h = H = 12 m), obtained by numerical modeling results performed with Plaxis2D and calculated using the proposed solution [Eqs. (8.12), (8.28), (8.29) and (8.30)] by considering Ka; calculations conducted with H = 12 m, B = 4 m,
cv = 4 m2/h, m = 0.5 m/h, γ = 20 kN/m3, γw = 10 kN/m3, and ϕ' = 10°. ... 206 Figure 8-5: Distribution of the horizontal and vertical total (a) and effective (b) stresses with
different consolidation coefficient cv along the full height of the stope at the end of backfill accreting deposition, predicted by the proposed solution [Eqs. (8.28), (8.29) and (8.30)] by using: H = 40 m, B = 6 m, γw = 10 kN/m3, γ = 20 kN/m3, m = 0.2 m/h, ϕ' = 20°, and K = Ka. ... 207 Figure 8-6: Distribution of the horizontal and vertical total (a) and effective (b) stresses with
different filling rate m along the full height of the backfilled stope when the deposition ceases, predicted by the proposed solution [Eqs. (8.28), (8.29) and (8.30)] by considering H = 40 m,
B = 6 m, cv = 5 m2/h, γ = 20 kN/m3, γw = 10 kN/m3, ϕ' = 20 and K = Ka. ... 208 Figure 8-7: Distribution of the horizontal and vertical total (a) and effective (b) stresses with
deposition ceases, predicted by the proposed solution [Eqs. (8.28), (8.29) and (8.30)] by using
H = 40 m, B = 6 m, cv = 5 m2/h, m = 0.2 m/h, γw = 10 kN/m3, γ = 20 kN/m3 and K = Ka. .. 209 Figure 8-8: Distribution of the horizontal and vertical total (a) and effective (b) stresses along the
full height of the backfilled stope with different stope widths when the filling operation ceases, predicted by the proposed solution [Eqs. (8.28), (8.29) and (8.30)] by considering H = 40 m,
m = 0.2 m/h, cv = 5 m2/h, γ= 20 kN/m3, γw = 10 kN/m3, ϕ' = 20, and K = Ka. ... 210 Figure 9-1: Solid-like high viscosity paste backfill (taken from Minewiki 2017) ... 223 Figure 9-2: (a) A mine stope being filled with a fluid-like paste backfill; (b) A barricade with
draining water at the base ... 224 Figure 9-3: Typical grain size distribution curve of hard rock mine tailings (taken from Bussière
2007) ... 225 Figure 9-4: Grain size distribution curve of the tested mine tailings. ... 226 Figure 9-5: A slump test (a) before and (b) after the removal of the cylinder mold. ... 227 Figure 9-6: Instrumentation of the pressure measurement: (a) schematic presentation; (b) a
photograph of the instrumentation. ... 228 Figure 9-7: Calibration curves of the stress sensors: (a) at the column center and (b) close to the
wall... 229 Figure 9-8: The state of the placed backfill in the column with (a) very low solid content (Cw =
62.5%), (b) intermediate solid content (Cw = 75.5%) and (c) very high solid content (Cw = 78.4%). ... 230 Figure 9-9: Measured (a) slump height and (b) slope angle as a function of the solid content. .. 232 Figure 9-10: Schematic presentation of the (a) initial and (b) final geometry and state of the backfill
during the slump test with a cylindrical mold (adapted from Pashias et al. 1996)... 233 Figure 9-11: Variation of the (a) slope angle α and (b) bottom diameter d2 with the normalized
slump height S', obtained from the slump tests and estimated by applying the proposed solutions. ... 235
Figure 9-12: Measured vertical total stresses (a) stress ratio (b) and normalized stresses (c) at the center and close to the wall as a function of the solid content of the backfill... 237 Figure 9-13: Variation of vertical total stress ratio σv2/σv1 with the normalized slump height S',
obtained by measurements and calculated by the proposed solution [Eqs. (9.15) and (9.16)] using r = 7.75)). ... 238
LIST OF SYMBOLS AND ABBREVIATIONS
Symbols
A sectional area of the silo (m2)
C compressive force (kN) Cu uniformity coefficient
Cc curvature coefficient
Cw solid content (%)
D10 particle size at which 10% of particles can pass the sieve (mm)
D60 particle size at which 60% of particles can pass the sieve (mm)
E' drained Young’s modulus (MPa)
G shear modulus Gs specific gravity
H final height at the end of deposition (m) Hd height of the access drift (m)
He excess PWP in water height (m)
K earth pressure coefficient Ka active earth pressure coefficient K0 at-rest earth pressure coefficient
M' drained constrained modulus (MPa) L length of underground structure (m) Pw pore water pressure (kPa)
Pw0 pore water pressure at the end of deposition (kPa)
Pw1 pore water pressure after the end of deposition (kPa)
S slump height (m)
S' normalized slump height (m)
T dimensionless time factor U circumference of the silo (m) V vertical force (kN)
W weight of the backfill layer element (kN) Wd width of the access drift (m)
a and b two parameters in Li and Aubertin (2008) to control the normal stress distribution
curvature
c cohesion (kPa)
ci cohesion of the ith fill-wall interface (kPa)
cv consolidation coefficient (m2/s)
c' effective cohesion of the fill (kPa) d inner diameter
e void ratio
h depth from the surface of the backfill (m) h0 height of unyielded region (m)
h'0 normalized height of unyielded region
h1 height of yielded region (m)
h'1 normalized height of yielded region (m)
k hydraulic conductivity (m/s)
ksat saturated hydraulic conductivity (m/s)
l length of stope (m) m filling rate (m/h)
n series number
q surcharge on top of the backfill (kPa)
qu compressive strength (kPa)
t filling time (h)
t0 time during the accreting deposition (h)
t1 time start from the moment when the deposition ceases (h)
u excess pore water pressure (kPa) u0 the hydrostatic pore pressure (kPa)
u1 excess PWP after the end of deposition (kPa)
w width of the stope (m) wL liquid limit
wP plastic limit
x distance from the center line of the stope (m)
z elevation of the calculation point from the base (m) αi backfill state angle on the ith wall (°)
β inclination angle to the horizontal surface (°) γ unit weight of the backfill (kN/m3)
γ' submerged unit weight of the slurry (kN/m3)
γsub submerged unit weight of backfill (kN/m3)
γsat saturated unit weight of backfill (kN/m3)
ξ arbitrary integration parameter σ' effective stress (kPa)
σv vertical total stress (kPa)
σ'v vertical effective stress (kPa) σ'h horizontal total stress (kPa)
σvH vertical stress at the bottom of the stope (kPa)
σvx vertical stress across the stope width (kPa)
σv0 vertical stress at the centerline of the stope (kPa)
δ friction angle along the interfaces between the fill and surrounding walls (°) δi friction angle of the ith fill-wall interface (°)
ϕ' effective friction angle between the backfill and surrounding walls (°) ϕ internal friction angle of the backfill (°)
ϕ0 friction angle correction parameter
λ1, λ2 model parameters
v Poisson’s ratio
µ friction coefficient along the wall τy yield stress (kPa)
τ'y normalized yield stress (kPa)
Abbreviations
ASTM American Society for Testing and Materials C-S-H Calcium silicate hydrate
CPB Cemented paste backfill DF Distribution factor
FLAC Fast Lagrangian Analysis of Continua FLD Full lateral drainage
HW Hanging wall KB Kanowna Bell MATLAB Matrix laboratory PLD Partial lateral drainage PWP Pore water pressure
UCS Unconfined compressive strength VCL Vertical center line
LIST OF APPENDICES
APPENDIX A – AN EXPERIMENTAL STUDY OF THE VERTICAL AND HORIZONTAL STRESSES AND EARTH PRESSURE COEFFICIENT IN A VERTICAL BACKFILLED OPENING ... 276 APPENDIX B – AN EXPERIMENTAL STUDY TO INVESTIGATE THE EFFECTIVENESS
OF TYPICAL LUBRICANTS IN REDUCING THE SIDEWALL FRICTION ... 296 APPENDIX C – ADDITIONAL RESULTS RELATED TO CHAPTER 3 ... 322 APPENDIX D – ADDITIONAL RESULTS RELATED TO CHAPTER 4 ... 325 APPENDIX E – ADDITIONAL RESULTS RELATED TO CHAPTER 6 ... 328 APPENDIX F – ADDITIONAL RESULTS RELATED TO CHAPTER 7 ... 331 APPENDIX G – ADDITIONAL RESULTS RELATED TO CHAPTER 8 ... 336 APPENDIX H – ARTICLE 8: A CONCEPTUAL ANALYTICAL SOLUTION FOR
ESTIMATING THE SHORT-TERM PRESSURE OF PASTE FILL VARYING FROM VISCOUS TO LIQUID STATE, PLACED IN MINE STOPES ... 338 APPENDIX I – ARTICLE 9: ANALYTICAL AND EXPERIMENTAL STUDIES OF THE
EVOLUTION OF THE EXCESS PORE WATER PRESSURE DURING THE DEPOSITION OF A SLURRIED MATERIAL ... 351
CHAPTER 1
INTRODUCTION
1.1 Statement of the problem
Mining industry is an important part of Canada’s national economy. Despite the production of valuable minerals, the excavation of ore body also generates large mined-out voids (stopes), which need to be properly managed to improve the ground stability (Darling 2011). The extraction of the commercially valuable minerals from the ore body is also accompanied with the generation of large amount of mine wastes in terms of waste rock and tailings.
The mine wastes can be disposed of on the surface or returned to underground to fill the void spaces. In the former, the tailings are usually transported by pipes and confined by tailings dams while the waste rocks are disposed as piles. They can also be co-disposed with the installation of waste rock inclusions in the tailings impoundments to accelerate the drainage and consolidation (Bolduc and Aubertin 2014; Ferdosi et al. 2015). This mine waste management can pose great environmental and geotechnical challenges associated with the geotechnical and geochemical instabilities (Bussière 2007). When the waste rocks are reactive, the waste rock piles can be the generator of the acid mine drainage due to the high air and water permeability of the piles (Sracek et al. 2004; Molson et al. 2005).
Compared to the surface disposal method, underground mine backfilling can bring several advantages, including increased ore recovery, reduced mineral dilution, improved ground stability and reduced surface disposal of mine wastes (Hassani and Archibald 1998; Jung and Biswas 2002; Potvin et al. 2005). Not surprisingly, it has become a common practice in many underground mines around the world.
In general, backfill can be classified as rock fill, hydraulic fill, and paste backfill. Among them, the hydraulic and paste backfills are advantageous as they can be transported by pipes. However, they must contain sufficient water to facilitate their transportation by pipes. A confining structure, called barricade, needs to be built at the base of the stope to retain the slurried backfill in the stope. The stability of barricade is an important concern as the failure of barricade can lead to the trap of equipment, huge economic lose and even lose of lives (Grice 1998; Sivakugan et al. 2006a, 2006b, 2013; Yang et al. 2017). The barricade stability is generally determined by the backfill pressure
during and shortly after the end of the backfilling operation. It is thus critical to have a good understanding of the hydro-geotechnical behavior of the backfill during and after the deposition. When tailings or slurried backfills are placed in a confining structure (dam or mine stope), the solid particles tend to settle down under the gravity. The tailings or the backfills tend to become denser and expel the pore water out of them. As the tailings or the backfills usually have low permeability, the drainage will be limited, resulting in the generation of excess pore water pressure (PWP). When the dissipation of excess PWP reaches a certain degree and the solid particles contact each other, effective stresses start to generate. This process is called self-weight consolidation.
If the slurried material is deposited at a very high filling rate to a high final height, excessive high PWP and pressure can generate in the slurried material, which may lead to the failure of dams or barricades. If the filling rate is low, drainage and excess PWP dissipation can take place during the filling operation, resulting in the generation of effective stresses. For the case of mine backfilled stopes, the shear stresses can generate along the fill-wall contact interfaces. For a narrow mine stopes, a part of the load can be transferred from the backfill to the stiff surrounding walls, resulting in smaller backfill stresses than the overburden pressure. This phenomenon is called arching effect, which can lead to the vertical stresses in the backfilled stopes smaller than the overburden pressure. The stability of the tailings dams and backfill barricades requires a good understanding of all the above-mentioned aspects during and shortly after the deposition of the slurried materials.
1.2 Objectives of the research
The main objective of this research is to investigate the hydro-geotechnical behavior of slurried materials during and after the deposition in a confining structure (tailings impoundment or mine stope). This has been achieved through the realization of the following specific objectives:
1) To evaluate the excess PWP in slurried materials during and after the deposition;
2) To evaluate the PWP and stresses in backfilled stope during or shortly after the placement of the slurried backfill by considering self-weight consolidation and arching;
3) To evaluate the “short-term” pressure in paste backfilled stopes by considering different solid contents of the backfill.
1.3 Contributions
The realization of the project leads to the publication or submission of the following peer-reviewed journal and conference papers:
J.1 Zheng J, Li L, Mbonimpa M, Pabst T. (2018) An analytical solution of Gibson’s model for estimating the pore water pressures in accreting deposition of slurried material under one-dimensional self-weight consolidation. Part I: Pervious base. Indian Geotechnical
Journal. 48(1): 72-83. This article is presented in Chapter 3.
J.2 Zheng J, Li L, Mbonimpa M, Pabst T. (2018) An analytical solution of Gibson’s model for estimating pore water pressures in accreting deposition of slurried material under one-dimensional self-weight consolidation. Part II: Impervious base. Indian Geotechnical
Journal. 48(1): 188-195. This article is presented in Chapter 4.
J.3 Zheng J, Li L, Li YC, Mbonimpa M. (2018) A new solution to evaluate the PWP during and after slurry deposition on a pervious base. Environmental Geotechnics. Revision submitted in August 2018. This article is presented in Chapter 5.
J.4 Zheng J, Li L, Li YC, Mbonimpa M. (2018) A solution to estimate the excess PWP during and after slurry deposition on an impervious base. Geomechanics and Engineering. Submitted in July 2018. This article is presented in Chapter 6.
J.5 Zheng J, Li L, Li YC. (2018) A solution to estimate the total and effective stresses in backfilled stopes with an impervious base during the filling operation. International Journal
for Numerical and Analytical Methods in Geomechanics. Submitted in July 2018. This article
is presented in Chapter 7.
J.6 Zheng J, Li L, Li YC. (2018) Total and effective stresses in backfilled stopes during the fill placement on a pervious base for barricade design. Minerals. Submitted in November 2018. This article is presented in Chapter 8.
J.7 Zheng J, Li L. (2018) Variation of the “short-term” pressures of paste backfill as a function of the solid content. Canadian Geotechnical Journal. Submitted in November 2018. This article is presented in Chapter 9.
J.8 Zheng J, Li L. (2018) An experimental study of the vertical and horizontal stresses and earth pressure coefficient in a vertical backfilled opening. To be submitted in a peer review journal. Main results are presented in Appendix A.
J.9 Zheng J, Li L, Daviault M. (2018) An experimental study to investigate the effectiveness of typical lubricants in reducing the sidewall friction. To be submitted in a peer review journal. Main results are presented in Appendix B.
C.1 Zheng J, Li L, Mbonimpa M, Pabst T. (2017) Analytical solutions of Gibson’s model for estimating the pore water pressures in accreting deposition of slurried material under one-dimensional self-weight consolidation. Published in the Proceedings of 70th Canadian Geotechnical Conference, Ottawa, Canada.
C.2 Li L, Zheng J. (2017) A conceptual analytical solution for estimating the short-term pressure of paste fill varying from viscous to liquid state, placed in mine stopes. Published in the Proceedings of 70th Canadian Geotechnical Conference, Ottawa, Canada.
C.3 Zheng J, Li L, Daviault M. (2017) An experimental study of the effectiveness of lubricants in reducing sidewall friction. Published in the Proceedings of 19th International Conference on Civil, Environmental and Infrastructure Engineering, Kyoto, Japan.
C.4 Zheng J, Li L. (2018) Analytical and experimental studies of the evolution of the excess pore water pressure during the deposition of a slurried material. Published in the Proceedings of GeoEdmonton 2018, Canadian Geotechnical Society.
C.5 Zheng J, Li L (2018) A solution to estimate stresses in backfilled stopes by considering self-weight consolidation and arching. Published in the Proceedings of 8th international congress on environmental geotechnics, Hangzhou, China.
The realization of the project contributes to a better understanding of the hydro-geotechnical behavior of slurried materials during and after the deposition in a tailings impoundment or underground mine stope. Analytical, numerical and experimental solutions presented in this document constitute useful tools to evaluate the PWP, effective and total stresses in the tailings impoundments or underground mine backfilled stopes during and after the deposition. The proposed analytical solutions can be useful for geotechnical and mining engineers to conduct
parametric sensitivity analysis for evaluating the stability of tailings dams or underground mine stope barricades in the preliminary stage of projects.
1.4 Organization
The thesis is organized in a paper-based format as follows:
Chapter 1 gives a general introduction and presents the problematics of the thesis. The main objective, contributions and organization of the thesis are also elucidated.
Chapter 2 presents a comprehensive literature review of the background information, including the deposition of slurried materials in tailings impoundments or underground mine stopes, properties of tailings and backfills, pressures and stresses estimation in backfilled stopes shortly and long-time after the slurry deposition.
Chapters 3 and 4 (Articles 1 and 2) present the analytical solutions based on the Gibson (1958) model for estimating the PWP during the deposition of slurried material on pervious and impervious bases, respectively.
Chapters 5 and 6 (Articles 3 and 4) present the solutions to estimate the excess PWP in slurried material after the end of the deposition of slurried material on pervious and impervious bases, respectively.
Chapters 7 and 8 (Articles 5 and 6) present new solutions to evaluate the effective and total stresses in backfilled stopes during the filling operation on pervious and impervious bases, respectively. Chapter 9 (Article 7) illustrates the variation of the short-term pressure as a function of the solid contents shortly after the placement of the paste backfill in a column.
Chapter 10 presents a summary and discussion of the presented results in the thesis. The conclusions and recommendations are presented in Chapter 11.
CHAPTER 2
LITERATURE REVIEW
This chapter first presents the different mining methods and the application of mine backfill for different engineering purposes. The hydraulic and mechanics properties of tailings and three types of backfills (i.e. hydraulic fill, paste fill and rock fill) are then presented. Focus is given on the self-weight consolidation of slurried materials and evaluation of excess PWP and stresses in tailings impoundments and underground mine backfilled stopes.
2.1 Underground mining with backfill
When ore bodies are in a deep position or when surface mining method is restricted by the environmental or other issues, underground mining method has to be adopted. This mining method can be divided into three categories: naturally supported methods (e.g. room and pillar, sublevel stoping and shrinkage stoping), artificially supported methods (e.g. cut and fill, drift and fill), and caving methods (e.g. block caving, sublevel caving and longwall) (Brady and Brown 1993). Several variants mining methods based on the three basic types of mining methods have also been developed and applied in practice. In the following subsection, the mining methods with the application of backfill will be presented. Emphasis is given on the functions and challenges associated with the use of backfill.
2.1.1 Underground mining methods and the possible application of backfill
Naturally supported methods
Naturally supported methods refer to the methods with the ore pillars being left in the mined-out voids to support the mine roof and rock walls. This method is usually applied for low-grade orebodies as the ore recovery is low in the ore pillars. Backfill is not very common from an economic point of view as the ore recovery cannot justify the backfill cost (Potvin et al. 2005). However, backfill can also be used to help recovery the ore pillars or/and provide support for the adjacent excavation. The naturally supported method is thus jointly used with the artificially supported method. The combined methods with the application of backfill is also presented in this subsection.
Room and pillar mining
Room and pillar mining refers to the method by extracting the horizontal openings to form the rooms and leaving pillars to support the roof and rock walls (Darling 2011), as shown in Fig. 2-1. The extraction of ore body can probably cause mine roof caving and wall to wall convergence. Backfill can thus be used to fill the underground openings, which can help to recover the ore bodies in the pillars and improve the rock wall and ground stability (Hunt 1988; Roberts et al. 1999; Tesarik et al. 2009). The backfill is first placed around the perimeter pillars and then towards to the center of the openings. The confining structure, such as barricade or fence needs to be built to retain the backfill in place. The barricade stability and the strength of the backfill to support the roof and rock wall are the critical concerns.
Figure 2-1: Plan view of a room-and-pillar mine (taken from Darling 2011)
Sublevel open stoping
Sublevel open stoping is a very common mining method in North America and accounts for 60% of all the underground mines (Pakalnis and Hughes 2011). It is normally used for competent and steep ore bodies with the dipping angle from 50° to 90°, which are surrounded by competent rock walls. The sublevel open stoping has mainly four types, including blasthole stoping, long-hole stoping, shrinkage stoping and VCR (vertical crater retreat).
Fig. 2-2(a) shows the schematic diagram of the blasthole stoping. In this mining method, ore bodies are broken using ring drilling or long parallels blast holes, which are drilled by top-hammer drills. The blasted ore bodies fall to the stope base under the effect of gravity, which are then extracted and collected from the drawpoints (Darling 2011). The long-hole stoping can be considered as one
variation of the blasthole stoping, as shown in Fig. 2-2(b). The hole can be as long as 100 m drilled by in-the-hole (ITH) technique (Hamrin 2001). Backfill can be used in blasthole and long-hole stoping to recover ore pillars and improve the ground stability. The uncemented backfill can be used when the pillars are not recovered.
Figure 2-2: Schematic diagram of the (a) blasthole stoping and (b) long hole stoping (taken from Hamrin et al. 2001)
Shrinkage stoping is a vertical overhand stoping method, as shown in Fig. 2-3. It is usually applied for ore bodies, which are very narrow or not suitable for other mining methods. In this mining method, about 60% of the ore bodies are left in the stope to support the rock walls and provide work platform for the operators. When the mining operation is completed, the remaining broken ore bodies can be extracted from the stopes. Backfill is usually not necessary in the shrinkage stoping as the broken ore bodies remained in the stope can have the same effect. If all of the broken ore bodies are extracted from the stope after the completion of mining, uncemented rock fill can also be used to improve the stope stability.