Identification and classification of geometrîcal parameters related to foot pathologies Par Mehrdad Anbarian Département de kinésiologie
G
Thèse présentée à la Faculté des études supérieures en vue de l’obtention du grade de
Philosophiae Doctor (Ph.D.) en sciences dc l’activité physique
Juin, 2005
3
)
7
Direction des bîbliothèques
AVIS
L’auteur a autorisé l’Université de Montréal à reproduire et diffuser, en totalité ou en partie, par quelque moyen que ce soit et sur quelque support que ce soit, et exclusivement à des fins non lucratives d’enseignement et de recherche, des copies de ce mémoire ou de cette thèse.
L’auteur et les coauteurs le cas échéant conservent la propriété du droit d’auteur et des droits moraux qui protègent ce document. Ni la thèse ou le mémoire, ni des extraits substantiels de ce document, ne doivent être imprimés ou autrement reproduits sans l’autorisation de l’auteur.
Afin de se conformer à la Loi canadienne sur la protection des renseignements personnels, quelques formulaires secondaires, coordonnées ou signatures intégrées au texte ont pu être enlevés de ce document. Bien que cela ait pu affecter la pagination, il n’y a aucun contenu manquant. NOTICE
The author of this thesis or dissertation has granted a nonexclusive license allowing Université de Montréal to reproduce and publish the document, in
part or in whole, and in any format, solely for noncommercial educational and research purposes.
The author and co-authors if applicable retain copyright ownership and moral rights in this document. Neither the whole thesis or dissertation, nor substantial extracts from it, may be printed or otherwise reproduced without the author’s permission.
In compliance with the Canadian Privacy Act some supporting forms, contact information or signatures may have been removed from the document. While this may affect the document page count, it does flot represent any loss of content from the document
Cette thèse intitulée:
Identification and classification of geometrical parameters related to foot pathologies
présentée par: Mehrdad Anbarian
a été évaluée parunjury compose des personnes suivantes:
Président du jury Directeur de recherche Codirecteur
Membre du jury: Examinateur externe
Représentant du doyen de la FES:
Claude Alain, Ph.D. Paul Allard, Ph.D., P. Eng. Nader Farahpour, Ph.D. François Prince, Ph.D. Georges Dafleau, Ph.D. Alain Vinet, Ph.D.
RÉSUMÉ
Malgré que la forme et la fonction du pied aient fait l’objet de plusieurs études, la classification exacte des pathologies demeure limitée. Cette difficulté repose en partie sur les méthodes d’évaluation des désordres aux pieds
elles-mêmes, telles l’inspection visuelle, les mesures anthropométriques, la
radiographie, et sur les quelques mesures qui caractérisent la morphologie du pied. La présente étude a été menée dans le but de fournir une technique fiable et non-invasive de l’évaluation du pied; elle vise également à identifier les paramètres géométriques qui caractérisent le mieux les différences entre le pied plat (PP), la pronation (PR), le pied creux (PC), la supination (SU) et le pied normal (PN), pour ensuite les classer dans les groupes appropriés.
Quinze sujets ont d’abord été évalués pour tester la fiabilité de l’instrument utilisé pour cette étude. Ensuite, 321 pieds ont été classés cliniquement dans l’une des quatre pathologies mentionnées plus haut et au sein du groupe des sujets normaux. Pour la description de la géométrie des pieds, 15 angles ont été mesurés à partir d’images encodées de couleur provenant de quatre prises de vue distinctes. L’analyse en compdsantes principales (ACP) et l’analyse discriminante pas à pas (AD) ont servi à déterminer les caractéristiques géométriques des différents groupes.
Trois modèles ont ensuite été élaborés, la ACP, la AD et la technique de Logique floue, pour classer les pieds étudiés dans leurs groupes respectifs. Les résultats ont démontré qu’une seule série d’images était suffisante pour mesurer
C
les angles du pied avec un 1CC de 0.99 pour la fiabilité intra-évaluateur et un 1CC de 0,89 pour la fiabilité inter-évaluateur. Les ANCOVA ont ensuite fourni une description clinique quantitative des troubles du pied. Ainsi, la ACP a permis d’identifier neuf angles tandis que la AD a permis d’identifier 10 des 15 angles des différentes vues anatomiques en tant que paramètres géométriques les plus pertinents. Ensuite, en utilisant les trois modèles de l’ACP, AD et de Logique floue, les pieds ont été classés dans leurs groupes respectifs avec untaux moyen de classification de 76,7 %. Parmi les trois méthodes de
classification, la Logique floue a produit la plus haute précision. La AD a fourni une classification acceptable tandis que la ACP a été de piètre performance. Quatre-vingt-quatorze nouveaux pieds ont été utilisés pour la prédiction. L’exactitude des prédictions a été de l’ordre de 39,1 ¾, 53,8 ¾ et 76,6 ¾ pour la méthode de la ACP, de la AD et de la Logique floue respectivement.
Cette étude a donc permis d’élaborer une nouvelle technique fiable pour l’évaluation de l’attitude du pied face à ses pathologies. Elle a également fourni des approches innovatrices pour l’identification et la classification des types de pied associés aux nombreux paramètres géométriques des différentes vues anatomiques.
Mots clés: Pied. Classification de types de pieds, Le pied plat, Pronation. Le pied creux, Supination. Membre inférieur. Analyse en composantes principales, Analyse discriminante, Logique floue
ABSTRACT
Foot shape and function has been the core of many studies, however successftil classification of the deformed foot remains limited. The difficulty lies in part on the means of assessing methods of foot disorders such as visual inspection, anthropometric measures, radiography, etc. and on few measurements to characterize foot morphology. The present study was conducted to provide a reliable non-invasive technique for foot assessment. and to identify the geometric parameters that best characterize the differences between pes planus (P?), pronation (PR), pes cavus (PC), supination (SU) and able-bodied (AB) foot types and classify them into their appropriate groups.
First, fifteen subjects were evaluated to test the reliability of the instrument used in this study. Then 321 feet were clinically sorted into the above-mentioned four pathologies and into an able-bodied group. Fifieen angles were then measured on color-coded images taken from four views to describe the geometry of the feet. Principal component analysis (PCA) and stepwise discriminant analysis (SDA) were performed to determine the relevant geometric characteristics of the groups. Afierwards, three models were developed. namely the PCA. the SDA and the flizzy logic technique to classify the feet into their respective groups. The resuits demonstrated that a single set of images was sufficient for foot angles measurement with an 1CC of 0.99 for intratester and 0.89 for intertester reÏiability. ANCOVA then provided a
C
quantitative clinical description of foot ailments. In doing so, PCA identified 9 angles while $DA characterized 10 out of 15 angles from different anatomical views as the rnost relevant foot geometric parameters. Then, using the three PCA. SDA and Fuzzy logic models feet were classified in their respective groups with a mean classification rate of 76.7%. Among the three classification methods, fuzzy logic performed with the highest accuracy. The SDA provided an acceptable classification while PCA performed poorly. Ninety-four new feet were used for prediction. Correct prediction using PCA, SDA and Fuzzy logic were 39.1%, 53.8% and 76.6% respectively.This study provided a novel and reliable technique to assess foot attitude related to foot pathologies. It also presented new approaches to identify and classify foot types associated with several geometrical parameters taken from different anatomical views.
Key Words: foot. Foot type classification, Pes planus, Pronation. Pes cavus.
Supination, Lower extremity, Principal Component Analysis, Discriminant Analvsis, fuzzy logic
C)
TABLE CONTENTS RÉSUMÉABSTRACT y
LIST 0F TABLES xi
LIST 0F FIGURES xiii
LIST 0F ABBREVIATIONS xix
DEDICATION xxi
ACKNOWLEDGEMENTS xxii
Chapter 1
1. INTRODUCTION 1
1.1 Epidemiology and etiology of foot problems 2
1.2 Common foot deformities 3
1.2.1 Pespianus 4
1.2.2 Pronation 5
1.2.3 Pescavus 5
1.2.4 Supination 6
1.3 Clinical examination methods 8
O
Chapter 22. REVIEW 0F LITERATURE 11
2.1 Review of the foot and ankle measurement techniques 11
2.1.1 Visual techniques 12
2.1.2 Anthropornetric measurernent techniques 15
2.1.3 Radiographic techniques 16
2.1.4 Goniornetry 17
2.1.5 Video-based systems 1$
2.2 Reliability of the foot evaluation systems 22
2.3 Joint angle parameters 26
2.4 Foot type classification methods 31
2.5 Specific objectives ofthis thesïs 35
Chapter 3
3. METHOUS 37
3.1 Color-coded video-based system 37
3.2 Angular measurements 41
3.3 Reliability ofthe color-coded video-based system 4$
3.3.1 Subjects and preparation 49
3.3.2 Reliability assessrnent procedure 49
3.4 Morphological description of foot pathologies 51
3.5.1 Principal component analysis . 54
3.5.2 Stepwise discriminant analysis 55
3.5.3 Fuzzy logic technique 56
3.6 Predictïon from new foot values 60
Chapter 4
4. RESULTS 62
4.1 Reliabitity analysis 62
4.1 .1 Intratester and number of trials reliability tests 63
4.1.2 Intertester reliabilitv 64
4.1.3 Short and long-term reliabilities 67
4.2 Identification of the foot parameters 68
4.3 Foot type classification 74
4.4 Foot type prediction 89
Chapter 5
5. DISCUSSION 9$
5.1 Reliability of a color-coded video-based system for foot
assessment 98
5.2 Foot angles 103
5.3 Foot types classification methods 106
5.5 The study limitations .112
5.6 Future studies 114
Chapter 6
6. CONCLUSION 117
G
LIST 0F TABLESTable 3.1. The 15 foot angles measured on: antero-posterior (AP); postero
anterior (PA); medial (MED) and posterior plantar flexion (PF) views 42
Table 3.2. Characteristics of 189 subjects (321 feet) by age, height, mass and gender. Values are presented as mean, and standard deviation in parentheses. yrs representative of years; cm representative of centimeter; kg representative of kilograms; M representative of male; f representative of female and n
representative ofnumber 53
Table 4.1. Mean intertester 1CC values ofall 15 angles for the right and lefi feet separately. Views and angles abbreviations are given previously in chapter three
(Table 3.1) 66
Table 4.2. Mean and standard deviations of the angles measured in degrees for alI five foot types. Views and angles abbreviations are given in Table 3.1. SD
represents standard deviation 70
Table 4.3. Correlation coefficients in the loading values for the first five principal components (PCs) of the 15 measured angles. Views and angles
E
Table 4.4. Structure matrix of four discriminant fiinctions. Views and anglesabbreviations are given in Table 3.1 82
Table 4.5. Chi-square values for classification of foot types using PCA, SDA and fuzzy logic models. Abbreviations of groups were described in f igure 4.5.
New abbreviations: Significant (sig), Non-significant (NS) $8
Table 4.6. Chi-square values for prediction of foot types using PCA, SDA and
Q
LIST 0F FIGURESFigure 1.1. Pes planus deformity in the left side in weight-bearing position 4
Figure 1.2. Pronation of the lefi side of the foot in weight-bearing position
(adapted from Root et al., 1977) 5
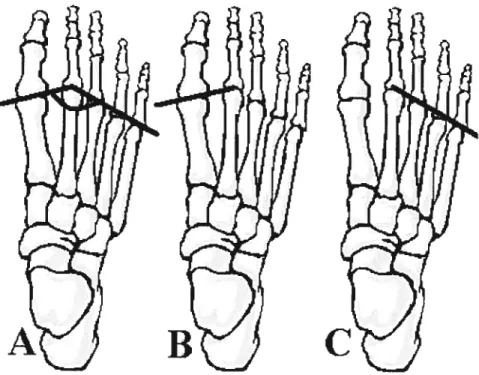
Fïgure 1.3. Pes cavus, A) media! ,B) antero-posterior, C) postero-anterior 6
Figure 1.4. Right-side supination ofthe foot (adapted from Root et al., 1977)...7
Figure 2.1. Podoscope with a subject in weight-bearing position (from Neale
andAdams, 1981) 13
Figure 2.2. footprint ofright foot: A) non-contact area, B) contact area 15
Figure 2.3. Image from of antero-posterior view of feet taken with a co!or
coded video-based system 21
Figure 2.4. Subtalar joint measurement: A) une bisecting distal third ofthe leg,
B) une bisecting the calcaneus and C) hindfoot angle 2$
Figure 2.5. A) Meschan angle of right foot formed by: B) une of first and
Figure 2.6. Djian-Annonier angle (adapted from Djian and Aonier, 1968)...30
Figure2.7. The Mearv-Tomeno une (adapted from Shereff. 1991) 31
Figure 3.1. A) Color-coded video-based system setting. B) A digital camera is positioned on a vertical rail with two fluorescent lights on its either side. The
camera-subject distance is 1.7 meters 38
Figure 3.2. A single trial of images taken by Biovizion system, a) antero
posterior view of both feet; b) postero-anterior view of both feet; e) media! view of the right foot; d) medial of the left foot; e) posterior view of the right foot while plantar flexion and f) posterior view of the lefi foot while plantar
flexion 40
Figure 3.3. The black and white (A) picture ofmedial view ofthe right foot and
(B) its corresponding color-coded image 41
Figure 3.4. The classical foot pararneters defining the antero-posterior view, measured on the color-coded image of the lefi foot: A) references required for measurements; B) angular measurements and C) angles shown schematicali on
figure 3.5. The medial base angle in antero-posterior view, measured on the riglit foot image: A) references required for the measurement; B) angular measurement and C) angle shown schematically on the foot 44
Figure 3.6. The foot parameters defining the postero-anterior view, measured on the color-coded image: A) identification of the references required for measurements; B) angular measurements and C) angles shown schematically on
the feet 45
Figure 3.7. Foot parameters defining the medial view, measured on the color coded image of the right foot: A) references required for measurements; B) first metatarsal inclination; C) calcaneus inclination and D) angles shown
schematically on the foot 46
Figure 3.8. The Meary-Tomeno angle on the coÏor-coded image of the right foot: A) angular measurement and B) angle shown schematically on the
foot 46
Figure 3.9. The foot parameters defining the posterior plantar flexion view, measured on the lefi foot color-coded image: A) references required for measurernents; B) angular measurements and C) angles shown schematically on
Figure 3.10. A) Schematic diagram of stages for foot type classification using fuzzy model and B) membership functions for characterization of the pathological feet based on the hindfoot (lefi) and the Djian-Annonier (right)
angles 59
Figure 4.1. The mean of the 1CC values for ail parameters for first two trials up
to ail seven triais 63
Figure 4.2. The mean 1CC values of the foot angular parameter, measured in all four views of the foot. AP, (antero-posterior); PA, (postero-anterior); Med,
(medial). and PF, (j)lantar flexion) 64
Figure 4.3. The mean ICCs for ail of the 30 angular parameters of both feet of
10 subj ects that were obtained by two to five testers 65
Figure 4.4. The mean 1CC values for short-term (am and pm) and the long-term (am and one week after) of 10 subjects evaluated in the moming, in the
afiemoon ofthe same day and afier a one week interval 68
Figure 4.5 . Plot of the first and second principal component scores for all five
foot types using a PCA. Abbreviations: AB, (able-bodied); PP, (pes planus); PR,
Figure 4.6. Plot of the first against second principal component scores for individual groups are presented for: A) able-bodied: B) pes planus; C)
pronation; D) pes cavus and E) supination using PCA for classification $0
figure 4.7. Plot of first and second functions of the discriminant analysis
method for ail five groups. Abbreviations for groups were described in Figure
4.5. New abbreviation: OC, for group centroid with identity of each
group 83
Figure 4.8. Plot of the first against second functions scores for individual five groups are presented for : A) able-bodied; B) pes planus; C) pronation; D) pes cavus and E) supination using $DA for classification. Abbreviations: OC, for group centroids, which are identified for each group separately $4
Figure 4.9. Classification of foot types using PCA, SDA and f uzzy logic
techniques. Abbreviations of groups were described in Figure 4.5 $6
Figure 4.10. Plot of the first and the second principal component scores for foot types prediction with PCA. Abbreviations for the groups were described in
Figure 4.11. Individually p1oed first and second principal component scores for prediction of A) able-bodied, B) pes planus, C) pronation, D) pes cavus and
E) supination groups 92
Figure 4.12. Percentage of accurate prediction of foot types with PCA, SDA
and Fuzzy logic techniques. Abbreviations of groups were described in Figure
(D
LIST 0f1St
and 211dMTP: Axis of lst and 2nd MTP bones in reference to the horizontal axis.
St
MTP/Med: First metatarsal inclination in reference to the
horizontal axis.
2Iid
and SthMTp Axis of 2nd and 5th MTP bones in reference to the
horizontal axis.
2IId 5th
MTP/flex: Axis of2nd and 5th MTP bones in reference to the
horizontal axis in plantar flexion view.
AB: Able-bodied.
AP: Antero-posterior.
Bisect/heel: Bisecting of calcaneus bone to the vertical axis.
Bisect/Ieg: Bisecting distal third ofthe leg to the vertical axis.
Calca-inclination: Clacaneus inclination in reference to the horizontal
axis.
FL: fuzzy logic.
HeeL’flex.: Medial heel angle in reference to vertical in plantar
flexion view.
Lateral base: Lateral base ofthe foot in reference to the vertical
axis.
Med: Medial.
Medial base: Medial base ofthe foot in reference to the vertical
axis.
MTP: Metatarsophalangeal.
PA: Postero-anterior.
PCA: Principal Component Analysis.
PC: Pes cavus.
PF: Plantar flexion.
PP: Pes planus.
PR: Pronation.
SDA: Stepwise Discriminant Analysis.
o
ACKNOWLEDGMENTS
I wish to extend my sincere thanks to Dr. Paul Allard for giving me the opportunity to study in his laboratory. His leadership and guidance has helped me achieve my academic goals. Not only did he guide me in my individual academic pursuits. but also taught me to work as part of an academic team. I am thankful to have had the chance to be bis student; his encouragement has prepared me for my future endeavors.
Next I would like to thank my co-advisor, Dr. Nader farahpour, for helping me during my studies.
I greatly appreciate my parents for their love, support and
encouragement.
I would like to acknowledge the Ministry of Science, Research and Technology and Bu-Ah Sina University of the Islamic Republic of Iran for financial support during my studies to do my degree in Canada.
Many thanks also to the late Dr. Ronald Perrault and Sébastien Hinse in Cryos Technologies Inc. for letting me not only use instruments required for my thesis. but also to access the database ofthe pathological patients.
I am also realiy grateful to ail my friends and ah the members of our laboratory particularly Dr. Clarice Tanaka and Mrs. Manon Allard for their contributions to my thesis.
O
Finally, I would like to acknowledge my debt to my dear wife for lier tolerance, take care of our chiidren Sorousli and Sara and her understanding during my studies.Chapter 1
1. INTRODUCTION
Structural deformity of the foot and ankle may have adverse effects on health, such as pain, abnormal gait pattem, and significant reduction in functional performance (Dahle et al.. 1991). Many foot problems are found in newboms or in young chiidren, but the majority of these problems are observed among aduits (Bums, 1996) and the elderly (Benvenuti et al., 1995). Since the majority of patients end up with a permanent disability (Sari-Kouzel et al., 2001), these problems demand serious clinical attention. Effective treatment of a foot deformity depends on the accuracy of the identification and classification of clinical observations (Seli et al., 1994; Wainwright et al., 2002).
Many studies have proposed anthropometric measurements of the medial longitudinal arch or the hindfoot angle as a main characteristic by which to
identif and classify foot deformities (Kilmartin and Wallace, 1992). However,
anthropometric methods are usually limited to a single parameter, such as arch height or hindfoot angle. and therefore this technique is neither accurate nor precise. Updated and more accurate models for classification and identification are needed to provide better quantitative information about different types of foot deformities.
In this chapter, the epidemiology and etiology of foot deformities will be addressed to emphasize the importance of this musculoskeletal disorder and illustrate its complex origins. This will be followed by a description ofthe most common foot problems, highlighting their similarities and differences. Next, the most common clinical examination methods used in the diagnosis of complex foot problems will be outlined. Finally, the general objectives of this thesis will be presented.
1.1 Epidemïology and etiology of foot problems
Structural abnormality of the foot and ankle, with its high incidence and significant impacts on the patient’s performance, is considered a serious
orthopedic problem (Gould et al., 1980). It is more common among females
than males (Greenberg and Davis, 1993). Pes cavus is one of the most severe
foot deformities. It is very common within the adult population, constituting
31% to 21% of cases of foot deformities (Hsu et al., 1991), equaÏly distributed in both sexes (Turek, 1984). Harris and Beath (1952) reported an 11.8% incidence of pes cavus among young men in Canada. Pes planus, observed in 4.6 million individuals (Greenberg and Davis, 1993) in the United States, is more common in African-Americans than Caucasians. Another comprehensive study found a
22.5% incidence of ail kinds of low arch. including severe with short Tendo
commonly observed deformity of the hindfoot is the calcaneus varus (Tiberio, 198$).
Generally, the etiology of foot problems can be divided into three categories: idiopathic, neurological deficit, and musculoskeletal disorder (Neale
and Adams, 1985). Idiopathic foot deformity refers to a primary foot problem
with an unknown etiology. foot problems due to neurological disease can involve metabolic, radicular and locally compressive neuropathies that manifest themselves in the foot area and can cause considerable pain and dysfunction (Bums, 1996). In cases of foot deformity caused by musculoskeletal disorders, the foot structure is affected, resulting in an abnormal foot attitude and structural misalignnients. The latter is the most common foot problem in aduits (Neale and Adams, 1985). for these reasons, this thesis focuses mainly on foot problems with the etiology of musculoskeletal disorders.
1.2 Common foot deformitïes
Changes in sofi tissues, bones and joints ail contribute to acquired foot disorders and the outcome is a complex and challenging range of foot deformities. Because ofthis, some foot pathologies have common characteristics but different diagnoses. for example, a flattened arch can be associated with both pes planus and a supinated foot. In this section, four common foot probiems within the muscuioskeletal disorders category will be briefly described to highlight their particularities as well as their similarities. The definition,
mechanism and clinical features of pes planus (PP), pronation (PR), pes cavus (PC), and supination (SU) are presented below.
1.2.1. Pes planus
Pes planus, illustrated in figure 1.1, is a generic term used to describe
any condition of the foot in which the longitudinal arch is abnormally low or absent (Tachdjian, 1990). Quantification of sagittal plane arch height has long been used as a means of categorizing foot type, largely in individuals with pes planus (Menz, 199$; Cavanagh and Rodgers, 1987). Clinical findings show that
in a weight-bearing position the heel is tilted in a valgus direction. There is
external rotation of the foot in relation to the leg causing forefoot abduction, combined with plantar flexion of the calcanus bone, resulting in the flattening of the sole which makes contact with the ground. Identification of the pes planus
deformity can be difficult because of its association with other conditions where
there is a dropping of the longitudinal arch. Its degree of severity may lead to associated deformities in the forefoot, such as an everted forefoot, and the hindfoot, such as an everted calcaneus.
Figure 1.2. Pronation ofthe lefi side ofthe foot in weight-bearing position (adapted from Root et al., 1977).
1.2.3. Pes cavus
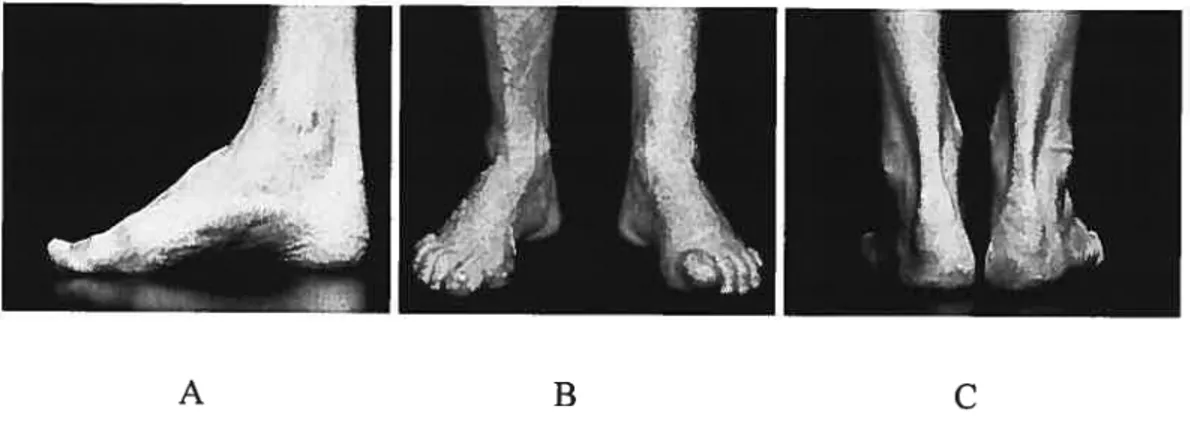
Pes cavus, as shown in the Figure 1.3 A, is characterized by a raised longitudinal arch (Turek, 1984), claw toes and forefoot equinus in relation to the
C
1.2.2. PronationPronation is characterized by an abnormal mobility of the calcaneus in relation to the subtalar joint. Pronation is a combination of motions including abduction, eversion and dorsiflexion ofthe foot and medial rotation ofthe ankle (Root, 1971). An abnormal pronation, presented in Figure 1.2, can be used to describe a condition where an increased amount of subtalar joint pronation is present (Aquino and Payne, 2001). This condition often exists with a laxity of subtalar joint ligaments, heel valgus, forefoot abduction, and decrease in arch height. Although pronation is a deformity mainly characterized by a valgus of heel, its degree of severity may lead to associated forefoot compensation.
(J
hindfoot (Ritchie and Keim, 196$). Figure 1.3 B shows a pes cavus with inverted forefoot (Root, 1971). An inverted heel may be also present in subjects with pes cavus (Root, 1971), as shown in figure 1.3 C. A!though pes cavus is a deformity mainly characterized by an elevated longitudinal arch, its degree of severity may lead to associated deformities in the forefoot and hindfoot.Figure 1.3. Pes cavus, A) media! , B) antero-posterior, C) postero-anterior.
1.2.4. Supination
Supination is described as a subtalar joint deformity accompanied by pronation. Figure 1.4 illustrates this deformity in a right foot. Supination is characterized by calcaneus inversion, adduction and plantar flexion in relation to the talus with a forefoot varus or adduction. The compensation for a forefoot valgus resuits in an inversion of the calcaneus. Supination can be observed as hyper rnobi!ity of the calcaneus bone in a medial direction in a weight-bearing position. Since this deformity usua!!y appears with pes cavus its etiology may be
O
o
neuromuscular and idiopathic. As for other foot pathologies, supination may
lead to associated deformities ofthe foot and ankle.
Detection of the four afore-mentioned foot deformities is difficuit because of their complex interrelation and their similarities, especially those between pes planus and pronation or pes cavus and supination. Therefore, it can be useful to diagnose foot deformities based on several parameters taken from different perspectives to better describe foot morphoÏogy in a clinical environment.
1.3 Clinical examination methods
In a clinical setting, a visual inspection is oflen used as a simple and quick method to identify foot deformities (Razeghi and Batt, 2002). However, this technique is rather qualitative; providing no quantitative information, and the diagnosis strongly depends on the skills of the observer. Because of the multiplicity of possible diagnoses and the similarities among the various foot deformities, the visual observation of the physician might be erroneous, leading to an improper treatment or rehabilitation program.
Goniometry, a popular tool for foot assessment. is an important component of a comprehensive evaluation of the joints used by most cÏinicians. This technique has been widely used to assess mobility of the ankle in both normal (Clapper and Wolf, 1988) and pathological conditions (Elveru et al., 1988a). However, this technique is only useful for measuring the range of motion ofthe joint.
Planar radiography (Saltzman et al., 1994) and magnetic resonance imaging techniques (MRI) (Yu and Tanner, 2002) have also been used in manv clinics to observe the structure of the foot and the underlying pathologies in
different foot deformities. These techniques provide clinicians with the most
accurate information about the shape and arrangement of the foot bones, leading to accurate diagnoses of foot deformities (Stindel et al., 1999). However,
radiographic techniques are invasive due to radiation exposure. Moreover, these are very expensive and rely on the use of high-technology equipment and well trained operators; resources that are flot available in every foot clinic. Therefore, there is a need to develop a new, non-invasive, quantitative, accurate, quick and easy technique for clinicians to use in their assessment of foot problems.
A novel, non-invasive, computer-aided, color-coded video system for foot and posture assessment was developed for the clinical assessment of foot disorders and body posture compensations (Biovision, Cryos Technologies Inc.). In this technique, a digital camera is used to obtain weight-bearing foot images from various views. The advantages of this system are its simplicity, its minimal skill requirements, and the ease with which it can be learned and used. This system is used for foot assessment in clinical environments, serving as a good alternative to visual examination and radiography, especially for able-bodied subjects. Nonethelessits reliability has flot been established and to date few if any methods rely on more than a few geometric parameters to classify the most common foot pathologies.
1.4 General objectives of the thesis
The general objective of this thesis was to determine the reliability of a coÏor-coded video-based system for assessing quantitative parameters that are used to describe foot pathologies. f urthermore, this thesis was aimed to identify
the geometric parameters that best characterize the differences between five foot types which include four pathologies and an able-bodied group. Though a specific color-coded system bas been used in this thesis, the methods developed here can be applied to other similar equipment. The specific objectives of this thesis are detailed at the end of the review of literature chapter.
2. REVIEW 0F LITERATURE
This chapter reviews the literamre related to the most commonly used techniques for the evaluation of the foot and its related pathologies. This is followed by the reliability and accuracy of these systems in assessing foot deformities. Next, joint parameter measurements used for identifying foot
problems are reviewed followed by classification studies on foot deformities. In
the final section, the specific objectives ofthis thesis are detailed.
2.1 Review of the foot and ankle measurement techniques
The majority of techniques in the evaluation of foot problems in a clinical seffing are qualitative. They may be performed with the foot in the unloaded (sitting or lying down) or loaded (upright standing) positions. In this section we have focused mainly on the more common static methods that are
clinically applied for assessing foot problems. The advantages and
disadvantages of these techniques are also discussed. Though dynamic assessments of foot ailments are often performed in university-based research laboratories, these are very costly and are seldom used in clinics. Therefore,
2.1.1 Visual techniques
Visual assessment is a simple method (Razeghi and Bafl, 2002) and is part of a complete clinical examination of the foot. Inspection of the foot from different views is required to accurately characterize foot disorders. Visual techniques vary from direct eye observation to the use of visual devices such as the podoscope and the footprint mat.
A podoscope is a genera term describing any device for assessing the plantar portion of the foot. In its simpÏest form, it consists of a plexiglass surface on which the subject stands and an inclined mirror to observe the plantar pressure distribution as shown in f igure 2.1. Cowan et al. (1994) used a speciafly built podoscope using three mirrors to record anterior, posterior, medial and plantar views of the foot simultaneously. This technique is quick, cost-effective and simple to use. It is ofien found in podiatric clinics in North America and Europe.
There are some disadvantages to using visual techniques. Clinical interpretation is ofien more complex and depends on the observer’s skill. Cowan et al. (1994) reported a poor intertester reliability (r r=O.35) for visual technique on foot assessment since it only provides a general idea about the foot pressure distribution. The podoscope method is limited to the assessment of the plantar aspect of the foot and does flot give any indication of the orientation or attitude of the foot. Additionally, information about the shape, orientation and position ofthe foot are not accessible.
footprint is another commonly used method for assessing foot disorders, more specifically in the medial arch (forriol and Pascual, 1990; Kanatli et al., 2001; Urry and Wearing, 2001). Footprint measurements were proposed to Figure 2.1. Podoscope with a subject in weight-bearing position (from Neale andAdams, 1981).
G
analyze pre and post surgical treatment ofthe foot (Gould, 1988) and to identify and classify foot arch types (Igbigbi and Msamati, 2002; Lindsey et al., 1998; Hawes et al., 1992; Kanatliet al., 2001).
Footprints are made by coating the sole of the feet with ink and having the subject stand on a white paper placed on a screen. The footprint is divided into sections (Kilmartin and Wallace, 1992) and lines are drawn to calculate different indices. Arch index, arch length index and footprint index are defined based on the area of the contact on the imprint. for example, as shown in Figure 2.2, the footprint index is defined as a ratio of the non-contact area (A) to the contact area of the toeless footprint (B). The non-contact area is located between the medial border of the footprint and the medial footprint outline, whereas the contact area consists of the footprint area without the toes. The footprint index provides an estimation of the pes cavus or pes planus involvement (Razeghi and Batt, 2002; Irwin, 1937).
The footprint method is used widely in clinical assessments and is an inexpensive method. However, some footprints have limited contact or non-contact areas to detect severe low or high arches. for example, the non-non-contact area is absent in a severe pes planus deformity (Razeghi and Batt, 2002). Similar footprints are sometimes found for different foot problems which can not be differentiated by this technique.
Q
2.1.2 Anthropometric measurement techniques
The use of anthropometric measurements is another direct method for measuring surface landmarks. This tecimique represents the position of the different structures of the foot; particularly arch height (Razeghi and Batt, 2002); longitudinal arch angle, navicular drop and hindfoot angle (Vinicombe et al., 2001). The longitudinal arch angle is formed by drawing a une from the center ofthe navicuÏar and the trochlea tau to the lowest point of first metatarsal head (Shereff, 1991). NavicuÏar drop measure is the dispiacement of the navicular tuberosity measured on non-weight-bearing and 50% weight-bearing position. The hindfoot angle represents the angle between bisecting of the lower leg and the calcaneus bone. These measurements provide clinicians with information about foot orientation in the sagittal or the coronal planes to identify and classify the foot type.
Anthropometric methods are reliable when the able-bodied foot is assessed: however, these techniques are limited to the measurement of only one parameter such as the arc height or the hindfoot angle. Besides, the data collection and processing by these techniques are time consuming (Saltzman et al., 1995).
2.1.3 Radiographic techniques
Radiographic techniques include radiography, arthrography, computed tomography (CT) scan, magnetic resonance imaging (MRI), etc. The most common methods used for assessing foot problems are described below.
Standard radiographic measurements have been long considered as a gold standard for foot measurements in the clinical environment (Robinson et al.. 2001). Radiographs are taken in both the non-weight-bearing and weight bearing positions (Shereff, 1991). It has been shown that standardized weight bearing foot radiographs are an objective and reliable way to assess both bony structure and soft tissue dimensions (Morag and Cavanagh, 1999).
MRT uses radio waves and a strong magnetic field rather than X-rays to
provide detailed pictures of the intemal organs and tissues of the body segments. It is used for diagnosing musculoskeletal system problems related to joint disorders especially in the foot and ankle (Woodburn et al., 2002). MRT, with its muhiplanar capabilities, ability to image bone marrow, non-invasiveness and
lack of ionizing radiation bas become a valuable tool in evaluating patients with foot and ankle problems (Lucas et al.. 1997; Eustace et al., 1996). Using this technique. the hindfoot bones’ parameters in normal and abnormal conditions including pes cavus and pes planus subjects were characterized by Stindel et al. (1999; 2001).
There are however some disadvantages with radiographie techniques. Radiography has radiation side effects and ethically is flot an appropriate method for studying able-bodied subjects. This technique is basically used for diagnostic purposes and seldom used in posture assessment. Radiographie equipment is expensive to purchase. Magnetic resonance imaging examination is costly and takes more than 20 minutes to prepare the image (Stindel et al. 1999). Very slight movement in the area being scanned can resuit in distorted images that will have to be repeated. furthermore, this technique is flot applicable for postural evaluation ofthe foot in the weight-bearing position.
2.1.4 Goniometry
Measuring angles with a goniometer is an important part of a
comprehensive evaluation of the joints used by rehabilitation specialists and clinicians. This method is rapid and provides clinicians with quantitative information as part of a static lower-extremity examination but bas a poor intra and intertester reliability for assessment of subtalar joint position in both
non-weight-bearing and non-weight-bearing positions (Picciano et al., 1993). The assessment of the foot alignments with goniometry is a time consuming method and patients may get tired during the measurements. Furthermore, it does not provide information on body posture unless additional measurements are taken.
2.1.5 Video-based systems
Imaging measurement techniques are the most widely used methods to capture complex human movements (Winter, 1990). There are many different types of imaging systems available to analyze human movement such as television, movie camera and optoelectric devices. Since the first video camera based systems for movement analysis were introduced in the 1 970s, many systems in this field have been developed and are currently on the market. Many studies have focused on the analysis of foot and ankle kinematics during gait (Mueller and Norton, 1992; Nawoczenski et al., 1998; Nester et al., 2002). Force plate and electromyographic information were ofien taken simultaneously with videographic data (O’Connell et al.. 1998; Kenutzen and Price, 1994; Nawoczenski et al., 1998). These systems made it possible to combine the kinematics and kinetic analysis in dynamic conditions simultaneously. It is also possible to measure the joint movements three-dimensionally.
However, video-based kinematic systems are expensive and usually confined to researcli laboratories or to hospital rehabilitation clinics. These systems are flot relevant to analyze foot problems in the static position since
they require a large number of markers and are turne consuming. f urthermore. marker placement is considered to be a cause oferrors (OConrior et al., 1993)
Photography with a digital camera has been employed as a reliable and practical method in many urologie studies (Kuo et al., 1999). Because ofthe low cost and the ease of use. digital cameras have been widely used in various clinical and surgical settings including otoscopy and sinonasal endoscopy (Melder and Mair, 2003). In orthopedic surgery, digital cameras are used repeatedly to take quality pictures of radiographic findings (Elbeshbeshy ami Trepman. 2001). This technique lias also been used to characterize foot problems (Cowan et al., 1994; Garrow et al., 2001). Foot measurements can be taken directly from the non-invasive pictures. The difficulty lies in identifying the appropriate bony or sofi tissue landmarks on the picture. Additionally, warts, skin irritation. calluses. etc. can make it more difficuit to take reliable measurernents of the various foot pararneters. One way to overcome these drawbacks is to filter out the noise and accentuate the clinical information.
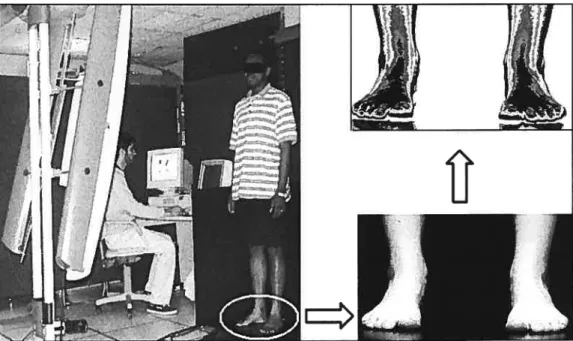
A computer-aided color-coded video-based system (Biovizion, Cryos Technologies Inc.) was developed for the clinical assessment of foot disorders and body posture compensations. This technique is novel for assessing foot deformities. As shown in Figure 2.3, a digital camera is used to capture black and white weight-bearing foot images from varying views. The grey scale is
C
based on 8 bits, hence 256 (0 ta 255) grey levels. The resolution of the original images acquired with the camera is 384x512 pixels. A numerical filter then processes the pictures so that the grey levels are transformed into a color-coded image highlighting muscle and bone prominences. This process facilitates the measurement of the foot parameters ta identify foot deformities. When angles are measured, the fiher divides each pixel in thousand screen units. This allows an estimation ofthe angle at a 1/1 000 of degrees, but in this study we used only the first digit afier comma. This technique rapidly provides quantitative information for assessing the foot problems in clinical environment. The taken images can be viewed, immediately reviewed if necessary, downloaded ta the computer and/or stored in a databank. The pathological images can be used for comparison with a normal image or used for following up the progress of the deformities particuÏarÏy in pre-surgery planning and post-surgery monitoring. Though it bas been used in clinics for over 5 years. the reliability of this color coded video-base system is not yet known.D
In summary, clinical evaluations of foot problems are stili based on qualitative assessments (Morag et al., 1999). The visual technique is simple and often used as a part of the clinical examination to identify musculoskeletal disorders of the foot. This method, however, is flot quantitative and the decision process is highly dependant on the operator’s judgment. To improve the qualïty of the visual approach, a wide variety of devices are available that provide the clinicians with quantitative information (Cappozzo et aL, 1997; Della and Cappozzo, 2000). These devices usually require highly skilled operators or are expensive and have a Iengthy data collection time. A color-coded video-based system, however, can provide us with the quantitative information required for identification and classification of foot deformities in a short time. It is an
Figure 2.3. Image from of antero-posterior view of feet taken with a color
with some other quantitative methods (r=0.7). Cowan et aÏ. (1994) reported a low reliabilitv (r—0.35) when a visual technique using a35-mm camera was used to classify the foot based on the medial longitudinal arch. Due to the fact that there are controversial reports on the reliability of the visual observation technique, plus the lack of quantitative information on this technique, it is difficuit to rely on it for clinical or research based foot evaluations.
Foot imprints were considered for many years as a reliable evaluation method (Irwin, 1937). He observed a high reliability (0.98) for the footprint index defined as the ratio of the non-contact to the contact areas of toeless footprint (f igure 2.2). This was also reported by Igbigbi and Masamati (2002) and Cavanagh and Rodgers (1986). The relationship between this method and radiographie measurements was studied by Kanatli et al. (2001). They found a conelation of r-0.45; p=O.004 between footprint analysis and radiographic measurement of talo-first metatarsal angle and talo-horizontal angle (r=0.40; pO.Ol4) ofthe medial arch. These findings indicate that footprint technique can be used effectively for screening studies as a simple and readily available technique for foot deformities assessment. Hawes et al. (1992) also tested the validity of the footprint parameters as a measure of arch height. They reported a high reliability with coefficient of over 0.90 for the footprint parameters. But they did not find acceptable correlation between footprint parameters and the height of the medial longitudinal arch. They concluded that some footprint
measurements sucli as footprint index and arcli index are invalid as a basis to predict or categorize the arch height.
Williams and McClay (2000) compared the reliability and the validity of several anthropometric measurements including medial longitudinal arch in 10% and 90% weight-bearing positions. They compared these measurements with measurements obtained from the radiography technique. The most reliable measurements were those obtained for the dorsum height divided by the truncated foot length with an intra-class correlation (1CC) of 0.92 for the 10% weight-bearing condition. The agreement between clinical and radiographic measurements of navicular heiglit had ICCs of 0.87 and 0.91 for 10% and 90% weight-bearing position respectively. In another study, Saltzman et al. (1995) studied reliability of anthropometric measurements across subjects with foot deformities. They reported a higher intratester reliabiÏity coefficient (0.87 to 0.91) than intertester coefficient (0.74 to 0.79) for anthropometric measurements. In general, good reliability was documented for the anthropometric method.
Resch et al. (1995) and Clii et al. (2002) have studied the intra and the intertester X-ray measurements used in the clinical observation of the foot disorders. Chi et aÏ. (2002) reported that the intratester reliability of the radiographie measurements of the dista metatarsal articular angle in hallux
C
based systems are suitable for kinematic analysis of the foot and ankle, liffle is known about their reliability for foot shape measurements.The reliability of the photography technique for assessing foot problems was determined by Ganow et al. (2001). They described the validation of a series of photographs for grading hallux valgus severity levels. They reported an excellent intertester repeatability (Kappa=0.86) for using the photography technique in a clinical setting.
In sumrnary, the literature shows that investigators have applied or developed means of quantifying and assessing foot problems. These efforts have provided information on foot evaluation. each with their own advantages and disadvantages. Due in part to the limitations of the above-mentioned methods, the assessment and the diagnosis of foot disorders is stiil based on a qualitative evaluation.
2.3 Joint angle parameters
There are a number of
j
oint angles measured in various views to quantify structural deformities of the foot. In this section the standard parameters for assessing foot problems are described.Q
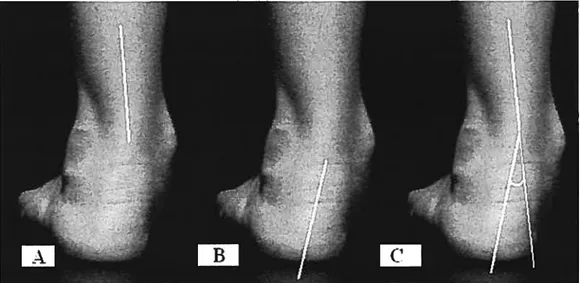
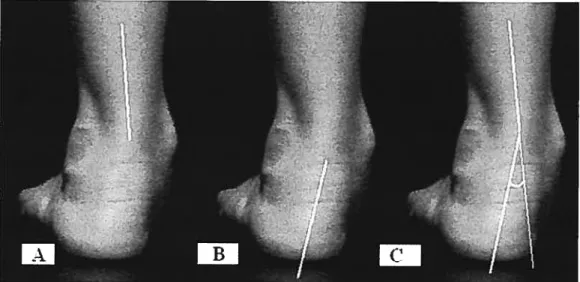
The hindfoot angle or rearfoot to leg orientation (Gross, 1995) is defined as an indicator of subtalar joint position. This angle (shown in f igure 2.4) is formed between unes bisecting the distal third of the leg (A) and bisecting the calcaneus (B). This angle has been measured by many investigators (Weiner et al., 1997; Gross, 1995; Masharawi et al., 2002) during dynamic (McPoil and Cornwall, 1996) and static (Picciano et al., 1993) positions. The average value of the hindfoot angle in 150 able-bodied population (age ranged 6-16 years) has been reported as 40(ranged from O to 9 degrees) valgus of the heel by Sobel et al. (1999) in weight-bearing position. They also reported that the angle did flot vary significantly with age, gender, height or weight in this sample of subjects. Novick and KeÏley (1990) were measured hindfoot angle in twenty able-bodied subjects (age ranged from 20 to 58 years) in weight-bearing position. They reported 10of supination to 70
of pronation of hindfoot angle. In their study. for lefi foot, a positive clock-wise angle value is indicative of pronation while a negative counter-wise angle is indicative of supination. The hindfoot angle is an essential parameter for the subtalar joint measurement to characterize hindfoot deformities as pronation and supination.
o
The Meschan or metatarsal break angle is measured in a weight-bearing position from an antero-posterior view (Shereff, 1991). This angle, illustrated in Figure 2.5, is formed by the une ofthe first and the second metatarsal bones (A) in reference to the horizontal and same line of second and fifih metatarsals (B). According to $hereff (1991), this angle is about 140 degrees in able-bodied subjects.
Figure 2.4. Subtalar joint measurement: A) une bisecting distal third ofthe leg, B) line bisecting the calcaneus and C) hindfoot angle.
The hindfoot angle or rearfoot to leg orientation (Gross, 1995) is defined as an indicator of subtalar joint position. This angle (shown in f igure 2.4) is forrned between unes bisecting the distal third of the leg (A) and bisecting the calcaneus (B). This angle has been measured by many investigators (Weiner et al.. 1997; Gross. 1995; Masharawi et al., 2002) during dynamic (McPoil and Cornwall, 1996) and static (Picciano et al., 1993) positions. The average value ofthe hindfoot angle in 150 able-bodied population (age ranged 6-16 years) has been reported as 40
(ranged from O to 9 degrees) valgus of the heel by Sobel et al. (1999) in weight-bearing position. They also reported that the angle did not vary significantly with age, gender. height or weight in this sample of subjects. Novick and KelÏey (1990) were measured hindfoot angle in twenty able-bodied subjects (age ranged from 20 to 58 years) in weight-bearing position. They reported 1° of supination to 7° of pronation of hindfoot angle. In their study. for lefi foot, a positive clock-wise angle value is indicative of pronation while a negative counter-wise angle is indicative of supination. The hindfoot angle is an essential parameter for the subtalar joint measurement to characterize hindfoot deformities as pronation and supination.
G
The Meschan or metatarsal break angle is rneasured in a weight-bearing position from an antero-posterior view (Shereff, 1991). This angle, illustrated in Figure 2.5, is formed by the une ofthe first and the second metatarsal bones (A) in reference to the horizontal and same une of second and fifih metatarsals (B). According to Shereff (1991), this angle is about 140 degrees in able-bodied subjects.
J
Figure 2.4. Subtalar
j
oint measurement: A) une bisecting distal third of the leg, B) line bisecting the calcaneus and C) hindfoot angle.o
The next standard angle describes the height of the medial arch and is measured by authors (Razeghi and Batt, 2002; Saltzrnan et aI., 1995). Djian and Annonier (1968) first described the media! longitudinal arch using the Dijian Annonier angle. As shown in Figure 2.6 the angle is formed by the calcaneal inclination and first metatarsal with 120 to 128 degrees of value for able-bodied subjects. However, the Djian-Annonier angle is used to describe midfoot deformities such as pes planus and pes cavus.
o
Figure 2.5. A) Meschan angle of right foot formed by: B) une of first and second metatarsals bones and C) line of second and fifth metatarsals.
G
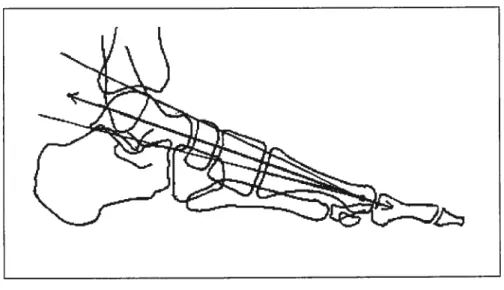
The Meary-Tomeno is a une between the tarsal and first metatarsal
bones (Shereff, 1991). As Figure 2.7 shows, the axis of the talar neck can be
drawn as the une bisecting the angle formed by the lines tangential to the superior and inferior cortical margins of the talus. The midshafi axis of the first metatarsal is drawn as the line parallel to its superior cortical margin and extended through the center ofthe first metatarsal head.
These angles describe the morphological features of the foot. Usually one or two angles are measured to describe a foot pathology and most ofien on a single view of the foot. In this study, we have employed several foot parameters taken from several views of the foot in a weight-bearing position.
2.4 Foot type classification methods
Foot type classification is based on visual, clinical, footprint and radiographic parameters (Razeghi and Batt, 2002). Most of these methods classify foot deformities in tenns of one or a few parameters such as arch height. (Bertani et al., 1999; Song et al., 1996). Univariate statistical analysis is usually performed to compare different types of feet (Cowan et al., 1994; Kanatli et al.. 2001).
Multivariate statistical techniques are employed for data reduction in different fields like gait analysis (Chau, 2001; Sadeghi et al., 2002) and electromyography studies (Pereza and Nussbaum, 2003). Several statistical techniques were applied such as factor analysis and principal component analysis (PCA) to determine which variables contain the most useful information within a particular clinical context. These approaches are employed for reduction of variables and for classification, but have not been used to cÏassify foot deformities.
In this study principal component analysis, stepwise discriminant analysis and Fuzzy logic techniques have been employed to classify foot deformities. A description of each of these techniques wilI be presented briefly followed by advantages and disadvantages of each method.
Principal component analysis represents the original multivariate data in a new reference named principal components (PCs) (Marengo et al., 2003). Many studies have used this approach to reduce the number of variables (Du and Sun, 2005) and classifications (Kapur et al., 2004; Devillers et al., 2004; Lammertyn et al., 2004). For example, Devillers et al. (2004) used PCA to reduce the number of variables and classification of honey samples. They reported a fairly good separation of honey samples. This technique was also used in liuman locomotion studies to describe the variation of gait pattem in
C
able-bodied subjects (Deluzio et al.. 1997). In another study by Sadeghi et al. (2002) principal component analysis was employed as a classification and curve structure detection technique for knee muscle moments during walking. They reported that principal component analysis was able to identify three main contributions of knee muscles moment. The PCA technique does flot provide a concrete reason for a particular classification decision and requires the skill of the investigator for any classification decision (Perez and Nussbaum, 2003).Stepwise discriminant analysis is a method that allows the generation of one or more linear combinations of variables. This method can be employed for identification (Leone et al., 2002) and classification (Beharav and Nevo, 2003). This method is also used to determine linear relationships between variables. If there are two independent variables, using this method reduces the risk of type J error. but it cannot calculate any possible between-factors’ interaction. However. this technique is used in this study because it gives a percentage of correct classification. As our feet types are known (sorted in groups by a podiatrist), the class membership is pre-determined. To our knowledge, this method has not previously been used for the classification of several foot deformities. Only one study by Song et al. (1996) has used this method to predict two foot groups, namely pes planus and able-bodied feet.
fuzzy logic as an artificial intelligence technique is a modeling method well suited for the control of complex systems. The Fuzzy logic technique was
first presented by Lotfi Zadeh in 1965 (Perez and Nussbaum, 2003). This
method has been used for intelligent systems in medicine (Phuong and Kreinovich, 2001) and is a relevant method for diagnosing diseases (Bellamy, 1997). The mechanics of Fuzzy mathematics involve the manipulation of variables through a set of linguistic equations that can take the form ofIf-THEN rules. Therefore, Fuzzy logic is a powerful technique to make a prediction model (Bell and Crumpton, 1997).
f uzzy logic was preferred over Artfficial Neural Networks (ANN) as the latter is trained on specific applications and does flot necessarily provide a cause-effect relationship between input and output according to Taguchi and Jugulum (2002). For example, if ANN was used for pes cavus and supination feet, it will flot work well if pes planus, or any other type of feet, are introduced.
In summary, classification methods are ofien based on one or a few joint angles. Because of the complexity of foot deformities such as in pes planus and pronation, there is a need to employ several parameters from different perspectives to better describe foot morphology in a clinical environment. To our knowledge, multivariate statistical analysis and Fuzzy logic modeling technique using several foot parameters have not previously been applied to the classification of foot types.
2.5 Specîfic objectives ofthis thesis
A novel technique for identi1’ing and classifying foot deformities is the central interest of this thesis. It is hypothesized that the color-coded video-based system provides consistent measurements of foot parameters. furthermore, measurements taken using the color-coded video-based system should have a high consistency when the same subject is evaluated by several evaluators. If so, then the system can provide accurate assessment of foot problems.
The first objective of this study aims to: a) determine intratester reliability in order to establisli the minimum number of repetitions or trials required for clinical assessment of the foot parameters, b) document intertester reÏiabiÏity by assessing the variability among five evaluators and c) determine short- (in the moming and afiemoon of the same day) and long-term (1 week afier) reliability ofthe evaluation.
A thorough description of foot deformity characteristics may provide insights to their geometry and orientation in order to facilitate identification and classification of foot deformities. It is also hypothesized that each foot deformity will have its own specific geometry different from able-bodied feet. The second objective ofthis study is to: a) compare four foot disorders, namely pes planus, pronation, pes cavus and supination with an able-bodied group using 15 foot angles taken from four views, namely antero-posterior, postero-anterior, medial
and posterior views of feet in plantar flexion and b) describe the differences among the groups.
Most studies have identified and classified foot types based on one or two parameters usually selected from a single view of the foot. Because of the complexity of the foot, it is necessary to evaluate the foot using 15 parameters in different views. Therefore, the third hypothesis of this study is that using several parameters from four different views wilI better classify the feet into their respective groups. The final objective of this study is to: a) identify which foot angles best distinguish an able-bodied group from pes planus, pronation, pes cavus and supination groups; b) classify these foot types into their appropriate groups employing two multivariate statistical models; namely principal component analysis and stepwise discriminant analysis and fuzzy logic and c) test the ability of each classification model to predict foot types using these three methods.
3. METHODS
This chapter deals with the application of a color-coded video-based system for foot assessment to classify foot deformities. Using this system, fifieen foot angles were measured. Some of these angles have been used in classical radiographic or goniometric measurements while others were developed to take advantage of the features of the color-coded video-based system for a better identification and classification of foot pathologies. The reÏiabiïity of the color-coded system is first determined, then, using the angles, the geometric characteristics of four foot pathologies, namely pes planus, pronation, pes cavus and supination and that of the normal foot, are described. This is followed by a description of the principal component analysis, stepwise discriminant analysis and Fuzzy logic tools for classification of foot types. Finally, the tools to determine the ability of moUds to identify foot types of new subjects aredetailed.
3.1 Cotor-coded video-based system
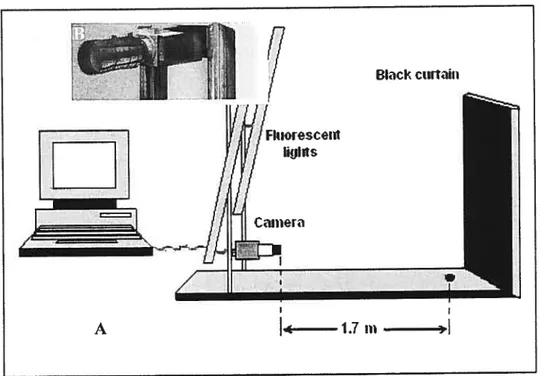
This study is based on a new instrument to assess foot and posture in a clinical setting. A digital camera as shown in Figure 3.1 is positioned on a vertical rail so that the camera can be adjusted from foot to shoulder level. Two
G
fluorescent lights are placed parallel to the rail andon each side of the camera to ensure a uniforrnly lit body surface ($4 lux) and appropriate contrast of the exposed flesh. b better identify the body surfaces, the background setting is covered with a black curtain. A laser pointer is fixed to the camera to facilitate the alignment of the camera’s optical axis. To control the experimental procedure in capturing the pictures, the camera-subject distance was approximately 1.7 meters.Blackcwtam
A 1.7m
Figure 3.1. A) Color-coded video-based system setting. B) A digital camera is positioned on a vertical rail with two fluorescent lights on its either side. The camera-subject distance is 1.7 meters.
C
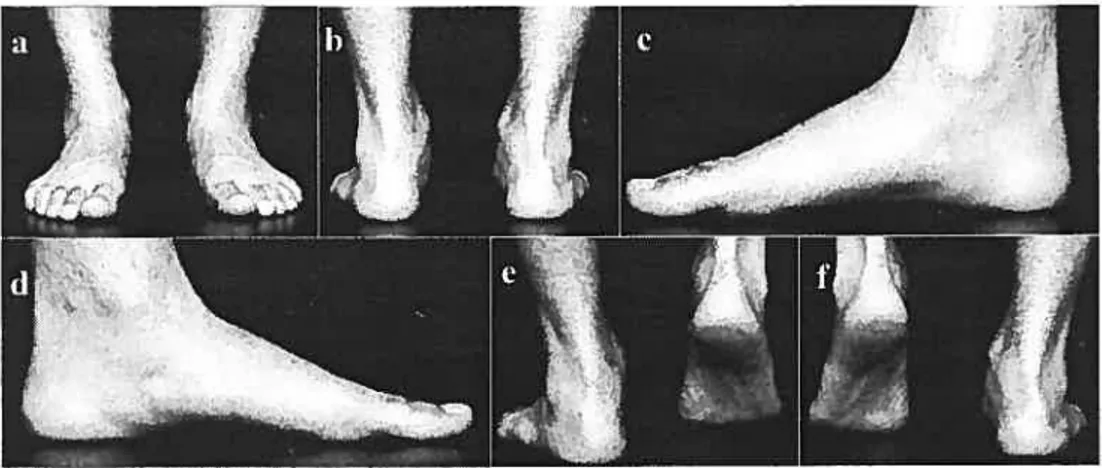
Subjects were asked to maintain a free weight-bearing position to avoid imposing a fixed stance position. For example, using devices to standardize the foot orientation including the distance between the heels could inadvertently modify the configuration of the feet and could lead to an erroneous clinical diagnostic. The subject’s lower limbs were uncovered before the acquisition to evaluate the lower leg and feet. To control for parallax, the camera was positioned parallel to the floor with the optical axis directed towards the feet.Six black and white pictures of the feet were taken with the digital camera in the weight-bearing position as shown in Figure 3.2. Two of these pictures were taken from the antero-posterior and postero-anterior views of both feet together. b control the camera height, the laser point was focused approximately at the level of the leg/foot junction in antero-posterior view. The camera height was controlled by targeting the laser point above the calcaneus bone in postero-anterior view. Another two pictures were of the medial side of each foot separately. In this view, each subject was asked to take a haif step backwards with the contralateral foot to expose the medial view of the foot to be photographed while the leg was oriented vertical to floor. To control the camera height, the laser point was targeted immediately above the base of the first metatarsal boue. Finally, the last two pictures show the posterior view of the right and the lefi foot in plantar flexion weight-bearing position (plantar flexion view). This later view was suggested by a clinician to emphasize and highlight
the relative motion or compensation of the hindfoot when the forefoot is relatively fixed on the ground while being partially loaded. The subjects’ feet were photographed while the laser point was focused approximately above the heel. These six images form a single trial. The subject repositioned himself or herself for each foot view. Ail pictures were immediately saved in the PC environment. This whole procedure took less than five minutes.
Using a numerical filter deveioped by the manufacturer, the pictures were transformed into color-coded images. This original process was applied to highlight the muscle and bone prominences and facilitate the foot angle measurements. Figure 3.3 illustrates the black and white (A) picture of the medial view of the right foot and (B) its corresponding color-coded image.
Q
o
Figure 3.2. A single triai of images taken by Biovizion system, a) a ntero posterior view ofboth feet; b) postero-anterior view ofboth feet; c) mediai view of the right foot; d) medial of the lefi foot; e) posterior view of the right foot while plantar flexion and f) posterior view of the lefi foot while plantar flexion.
3.2 Angular measurements
In this study, fifieen angles were measured in four anatomical views of the foot to characterize foot types. The angles that are illustrated in Table 3.1 were measured on both feet.
All nine of these foot angles were obtained from the radiographic and the goniometric measurements that were applied to process the foot images. These angles are described in detail in chapter 2. The remaining six angles were developed or modified to improve the geometric description of the foot pathologies.
Figure 3.3. The black and white (A) picture ofmedial view ofthe right foot and (B) its corresponding color-coded image.
Table 3.1. The 15 foot angles measured on: antero-posterior (AP); postero anterior (PA); medial (MED) and posterior plantar flexion (PF) views.
Q
Views Angles Images
I. Media! base in reference to the vertical axis (Media! base)
2. Axis ofthe lst and the 2nd MTP bones in
AP reference to the horizontal axis
3. Axis ofthe 2nd and the 5th MTP joints in reference to the horizontal axis(2h1(tand 5 MTP)
4.Meschan
5. Lateral base in reference to the vertical axis (Lateral base)
6. Malleolus in reference to the horizontal axis (Malleolus)
PA 7. Bisecting ofdistal third ofthe leg to the vertical (Bisect/leg)
8. Bisecting ofcalcaneus bone to the vertical (Bisect/heel)
9. Hindfoot (leg/heel) angle
10. Meary-Tomeno line
11.C!acaneus inclination in reference to the
MED horizontal axis (Calca-inclination)
12. The first metatarsal dec!ination in reference to the horizontal axis (lst MTP/Med)
13. Djian-Annonier angle
14. Medial hee! angle in reference to the vertical (Heel/flex)
15. Axis ofthe 2nd and the 5th MTP bones in reference to the horizontal axis(2m1and 5UI
o
o
On the antero-posterior color-coded image, four angles were measured as follows: the Meschan angle as the classical measure of the metatarsal bones’ alignment. This angle was formed by two other angles including the first and the second MTP bones’ angle and the second and the fiflh MTP bones’ angle in reference to the vertical axis as illustrated in Figure 3.4.
In antero-posterior view, the medial base angle formed by the longitudinal axis of the heel and the first metatarsal in reference to the vertical axis was developed to describe the abduction and adduction of the forefoot (Figure 3.5).
Figure 3.4. The classical foot parameters defining the antero-posterior view,
measured on the color-coded image of the lefi foot: A) references required for measurements; B) angular measurements and C) angles shown schematically on the foot.
Q
On the postero-anterior color-coded image, five angles were measured as follows: the hindfoot angle to describe the supination and pronation as a classical parameter. This angle was formed by two other angles as bisecting the distal third ofthe leg and bisecting the calcaneus in reference to the vertical axis. These angles were described in section 2.3 of the second chapter. The lateral base angle formed by the longitudinal axis of the heel and the fifth metatarsal in reference to the vertical axis was developed to describe the abduction and adduction ofthe forefoot. The last parameter was the modification ofthe tips of both malleoluses (Brage et al., 1997). In this study the malleolus angle is measured in reference to the horizontal axis in order to describe the internai and external tibial torsion related to the foot and ankle. Drawing a une from the
A
r:
t..
‘k
s
Figure 3.5. The medial base angle in antero-posterior view, measured on the right foot image: A) references required for the measurement; B) angular measurement and C) angle shown schematically on the foot.
o
o
medial to the lateral malleolus then to the horizontal axis created the malleolus angle as shown in f igure 3.6.
f our foot parameters were measured on the medial view of the processed foot images. The calcaneus inclination and the first metatarsal angles both in reference to the horizontal axis were measured to form the Djian-Annonier angle. These three classical angles were described in section 2.3. figure 3.7 illustrates the procedure of the measurements of these angles on the color-coded images.
Figure 3.6. The foot parameters defining the postero-anterior view, measured on the color-coded image: A) identification of the references required for measurements; B) angular measurements and C) angles shown schematically on the feet.