HAL Id: hal-02084069
https://hal.archives-ouvertes.fr/hal-02084069
Submitted on 29 Mar 2019
HAL is a multi-disciplinary open access
archive for the deposit and dissemination of
sci-entific research documents, whether they are
pub-lished or not. The documents may come from
teaching and research institutions in France or
abroad, or from public or private research centers.
L’archive ouverte pluridisciplinaire HAL, est
destinée au dépôt et à la diffusion de documents
scientifiques de niveau recherche, publiés ou non,
émanant des établissements d’enseignement et de
recherche français ou étrangers, des laboratoires
publics ou privés.
Virtual Objects Look Farther on the Sides: The
Anisotropy of Distance Perception in Virtual Reality
Etienne Peillard, Thomas Thebaud, Jean-Marie Normand, Ferran Argelaguet
Sanz, Guillaume Moreau, Anatole Lécuyer
To cite this version:
Etienne Peillard, Thomas Thebaud, Jean-Marie Normand, Ferran Argelaguet Sanz, Guillaume
Moreau, et al.. Virtual Objects Look Farther on the Sides: The Anisotropy of Distance
Percep-tion in Virtual Reality. VR 2019 - 26th IEEE Conference on Virtual Reality and 3D User Interfaces,
Mar 2019, Osaka, Japan. pp.227-236, �10.1109/VR.2019.8797826�. �hal-02084069�
Virtual Objects Look Farther on the Sides:
The Anisotropy of Distance Perception in Virtual Reality
Etienne Peillard*† Thomas Thebaud* Jean-Marie Normand† Ferran Argelaguet*
Guillaume Moreau† Anatole Lécuyer*
∗Inria, Univ. Rennes, IRISA, CNRS †École Centrale de Nantes, AAU, Inria Hybrid
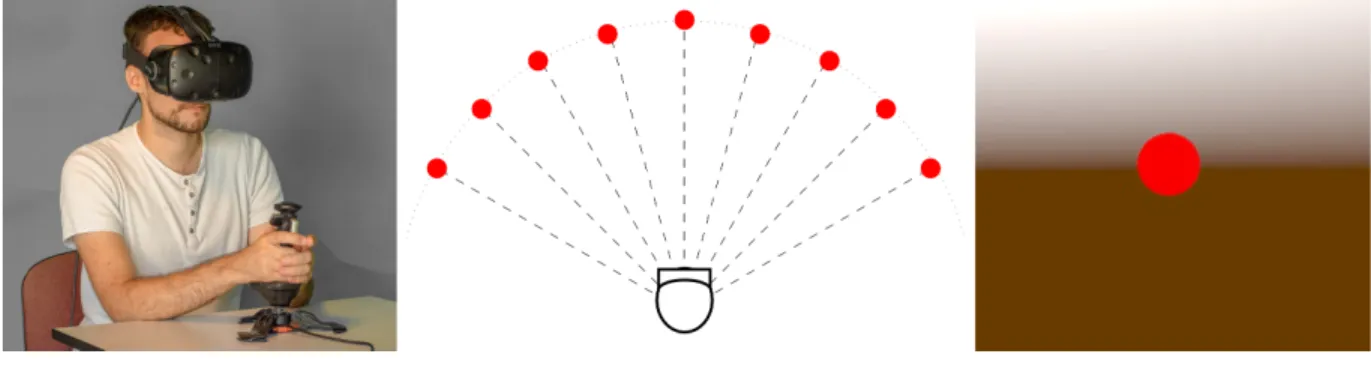
Figure 1: (Left) Experimental setup used in all our experiments. Participants were seated on a chair, wore a HTC Vive HMD and headphones. They grabbed, with both hands, a joystick that was fixated to the table. (Center) Schematic representation of all angle conditions tested in the study. (Right) Virtual stimulus used in Experiments 1, 2 and 3 from the participant’s point of view.
ABSTRACT
The topic of distance perception has been widely investigated in Virtual Reality (VR). However, the vast majority of previous work mainly focused on distance perception of objects placed in front of the observer. Then, what happens when the observer looks on the side? In this paper, we study differences in distance estimation when comparing objects placed in front of the observer with objects placed on his side. Through a series of four experiments (n=85), we assessed participants’ distance estimation and ruled out poten-tial biases. In particular, we considered the placement of visual stimuli in the field of view, users’ exploration behavior as well as the presence of depth cues. For all experiments a two-alternative forced choice (2AFC) standardized psychophysical protocol was employed, in which the main task was to determine the stimuli that seemed to be the farthest one. In summary, our results showed that the orientation of virtual stimuli with respect to the user introduces a distance perception bias: objects placed on the sides are system-atically perceived farther away than objects in front. In addition, we could observe that this bias increases along with the angle, and appears to be independent of both the position of the object in the field of view as well as the quality of the virtual scene. This work sheds a new light on one of the specificities of VR environments regarding the wider subject of visual space theory. Our study paves the way for future experiments evaluating the anisotropy of distance perception in real and virtual environments.
Keywords: Perception, Distance, Virtual Reality, User Experiment, Psychophysical Study
*surname.lastname@inria.fr †surname.lastname@ec-nantes.fr
Index Terms: Human-centered computing—Human computer
interaction (HCI)—Interaction paradigms—Virtual reality; Human-centered computing—Human computer interaction (HCI)—HCI design and evaluation methods—User studies
1 INTRODUCTION
Depth perception is a fundamental question in VR. Most profes-sional applications (architecture, medicine, industry) require a good understanding of this perception to provide a visual feedback as close as possible to reality. This topic has been extensively tack-led during the past two decades and many related questions remain open. In particular, egocentric distance perception in Virtual Envi-ronments (VEs) remains a major research issue.
Numerous studies use reality as a baseline for perception to pro-vide theories and guidelines about depth perception. This subject has been broadly covered for real environments, although not fully understood yet [32]. Most of these studies tackle the phenomenol-ogy of depth perception and the perceptual illusions which can arise when combining distance, orientation and speed perception. In par-ticular, several models for the visual space (i.e. the shape of the space perceived with vision) have been proposed. They underline the effects of the observer’s point of view and orientation on egocentric distance perception [28].
However, in VR studies regarding egocentric distance perception, the potential influence of the user’s head orientation has not been tackled yet. What is more, in such studies the VE is generally oriented and the participant faces a specific direction. The forward direction is specified, and objects are always presented in front of the participant. Then, what happens when the objects are placed on the sides? Could it alter perceived distances, as suggested by visual field theories in real environments?
The purpose of the present study is to evaluate egocentric distance perception to targets to the side in VR. During our experiments, participants had to choose between two virtual spheres which one was the farthest. Systematically, and sequentially, one virtual sphere
was placed on the side, and another one was placed in front. For each trial, they had to compare the distance between them and each sphere (egocentric distances) and select the farthest one. Thus, we assessed if the perceived distance to a virtual object on the side differs from that of an object in front. Hence, we studied the potential anisotropy of egocentric distance perception in immersive VEs.
Therefore, this paper presents the first study conducted in VR to evaluate the influence of a stimulus’ position (in front of or on the side) on egocentric distance perception. The study consists in four experiments conducted sequentially. Sect. 3.1 details a first experiment which explored the potential bias in egocentric distance perception on the sides. Virtual stimuli were placed either at 0º or 60º with respect to the users front direction and participants could explore the VE freely. Then, Sect. 3.2 details a second experiment aimed at further characterizing the observed phenomenon. During this experiment the virtual stimuli were placed either at 0º, 15º, 30º and 45º in order to quantify the anisotropy. The third experiment (see Sect. 4.1) aimed at exploring the potential influence of the position of the object in the users’ field of view. This experiment reproduced the first one while forcing participants to keep the virtual stimuli in the center of their field of view (FOV). The last experi-ment (see Sect. 4.2) was a control experiexperi-ment to study the potential influence of virtual stimuli with additional depth cues and higher salient features. The fourth experiment followed the same protocol as the first one. In addition, the paper presents a short review of depth perception studies in real and virtual environments in Sect. 2 and provides a global discussion of the four experiments in Sect. 5.
2 RELATED WORK
As a main sense for human perception and the primary stimulated sense in VR, visual perception has been extensively studied. While many questions about this subject remain open, a consistent and well documented result arose: the egocentric distance of objects placed on the ground plane at near to medium field distances is underestimated in VR Head Mounted Displays (HMDs) [11, 40]. The reasons are still unclear. The limited FOV of the HMD may [45] or may not [12,27] cause it. The weight of the HMD itself might also contribute to the phenomenon [44]. Recent studies have shown that modern HMDs significantly reduce distance underestimation in VR, even if some differences remain about their distance compression depending on the experimental conditions [9, 26].
Thompson et al. [42] underlined that the quality of the rendered graphics did not cause the underestimation while other studies showed that the quality of the rendered graphics alters distance per-ception [37, 40] and that the underestimation effect can be compen-sated by modifying the way the graphics are rendered [31]. Learning and habits also appear to have an impact on distance perception since the effect can disappear when observers know that the VR room is an accurate model of the physical room in which they are located [24] and the amount of underestimation is significantly reduced by as little as 5 to 7 minutes of practice with feedback [35, 41].
The notion of visual space, i.e. the perception observers have of the space based on their visual perception, has also been largely investigated in real environments. Depth perception in real environ-ments is covered by a very wide corpus of studies dating back to
the 18thcentury, providing both experimental studies and complex
numerical models. Many of those studies report that people commit systematic errors when asked to estimate geometrical properties of their environment from a fixed point of view [3, 4, 43]. Several math-ematical models have been proposed to explain these differences between the visual space and the real physical space. Gibson [18] stated that the visual space is Euclidean. Angel [1], Daniels [13] and Reid [39] suggested it was spherical. Blank [5–7], Indow [21, 22] and Luneburg [33, 34] hinted it was hyperbolic. Hoffman [19, 20] proposed that it reflects a Lie algebra group. Then, Wagner [43] sug-gested affine-transformed Euclidean models and another
observer-based model. To the authors’ best knowledge there is no consensus yet on this topic. Koenderink et al. [28] even suggested that the “visual space” cannot be described by any Riemannian structure.
Thus, most perceptual models lean on the notion of space’s in-trinsic curvature. This notion is defined by Gauss [17] and used by many authors to measure the deformation of the perceived visual field. The studies conducted on that specific parameter state that the curvature of the visual space might not be constant [23]. More-over, Koenderink et al. [30] suggest that the curvature changes from elliptic in near space to hyperbolic in far space, and then becomes parabolic at very large distances. Closer to our present purpose, i.e. studying the notion of consistency of distance perception in visual space, Koenderink et al. [29] evaluated the curvature of frontoparal-lels. Observers were asked to place a radio-commanded vehicle at the bisected point of a linear segment. They found that frontoparal-lels were significantly concave toward the observers. Interestingly, these results were the opposite of those obtained in a similar open environment, but with a different task [30].
The inconsistency of distance perception is not specific to visual field. The haptic space also appears to be non-Euclidean [25] and the haptic perception of spatial properties of objects seems distorted and geometrically inconsistent [16]. Even if the in-depth explanation of haptic perception is beyond the scope of this study, it illustrates the global inconsistency of human space perception.
3 USER EXPERIMENTS
In this section, we describe the first two psychophysical experiments conducted in our study.
3.1 Experiment 1: Anisotropy of distance perception
This experiment aimed at verifying our research hypothesis H1: there is a difference of egocentric distance perception between a virtual object placed in front and one placed on the side.
3.1.1 Participants
This experiment involved 21 participants (all males). They were aged from 20 to 43 (mean=24.3, SD=4.9). Participants were stu-dents or members of the laboratory and naive about the purpose of the experiment. They were not paid for their participation. All participants had normal or corrected-to-normal vision and 16 out of 21 of them had already used an HMD before.
3.1.2 Experimental apparatus
Participants were seated on a fixed chair in front of a table and a fixed joystick was used for answering (cf. Fig. 1). They were asked to stay straight, their back resting on the back of the chair and both hands grasping the joystick. The goal was to fix the torso orientation and to keep a steady position while still being able to move their head freely. Participants wore headphones that were used to vocally announce in which direction the next stimulus would appear. Participants could answer using the joystick by tilting it in the direction of the chosen sphere and by pressing the trigger button to validate.
The VE was displayed in a HTC Vive Head Mounted Display which provides a resolution of 1200×1080 per eye with a horizontal FOV of approximately 110°. The HMD is self-tracked and provides participants’ head positions and orientations with a refresh rate of 90 Hz [36]. In order to provide a correct perspective and stereoscopic rendering on the HMD, the interpupillary distances (IPDs) of each participant was measured before the experiment with a ruler tape.
The VE (depicted in Fig. 1) was designed to provide a limited amount of visual information. It consisted in an empty space with a white sky, a brown floor and a blurred horizon. The stimuli used were red spheres of 10 cm radius. The reference sphere was placed at 3 meters from the participant head’s center, at eye level. The only virtual light provided was a white ambient light. No reflection or shadows were visible in the VE.
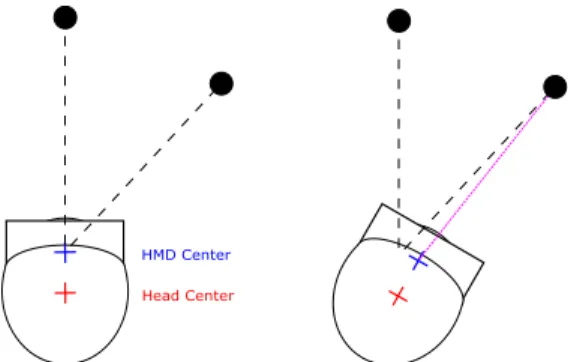
HMD Center
Head Center
Figure 2: Calibration issue. Without calibration, the positions of the head and of the HMD centers are distinct. When the spheres are placed at the same distance from the HMD center (dotted lines), the egocentric distance to the sphere placed on the side could be perceived closer because of centers mismatch.
3.1.3 Head Position Calibration
Due to the nature of the experiment (objects displayed at different angles with respect to the user), a potential bias on distance esti-mation could be introduced by the position of the user. Indeed, the center defined by the HMD is some centimeters ahead from the pivot point of the head, which can lead to a miscalculation of the egocen-tric distance as depicted in Fig. 2. Thus, the following calibration procedure was designed to calibrate the center of the experiment.
First, participants were asked to look to the right and to the left several times. The resulting head positions were distributed along circular arcs, and their centers were used to compute the head’s rota-tion center via an optimizarota-tion method. Finally, a validarota-tion phase followed the calibration to ensure that the computed head’s center matched the real head center position (a difference of less than 3 cm) during the experiment. After carefully executing this calibration, red spheres covered 46 pixels wide on each of the HMD’s screens at the reference distance and the retinal projection of the spheres was identical in size when they were placed at the same distance.
3.1.4 Experimental Procedure
Participants started by filling out a short form containing written instructions about the experiment. After verbal explanations, they carried out the calibration procedure as described in Sect. 3.1.3. Then, they performed 10 trials during which they could get used to the experimental procedure. Finally, the participants were presented with the set of 120 trials. The procedure for each trial was as follows.
In order to assess egocentric distance perception, a two-alternative forced choice (2AFC) protocol was considered. Participants were presented with two successive stimuli and they had to determine the one which answered the following question: “Which object is the farthest one?”. The stimuli were spheres placed at different positions and angles with respect to the participant’s position (see Sect. 3.1.5 for more details), in which one of them was always a reference stimulus (a sphere placed always at the same distance). The spheres were displayed using a red flat shading rendering.
At the beginning of each trial a vocal instruction indicated in which direction the participant should look for the current stimulus (front, left or right). Once in the field of view of the participant, the stimulus stayed visible during 2.5 s before disappearing. After a short delay of 0.5 s the second stimulus was presented following the same procedure. When the second sphere disappeared, the participant provided the answer to the question “Which object is the farthest one?” by tilting the joystick to indicate which sphere seemed farther from him and validated with the trigger.
The sky of the VE was used to provide visual information about different phases of the experiment by changing color when the participant could answer or rest. While it was white when the
-60° 60°
Figure 3: Possible positions of the spheres in Experiments 1, 3 and 4. Only one sphere is visible at a time. They are displayed in pairs, one in front and one on the side, sequentially in a random order.
spheres were visible, it turned yellow to indicate that the participant could answer and changed to green between each repetition. This was achieved to inform the participant that his answer was effectively recorded without giving localized references (as would a text panel). The average total time per participant, including pre/post-questionnaires, instructions, experiment, breaks, and debriefing, was 30 min. After each break, the calibration detailed in Sect. 3.1.3 was performed. Participants wore the HMD for approximately 20 min.
3.1.5 Experimental design
We followed a 2×2×5×2 full-factorial within-subjects design: • C1 The position of the reference sphere, which could be in
front or on the side (but always displayed 3m away from the participant’s head center).
• C2 The side of the “on the side” sphere, which could be on the right or on the left.
• C3 The relative distance between the reference and the compari-son spheres. Five possible values were chosen after the results of a pilot experiment: −0.3 m, −0.15 m, 0 m, +0.15 m, +0.3 m compared to the reference position (3 m).
• C4 The order of presentation of stimuli (reference first, compar-ison first), was counterbalanced to minimize order effects [46]. Every couple of spheres was presented in every possible order (side first/front first, reference first/comparison first).
The angle defined by the two stimuli and the head center was fixed to 60°. This experiment was more focused on the identification of a potential bias rather than measuring the effect with respect to the viewing angle.
In summary, participants were presented with 120 trials, divided in 3 blocks of 40 trials in a different randomized order for each block. Each block of 40 trials presented a set of couples of spheres made of: 2 reference positions (C1) × 2 sides (C2) × 5 relative positions (C3) × 2 presentation orders (C4).
3.1.6 Statistical Analysis
The choices of participants (reference perceived closer) were ana-lyzed using a logistic regression model with a logistic link function. The model included the independent variables as fixed effects and the participant factor as a random effect. Tukey post-hoc tests adapted for logistic regression models were employed. For the sake of simplicity, the main effects of factors involved in interactions are reported but they are not discussed.
The statistical analysis was carried out using the R software, with the glm function and the anova.glm function to analyze the deviance of the logistic regression model, and the glht function of the multcomp package for pairwise comparisons.
Moreover, when an independent variable showed a strong bias on the users accuracy for distance estimation, we were able to further analyze its effect by fitting the following psychometric curve to the
−0.4 −0.2 0.0 0.2 0.4 0 20 40 60 80 100 Comparison Side/Center Relative Distance (m) Ref erence perceiv ed closer (%) Front ref Side ref PSE 0.13 PSE −0.11
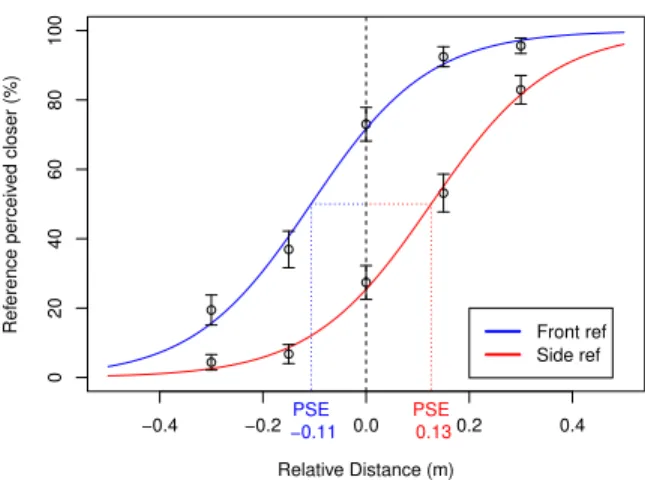
Figure 4: Experiment 1 – Psychometric curves. For each possible relative distance between the reference and the comparison sphere we plot the percentage and the standard error of answers stating that the reference is closer. The red (resp. blue) curve shows the psychometric curve with a “on the side” (resp. “in front”) reference sphere. The corresponding PSE is displayed for each condition.
data for each level of the variable (β provides the value in meters of the Point of Subjective Equality (PSE)):
f(x) = 1
1 + e−α(x−β ) (1)
3.1.7 Results
The analysis of deviance of the logistic regression model (reference perceived closer vs C1, C2, C3 and C4) showed a main effect for
C1 (χ2= 318.75; p < 0.001), C3 (χ2= 868.30; p < 0.001) and C4
(χ2= 30.39; p < 0.001). We also observed an interaction effect
between C3 and C4 (χ2= 39.16; p < 0.001). In contrast, there was
no main effect for the presentation side C2 (χ2= 0.18; p = 0.66).
Regarding C1, post-hoc tests showed that when the reference sphere was presented in front of the participant, it was more likely to be considered as closer (z = 4.07; p < 0.001), see Fig. 4.
Post-hoc tests for the interaction effect (C3 and C4) showed that when the comparison stimulus was placed at −0.3 m and −0.15 m and the reference stimulus was presented second, the reference is per-ceived closer than if it was presented first (−0.3m: z = −4.80; p < 0.001, −0.15m: z = −5.216; p < 0.001). This effect was not visible for the other levels of C3 (all n.s.).
Due to the significance of C1, we further analyzed the ability to discriminate the farthest sphere by fitting the psychometric curves (see Fig. 4). In particular, we split the analysis between the discrim-ination when the reference stimulus was in front and on the side. When comparing Side and Center positions, the obtained coefficients were α = 8.5428 (SE = 0.5401) and β = 0.1260 (SE = 0.0077) for the reference on the side and α = 8.7196 (SE = 0.8198) and β = −0.1067 (SE = 0.0114) for the reference at the center.
3.1.8 Discussion
The presented results showed first a significant order effect. Under some distance conditions, the last presented object is perceived closer. Thus, the main observed effect is the perceptual bias which leads the observer to perceive an object presented in front of him closer than an object located at 60° on the side which validates our first hypothesis H1. Interestingly, the side (left or right) on which the object is presented does not significantly affect the results, it is always perceived as being farther away.
In order to explore this phenomenon, we conducted another ex-periment to further investigate the potential influence of the angle
Table 1: Experiment 2 – Fitting values for psychometric curves
Ref. sphere in front Ref. sphere on the side angle α (SE) β (SE) α (SE) β (SE)
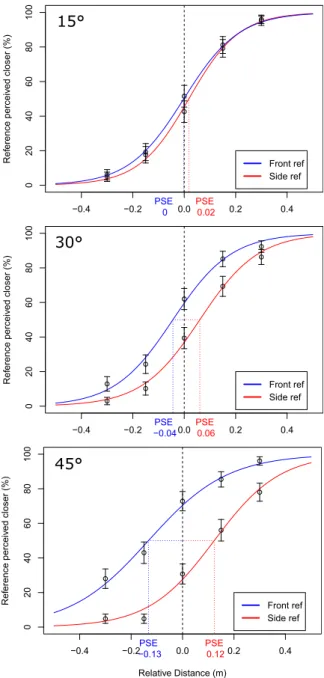
15° 10.23 (0.72) 0.0180 (0.0076) 9.33 (0.29) −0.0016 (0.0038) 30° 8.83 (0.69) 0.0607 (0.0096) 8.82 (0.86) −0.0440 (0.0121) 45° 7.84 (0.84) 0.1232 (0.0139) 6.54 (0.60) −0.1325 (0.0134)
formed by the “in front” and the “side” virtual objects.
3.2 Experiment 2: Influence of the viewing angle
While the first experiment showed that distance perception in VR was anisotropic, it did not assess how this anisotropy changed with respect to the angle defined by the “in front” and “on the side” stimuli. Thus, this second experiment aimed to test our second hypothesis H2: the anisotropy of egocentric distance perception in VR is correlated with this angle. It followed the same apparatus and response protocol as the first experiment (see Sect. 3.1.4), but the experimental design was modified to assess changes in the estimated distance for a discrete number of angle values (15°, 30° and 45°).
3.2.1 Participants
This experiment involved 16 participants (2 females, 14 males). They were aged from 18 to 56 (mean=29.4, SD=10.4). The participants were students or members of the laboratory, naive about the purpose of the experiment. They were not paid for their participation. All our participants had normal or corrected-to-normal vision and 13 out of 16 already took part in an experiment or demo involving HMDs before. None of them took part in any of the previous experiments.
3.2.2 Experimental design
We used a 2×3×5×2 full-factorial within-subjects design: • C1 is the position of the reference sphere, which can be in
front or on the side (but always displayed 3m away from the participant’s head center).
• C2 is the angle between the reference and comparison spheres. The three possible values chosen were 15º, 30º and 45º. We decided to focus on smaller angles in order to determine the angle from which the effect appears. These values can also be completed by the 60° case studied in the first experiment. • C3 is the relative distance between the reference and the
compar-ison spheres. Five possible values were chosen after preliminary testings: −0.3 m, −0.15 m, 0 m, +0.15 m, +0.3 m compared to the reference position.
• C4 is the order of presentation of the two spheres, which was counterbalanced to minimize order effect.
Since the side factor was found not significant in the previous experiment, we chose to remove it from our experimental factors to reduce the number of trials. However, the on the side sphere was randomly placed right or left to avoid displaying the on the
sidestimuli always on the same side. This could have generated
discomfort due to the fact that the subjects would have been turning their head always to the same side. In addition this helped the participant to keep facing front during the experiment.
In summary, participants were presented with 180 trials, divided in 3 blocks of 60 trials in a different randomized order for each block. Each block of 60 trials presented a set of couples of spheres made of: 2 reference positions (C1) × 3 angles (C2) × 5 relative positions (C3) × 2 presentation orders (C4).
3.2.3 Results
The logistic regression analysis showed a main effect for C1 (χ2=
115.42; p < 0.001), C3 (χ2= 1182.11; p < 0.001) and C4 (χ2=
45° 30° 15°
Figure 5: Configuration of the displayed spheres for Experiment 2. Only one sphere is visible at a time. They are displayed by pairs of two, one in front and one on the side, sequentially, in a randomized order. The side (left or right) is not a parameter of the experimental design and is chosen randomly.
In addition, two main interaction effects were found, the first being
between C1 and C2 (χ2= 52.69; p < 0.001) and the second being
between C2 and C3 (χ2= 33.42; p < 0.001). Thus, we will only
discuss the interaction effects and the main effect of C4.
First, regarding the interaction effect between C1 and C2, post-hoc tests showed that differences between the two levels of C1 increased as the the angle (C2) increased. Precisely, post-hoc tests showed that while the effect of C1 is not significant when the angle is 15º (z = 0.721; p = 0.98), the effect of C1 becomes significant for 30º (z = 4.274; p < 0.001) and 45º (z = 9.711; p < 0.001). This effect is also visible in the psychometric curves computed for each level of C2 (see Table 1). The greater the angle, the greater the difference between PSE values.
Second, regarding the interaction effect between C2 and C3, post-hoc tests did not provide conclusive results. Nevertheless, they suggest that participants’ accuracy was slightly higher for the 15º and 30º conditions compared to the 45º condition. Finally, post-hoc tests for C4 did not show any significant effect (z = 0.46; p = 0.65).
3.2.4 Discussion
The main effect on C1, as in the first experiment, validates our hypothesis H1.
The main finding of this experiment is the interaction effect be-tween C1 and C2 highlighting the influence of the angle factor on the observed bias, i.e. distance overestimation of the on the side stimulus. This observation validates our hypothesis H2.
While the effect is non-significant for an angle of 15° (see Fig. 6), the overestimation is significant for 30° and 45°. Interestingly this relationship seems to follow a non-linear behavior (see Fig. 7) at least until 45°. For comparison purposes, the point at 60° in Fig. 7 is the one obtained in the first experiment. The 60° condition was added for reference and suggests that the overestimation effect might reach a step around 45°.
3.3 Provisional conclusions
In this section we presented a new perceptual bias leading people to perceive virtual objects displayed on their side as being farther away than virtual objects displayed in front of them. We showed that this overestimation is significant for angles of at least 30° and that the relationship between overestimation and angle does not follow a linear relationship.
Regarding the potential effects which could cause the observed bias, we suggested that the observers could prefer the “forward” direction in a forced choice when the task is too difficult. This non-perceptual but judgmental bias could explain the first experiment’s results. However, the second experiment shows an increase in bias along with the angle which indicates a perceptual bias linked with
−0.4 −0.2 0.0 0.2 0.4 0 20 40 60 80 100
Comparison Side/Center for 15°
Relative Distance (m) Ref erence perceiv ed closer (%) Front ref Side ref PSE 0.02 PSE 0
15°
−0.4 −0.2 0.0 0.2 0.4 0 20 40 60 80 100Comparison Side/Center for 30°
Relative Distance (m) Ref erence perceiv ed closer (%) Front ref Side ref PSE 0.06 PSE −0.04
30°
−0.4 −0.2 0.0 0.2 0.4 0 20 40 60 80 100Comparison Side/Center for 45°
Relative Distance (m) Ref erence perceiv ed closer (%) Front ref Side ref PSE 0.12 PSE −0.13
45°
Figure 6: Experiment 2 – Psychometric curves at different angular conditions (15º top, 30º middle, 45° bottom). For each possible relative distance between the reference and the comparison sphere we plot the percentage and the standard error of answers stating that the reference is closer. The red (resp. blue) curve shows the psychometric curve with a “on the side” (resp. “in front”) reference sphere. The corresponding PSE is displayed for each condition.
head orientation. Moreover, we conducted a side experiment with 3 people (not reported here) and a reverse protocol (observers had to choose the closest sphere) and this experiment showed the same results of anisotropic distance estimation.
In our first experiment we observed that the in front stimulus always appeared on the center of the field of view (area of maximal vision acuity) while the side stimulus could appear outside of the area of maximal vision acuity. This occurred when participants did not rotate their head enough to put the side stimulus at the center of their FOV. This effect was observed due to the search behavior while looking for the object on the side and did not happen for the
0 10 20 30 40 50 60 0.00 0.05 0.10 0.15 Angle (°) Mean PSE (m)
Figure 7: PSE for each angle condition for Experiment 2, in black. The standard error was computed from the psychometric curves fitting. The red dot is from Experiment 1.
in front object since center is their resting position.
This was validated by analyzing participants’ head orientation records taken during Experiment 1. Most of them turned their head 5° to 10° less than the correct angle when looking on the side.
Since an object which is not in the central vision provides dete-riorated depth cues and that a detedete-riorated vision can lead to a bias in distance estimation [2, 10, 15] we assumed that this difference in visual stimulus could imply the observed bias.
Another question that naturally arises regarding this surprising bias and the ecological validity of the VEs used in our experiments. Would the same effect be observed in a VE with more depth cues?
Based on these observations, we designed two control experi-ments aiming at studying (i) the potential influence of the position of the virtual object in the FOV and (ii) the influence of additional depth cues in VEs on the observed effect.
4 CONTROL EXPERIMENTS
4.1 Experiment 3: Disambiguating head and eye direc-tions effects
This experiment was conducted in order to assess our hypothesis H3: the position of the stimulus in the field of view is responsible for the anisotropy of the distance estimation of virtual objects. In particular, it was designed to remove the potential bias that could be introduced if the stimuli are not presented close to the center of the user’s field of view. Thus, the protocol ensured that the stimuli were always presented as close as possible to the center of the user’s field of view. The described experiment shared the same apparatus, calibration procedure, experimental design and procedure (see Sect. 3.1.2 to Sect. 3.1.4) with the first experiment.
4.1.1 Participants
This experiment involved 15 participants (5 females, 10 males). They were aged from 20 to 51 (mean=31.3, SD=10.1). The participants were students or members of the laboratory, naive about the purpose of the experiment. They were not paid for their participation. All our participants had normal or corrected-to-normal vision and 10 out of 15 already had used an HMD before. None of them took part in any of the previous experiments.
4.1.2 Experimental Procedure
The procedure was identical to the one used in the first experiment, the only change consisted on how the user was guided in order to
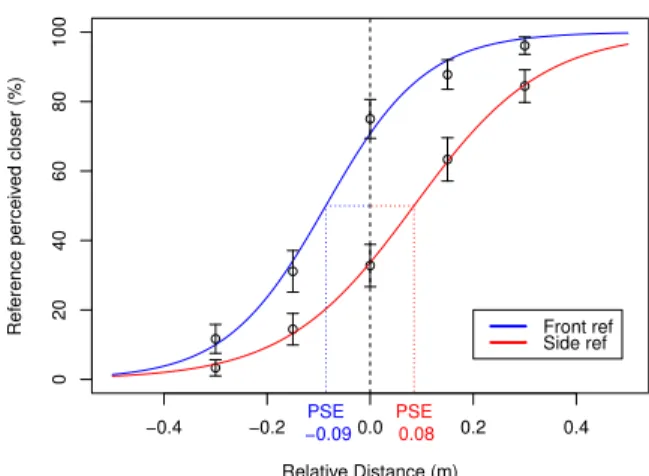
−0.4 −0.2 0.0 0.2 0.4 0 20 40 60 80 100 Comparison Side/Center Relative Distance (m) Ref erence perceiv ed closer (%) Front ref Side ref PSE 0.08 PSE −0.09
Figure 8: Experiment 3 – Psychometric curves. For each possible relative distance between the reference and the comparison sphere we plot the percentage and the standard error of answers stating that the reference is closer. The red (resp. blue) curve shows the psychometric curve with a “on the side” (resp. “in front”) reference sphere. The corresponding PSE is displayed for each condition.
orient their head to face the desired stimulus. Since stimuli were always visible in the first experiment, voice commands (left, right, center), were sufficient to guide users towards the desired stimulus. On the contrary, in this experiment the visual stimulus was only displayed when the participant’s head was correctly aligned (+/-3°) with the desired position.
We discarded the use of visual cues as they could introduce additional biases. Instead, we focused on the use of auditory cues in order to guide the user. Stereo headphones were used to help the user aligning his head in the direction of the next stimulus using a stereo beeping sound. The sound was stronger on the side corresponding to the direction in which participants had to turn their head. In addition, to help participants aligning their head, the frequency of the sound increased when they approached the correct orientation. When the head was aligned correctly (+/-3°), the stimulus appeared. As in the previous experiment, the user had to look at two different stimuli, one placed in front and another on the side. Each stimulus was presented during 2.5 s before disappearing. Once the first stimulus disappears, after a delay of 0.5 s the audio alignment procedure was repeated in order to guide the user to the second stimulus. When the second stimulus disappeared, the participant had to determine which stimuli was farther away using the joystick.
The average total time per participant, including
pre-questionnaires, instructions, experiment, breaks, post-pre-questionnaires, and debriefing, was 40 minutes. Participants wore the HMD for ap-proximately 25–30 minutes.
4.1.3 Results
As described in Sect. 3.1.6, we used the same logistic regression analysis as in the first experiment. The analysis showed a main effect
for C1 (χ2= 126.51; p < 0.001), C3 (χ2= 696.64; p < 0.001) and
C4 (χ2= 13.05; p < 0.001). No significant effect was found for C2
(χ2= 1.60; p = 0.2) and no interaction effect was found.
Regarding C1, as in the first experiment, post-hoc tests showed that when the reference sphere was presented in front of the partic-ipant it was more likely to be considered as closer (z = 2.586; p < 0.01). Post-hoc tests also showed significant differences for the different levels of C3 showing that the choices of the participants were strongly dependent on the distance between the reference and the comparison stimulus. Finally, the post-hoc test did not show any significant difference for the levels of C4 (z = 0.82; p = 0.415).
rate of the reference sphere by fitting psychometric curves as stated in Sect. 3.1.6. When comparing Side and Center positions, the obtained coefficients were α = 8.000 (SE = 0.2330) and β = 0.085 (SE = 0.0038) for the reference on the side and α = 10.276 (SE = 1.1624) and β = −0.086 (SE = 0.0122) for the reference in front.
4.1.4 Comparison with Experiment 1
The only difference between experiments 1 and 3 was the exploration behaviour of the user while searching for the stimuli. In order to assess its potential impacts on the results, we decided to compare the results of both experiments with the addition of a between-subjects factor directed with two levels (visual and acoustic).
The linear regression analysis showed that the directed factor was
not significant (χ2= 0.16; p = 0.68). Regarding the other factors,
no changes were observed. As previously, C1 (χ2= 429.59; p <
0.001), C3 (χ2= 1547.52; p < 0.001) and C4 (χ2= 44.20; p <
0.001) had significant effects on the result while C2 did not (χ2=
0.16; p = 0.69).
4.1.5 Discussion
As in Experiment 1, the side where the object is presented does not affect the result. However, unlike experiment one, there is no significant order effect in this experiment. Nevertheless, in the first experiment the order effect was weaker than the other ones, so it might be present but too weak to be significant in this experiment.
Our research hypothesis H3 was to explain the difference in dis-tance perception of the object on the side by its peripheral position in the visual field. Thus, in this experiment, we carefully ensured that the observer always saw the sphere in the center of his FOV. However, we observed the same systematic bias as in the first ex-periment. Moreover, when considering the two experiments as a between-subjects design, results showed no statistically significant difference. As a result, we failed to validate our hypothesis H3 and concluded that the horizontal position of the object in the observer’s FOV is not responsible for the effect observed.
4.2 Experiment 4: Does the quality of the VE matter?
Experiment 4 aimed at assessing the potential influence of depth cues on the bias observed in Experiments 1, 2 and 3. Indeed, we hypothesized that H4: this perceptual bias will still appear in VE with more depth cues. In the three previous experiments, due to the flat shading rendering, users perceived virtual spheres as 2D disks. On the contrary, in this fourth experiment the sphere was textured using a black and white checkerboard texture and a point light was placed above the head of the user (see Fig. 9). This rendering configuration provides additional depth information in the virtual environment. Indeed, each square of the checkerboard provides anchors for the stereoscopic perception and the point light induces shading on the sphere, highlighting its 3D shape.
The experiment followed the same exact protocol and experimen-tal design as Experiment 1 (see Sect. 3.1).
4.2.1 Participants
The experiment involved 16 participants (9 females, 7 males), aged from 18 to 52 (mean=31.9, SD=10.6). The participants were stu-dents or members of the laboratory naive about the purpose of the experiment. They were not paid for their participation. All our participants had normal or corrected-to-normal vision and 11 out of 16 had already used a HMD before. None of them took part in any of the previous experiments.
4.2.2 Results
The logistic regression analysis showed a main effect for the
ref-erence position C1 (χ2 = 105.75; p < 0.001), the distance C3
(χ2= 734.48; p < 0.001) and the order C4 (χ2= 16.52; p < 0.001).
In contrast, no significant effects were observed for the side C2
Figure 9: Virtual stimulus used in Experiment 4 from the partici-pant’s POV. The VE is designed to provide more depth cues than the previous one (see Fig. 1).
−0.4 −0.2 0.0 0.2 0.4 0 20 40 60 80 100 Comparison Side/Center Relative Distance (m) Ref erence perceiv ed closer (%) Front ref Side ref PSE 0.07 PSE −0.07
Figure 10: Experiment 4 – Psychometric curves. For each possible relative distance between the reference and the comparison sphere we plot the percentage and the standard error of answers stating that the reference is closer. The red (resp. blue) curve shows the psychometric curve with a “on the side” (resp. “in front”) reference sphere. The corresponding PSE is displayed for each condition.
(χ2= 0.24; p = 0.62). Interaction effects were non-significant.
Post-hoc tests for C1 showed that the stimulus was perceived closer when it was in the front and that recognition accuracy increases with the difference in distance (z = 3.101; p < 0.01). For C3, post-hoc tests showed that except for comparisons +0.3 m vs +0.15 m (z = 2.182; p = 0.18) and −0.15 m vs −0.3 m (z = 2.17; p = 0.18) all other pairwise differences were significant (all p < 0.01).
Due C1’s significance, we fitted a psychometric curve for each level of C1. When the reference was placed on the side the obtained coefficients were α = 8.376 (SE = 0.6619) and β = 0.0711 (SE = 0.0101) and when the reference was placed in front the coefficients were α = 8.260 (SE = 0.515) and β = −0.0725 (SE = 0.0080).
4.2.3 Discussion
Results obtained in this experiment showed the same bias as the ones observed in Experiment 1, validating our hypothesis H4. But, if we compare the PSE values we can observe that the difference was smaller than the one obtained in the first experiment. This leads us to believe that the effect observed and detailed in the present paper is not linked to the specific task but indeed illustrates a bias in perceived egocentric distances in VR.
5 GENERAL DISCUSSION
The results of our studies show a novel bias in distance perception in virtual environments: the perception of egocentric distances in VR is anisotropic. Virtual objects located on the sides are perceived to be
farther away than objects in front. The first experiment showed that an object placed on the side is perceived 5% farther than an object placed in front. The work of Koenderink et al. [29], conducted in a real environment, underlines that the forward direction is specific and leads to a deformation of the visual space. Thus, with our second experiment we aimed to characterize the observed bias by assessing distance estimation while varying the exploration angle. The results of the second experiment show that the overestimation effect on the side increases along with the angle. The greater the angle between the in front and the on the side stimuli, the more the observer tends to overestimate the distance of the stimuli on the side. Combined with the results of the first experiment, this effect seems to reach a plateau at 45°.
However, VR suffers from specific limitations which are not present in real environments. One of the most important regarding vision is the relative size of the FOV compared with ordinary real vision, and potential image distortions introduced by HMDs’ optical systems. We conducted a third experiment to evaluate the potential impact of HMDs’ optical systems specificities on the observed bias. We forced participants to look at specific directions in order to ensure that the visual stimulus was always displayed and viewed at the center of the HMD’s FOV. With such an experimental protocol, the previously discussed issues were minimized. In this case, the results did not differ from those obtained in the first experiment. As a conclusion, we can state that the ocular particularity of side vision in VR does not seem to be responsible for the observed anisotropy of distance perception. Then, the effect observed in the two first experiments could not be due to different exploration behaviours or hardware limitations, we hypothesized that the motor action of the head was a good candidate to explain this bias.
The increase in overestimation as related to the head rotation amplitude seems to verify the effort-based theory of depth percep-tion. Indeed, according to this theory, distance judgments seem to be influenced by the amount of energy observers anticipate to expend [14, 38]. In our experiments, the in front object is directly seen by the observer, while the on the side object requires an action (head movement) to be seen. This additional movement from the resting position could modify distance perception and lead to an overestimation. This assumption requires subsequent studies to be evaluated. In particular, additional movements or forces could be added during the experiment to assess the effort-linked dimension of space perception under these conditions.
Finally, the last experiment we conducted, aimed at evaluating the impact of the VE on the observed bias. Indeed, in the three first experiments the VE mainly provided binocular depth cues which could have made the task more difficult, facilitating the appearance of the perceptual bias. In contrast, in our fourth experiment, the visual stimulus provided additional graphical depth cues, lighting, and increased contrast. Here again, results show that, even with more salient depth cues, the same perceptual bias is observed even if it is slightly weaker than in the first experiment. Since the environment provided more depth cues, the ordering task was probably easier. Participants were thus more likely to choose the correct sphere, decreasing a bit the appearance of the perceptual bias.
To analyze this study with respect to those conducted in real environments, our series of experiments can be compared with the frontoparallel curvature experiments of Koenderink et al. [29]. In this paper, they determined that frontoparallels are perceived as being curved, with the concave side facing the observer. In their experiments, when participants had to place objects to a given dis-tance to define a frontoparallel, the objects in front of them were placed further away than the correct position, which implies that they were perceived as being closer. This observation is coherent with our results, suggesting that the bias we observe is not dependent on the visual stimulus but on the distance perception assessment (e.g. motor actions) and on the directionality of the virtual environment.
However, since experimental conditions were not the same in their experiments and in ours, other studies, at different distances, are needed to further characterize this bias.
5.1 Limitations and Future Work
Our setup, involving a participant seated on a chair, is very common to many consumer applications. Interestingly, it naturally induces a strong orientation of the VE. This specific direction is here enforced by the position of the participant, seated and holding a joystick in front of him. The entire body is constrained toward one specific direction. Some other VEs or user positions/orientations could therefore be considered in future work, without any strong forward direction, and involving other settings.
The influence of the position of the stimuli in the visual field does not appear as a factor which leads to the observed anisotropy. However, many studies underline the impact of the limited FOV on depth underestimation in VR. In our study, the same HMD was used during the whole series of experiments. Future studies, using other optics, HMDs or other immersive devices, could thus be conducted to provide additional views on this anisotropy phenomenon.
Our series of experiments evaluated the anisotropy of distance perception considering different experimental conditions. However, given the considered 2AFC experimental protocol, our results con-cern the “relative” distance perception of objects. Future studies could then also focus on “absolute” egocentric distance perception of virtual objects. Moreover, the present experiment was designed to provide an evaluation of the anisotropy of distance perception in ecological conditions. It did not assess the global shape of the visual space, which is of course more complex, as detailed in Sect. 2. The task we chose is specific and cannot cover all the various numerical models proposed for the visual space. Our observed variation in distance perception according to the head direction already seems in favor of the non-Euclidean shape of the visual space. But future work could also extend our results, so to confront them with the various models proposed regarding visual space perception. As an example, our experiments considered the depth perception of a virtual object always placed at ~3 meters. The evolution of the anisotropy accord-ing to the distance considered seems another worthwhile topic to consider. Indeed, as mentioned in the literature, the space percep-tion varies with the distance field considered, both in real [30] and virtual [8] environments. Thus, more studies in real environments are needed to provide a better characterization of this phenomenon and to elicit the specific influence of VR compared with reality.
6 CONCLUSION
In this paper, we have elicited the anisotropy of egocentric distance perception in VR. Throughout a series of four psychophysical stud-ies, we compared distance perception of objects placed “in front” versus “on the side” of the observer in immersive virtual reality.
Our results show that, when using an HMD, participants tend to perceive the virtual objects located on the side as “farther” than the objects located in front of them. Indeed, participants chose the object on the side as farther in 75% of cases. This also corresponds to a bias of egocentric distance of 5% when objects are placed on the side rather than in front. Moreover, the bias increases with the angle of the head/object. Our experiments enabled to show that this novel perceptual bias is not caused by the position of the virtual object in the field of view of the HMD and does not seem to depend on the graphical richness of the depth cues provided by the VE.
Taken together, our results suggest that the perception of ego-centric distances is anisotropic in VR. In particular, objects placed on the side are perceived farther than objects in front. This study sheds light on one of the specificities of VR environments regarding the more wider topic of visual space theory. It also paves the way to future experiments aiming at characterizing this anisotropy of distance perception in both real and virtual environments.
REFERENCES
[1] R. Angell. The Geometry of Visibles. Noûs, 8(2):87–117, 1974. [2] M. L. Ashley. Concerning the Significance of Intensity of LIght in
Visual Estimates of Depth. Psychological Review, 5(6):595–615, 1898. doi: 10.1037/h0068517
[3] A. M. Battro, S. Di Pierro Netto, and R. J. Rozestraten. Riemannian ge-ometries of variable curvature in visual space: visual alleys, horopters, and triangles in big open fields. Perception, 5(1):9–23, 1976. doi: 10. 1068/p050009
[4] A. M. Battro, H. C. Reggini, and C. Karts. Perspectives in open spaces: a geometrical application of the Thouless index. Perception, 7(5):583– 588, 1978. doi: 10.1068/p070583
[5] A. A. Blank. The Luneburg theory of binocular visual space. Journal of the Optical Society of America, 43(9):717–727, 1953. doi: 10.1364/JOSA .43.000717
[6] A. A. Blank. The Luneburg theory of binocular space perception. Psychology: A study of a science, 1:395–426, 1959.
[7] A. A. Blank. Metric geometry in human binocular perception: Theory and fact. Formal theories of visual perception, 1978.
[8] G. Bruder, F. Argelaguet, A.-H. Olivier, and A. Lécuyer. Distance estimation in large immersive projection systems, revisited, 2015. doi: 10.1109/VR.2015.7223320
[9] L. E. Buck, M. K. Young, and B. Bodenheimer. A Comparison of Dis-tance Estimation in HMD-Based Virtual Environments with Different HMD-Based Conditions. ACM Trans. Appl. Percept., 15(3):21:1–21:15, July 2018. doi: 10.1145/3196885
[10] J. Coules. Effect of photometric brightness on judgments of distance. Journal of Experimental Psychology, 50(1):19–25, 1955. doi: 10.1037/ h0044343
[11] S. H. Creem-Regehr, J. K. Stefanucci, W. B. Thompson, N. Nash, and M. McCardell. Egocentric distance perception in the Oculus Rift (DK2). In Proceedings - SAP 2015: ACM SIGGRAPH Symposium on Applied Perception, pp. 47–50. Association for Computing Machinery, Inc, 2015. doi: 10.1145/2804408.2804422
[12] S. H. Creem-Regehr, P. Willemsen, A. A. Gooch, and W. B. Thompson. The Influcences of Restricted Viewing Conditions on Egocentric Per-ception: Implications for Real and Virtual Environments. Perception, 34(2):191–204, 2005.
[13] N. Daniels. Thomas Reid’s Inquiry: The Geometry of Visibles and the Case for Realism. New York: B. Franklin, 1974.
[14] J. Decety, M. Jeannerod, and C. Prablanc. The timing of mentally represented actions. Behavioural Brain Research, 34(1-2):35–42, 1989. doi: 10.1016/S0166-4328(89)80088-9
[15] M. Farne. Brightness as an indicator to distance: relative brightness per se or contrast with the background? Perception, 6(3):287–293, 1977. doi: 10.1068/p060287
[16] E. D. Fasse, N. Hogan, B. A. Kay, and F. A. Mussa-Ivaldi. Haptic interaction with virtual objects. Spatial perception and motor control. Biological cybernetics, 82(1):69–83, 2000. doi: Doi 10.1007/Pl00007962 [17] C. F. Gauss. Disquisitiones generales circa superficies curvas, vol. 1.
Typis Dieterichianis, 1828.
[18] J. J. Gibson. The perception of the visual world. Houghton Mifflin, Oxford, England, 1950.
[19] W. C. Hoffman. The Lie algebra of visual perception. Journal of Mathematical Psychology, 3(1):65–98, 1966. doi: 10.1016/0022-2496 (66)90005-8
[20] W. C. Hoffman. Subjective geometry and geometric psychology. Math-ematical Modelling, 1(4):349–367, 1980. doi: 10.1016/0270-0255(80) 90045-7
[21] T. Indow. Two Interpretations of Binocular Visual Space: Hyperbolic and Euclidean. Annals of the Japan Association for the Philosophy of Science, pp. 51–64, 1967.
[22] T. Indow. Alleys in visual space* 1. Journal of Mathematical Psychol-ogy, 19(3):221–258, 1979.
[23] T. Indow. A Critical Review of Luneburg ’ s Model With Regard to Global Structure of Visual Space. Psychological Review, 98(3):430– 453, 1991.
[24] V. Interrante, B. Ries, and L. Anderson. Distance Perception in Im-mersive Virtual Environments, Revisited. In IEEE Virtual Reality
Conference (VR 2006), pp. 3–10, 2006. doi: 10.1109/VR.2006.52 [25] A. M. L. Kappers and J. J. Koenderink. Haptic Perception of Spatial
Relations. Perception, 28(6):781–795, 1999. doi: 10.1068/p2930 [26] J. W. Kelly, L. A. Cherep, and Z. D. Siegel. Perceived Space in the
HTC Vive. ACM Trans. Appl. Percept., 15(1):2:1–2:16, July 2017. doi: 10.1145/3106155
[27] J. M. Knapp and J. M. Loomis. Limited Field of View of Head-Mounted Displays Is Not the Cause of Distance Underestimation in Virtual Environments. Presence: Teleoperators and Virtual Environments, 13(5):572–577, 2004. doi: 10.1162/1054746042545238
[28] J. J. Koenderink, A. J. van Doorn, A. M. Kappers, M. J. Doumen, and J. T. Todd. Exocentric pointing in depth. Vision Research, 48(5):716– 723, 2008. doi: 10.1016/j.visres.2007.12.002
[29] J. J. Koenderink, A. J. van Doorn, A. M. L. Kappers, and J. S. Lappin. Large-scale visual frontoparallels under full-cue conditions. Perception, 31(12):1467–1475, 2002. doi: 10.1068/p3295
[30] J. J. Koenderink, A. J. van Doorn, and J. S. Lappin. Direct measurement of the curvature of visual space. Perception, 29(1):69–79, 2000. doi: 10.1068/p2921
[31] S. A. Kuhl, W. B. Thompson, and S. H. Creem-Regehr. Minification influences spatial judgments in virtual environments. Proceedings of the 3rd symposium on Applied perception in graphics and visualization APGV 06, 1(212):15, 2006. doi: 10.1145/1140491.1140494
[32] J. M. Loomis and J. Knapp. Visual Perception of Egocentric Distance in Real and Virtual Environments. In L. J. Hettinger and M. W. Haas, eds., Virtual and Adaptive Environments: Applications, implications, and human performance issues, pp. 21–46. CRC Press, 2003. doi: 10. 1201/9781410608888.pt1
[33] R. K. Luneburg. Mathematical analysis of binocular vision. Princeton University Press, Princeton, NJ, US, 1947.
[34] R. K. Luneburg. The Metric of Binocular Visual Space. Journal of the Optical Society of America, 40:627, 1950. doi: 10.1364/JOSA.40.000627 [35] B. J. Mohler, S. H. Creem-Regehr, and W. B. Thompson. The influ-ence of feedback on egocentric distance judgments in real and virtual environments. In Proceedings of the 3rd symposium on Applied per-ception in graphics and visualization - APGV ’06, p. 9, 2006. doi: 10. 1145/1140491.1140493
[36] D. C. Niehorster, L. Li, and M. Lappe. The Accuracy and Precision of Position and Orientation Tracking in the HTC Vive Virtual Reality System for Scientific Research. i-Perception, 8(3):2041669517708205, 2017. doi: 10.1177/2041669517708205
[37] L. Phillips, B. Ries, V. Interrante, M. Kaeding, and L. Anderson. Dis-tance perception in NPR immersive virtual environments, revisited. Proceedings of the 6th Symposium on Applied Perception in Graph-ics and Visualization - APGV ’09, p. 11, 2009. doi: 10.1145/1620993. 1620996
[38] D. R. Proffitt. Embodied Perception and the Economy of Action. Perspectives on Psychological Science, 1(2):110–122, 2006. doi: 10. 1111/j.1745-6916.2006.00008.x
[39] T. Reid. Inquiry Into the Human Mind. Philosophical works, 1764. [40] R. S. Renner, B. M. Velichkovsky, and J. R. Helmert. The perception
of egocentric distances in virtual environments - A review. ACM Computing Surveys, 46(2):1–40, 2013. doi: 10.1145/2543581.2543590 [41] A. R. Richardson and D. Waller. The effect of feedback training
on distance estimation in virtual environments. Applied Cognitive Psychology, 19(8):1089–1108, 2005. doi: 10.1002/acp.1140
[42] W. B. Thompson, P. Willemsen, A. A. Gooch, S. H. Creem-Regehr, J. M. Loomis, and A. C. Beall. Does the Quality of the Computer Graphics Matter when Judging Distances in Visually Immersive En-vironments? Presence: Teleoperators and Virtual Environments, 13(5):560–571, 2004. doi: 10.1162/1054746042545292
[43] M. Wagner. The metric of visual space. Perception & Psychophysics, 38(6):483–495, 1985. doi: 10.3758/BF03207058
[44] P. Willemsen, M. B. Colton, S. H. Creem-Regehr, and W. B. Thompson. The effects of head-mounted display mechanics on distance judgments in virtual environments. In Proceedings of the 1st Symposium on Applied perception in graphics and visualization - APGV ’04, p. 35. ACM Press, New York, New York, USA, 2004. doi: 10.1145/1012551. 1012558
by a directional process of integrating ground information. Nature, 428(6978):73–77, 2004. doi: 10.1038/nature02350
[46] C. J. Ziemer, J. M. Plumert, J. F. Cremer, and J. K. Kearney. Esti-mating distance in real and virtual environments: Does order make a difference? Attention, perception & psychophysics, 71(5):1095–106, 2009. doi: 10.3758/APP.71.5.1096