HAL Id: hal-01432976
https://hal.archives-ouvertes.fr/hal-01432976
Submitted on 12 Jan 2017HAL is a multi-disciplinary open access archive for the deposit and dissemination of sci-entific research documents, whether they are pub-lished or not. The documents may come from teaching and research institutions in France or abroad, or from public or private research centers.
L’archive ouverte pluridisciplinaire HAL, est destinée au dépôt et à la diffusion de documents scientifiques de niveau recherche, publiés ou non, émanant des établissements d’enseignement et de recherche français ou étrangers, des laboratoires publics ou privés.
dams: state-of-the-art and outlook
A. Kalinina, M. Spada, S. Marelli, P. Burgherr, B. Sudret
To cite this version:
A. Kalinina, M. Spada, S. Marelli, P. Burgherr, B. Sudret. Uncertainties in the risk assessment of hydropower dams: state-of-the-art and outlook. [Research Report] Paul Scherrer Institute, 5232 Villigen, Switzerland; ETH Zurich, Chair of Risk, Safety and Uncertainty Quantifi- cation, Stefano-Franscini-Platz 5, 8093 Zurich, Switzerland. 2016. �hal-01432976�
HYDROPOWER DAMS
S
TATE
-
OF
-
THE
-
ART AND OUTLOOK
A. Kalinina, M. Spada, S. Marelli, P. Burgherr, B. Sudret
CHAIR OFRISK, SAFETY ANDUNCERTAINTYQUANTIFICATION
STEFANO-FRANSCINI-PLATZ5 CH-8093 Z¨URICH
Risk, Safety & Uncertainty Quantification
Report Ref.: RSUQ-2016-008
Title: Uncertainties in the risk assessment of hydropower dams: state-of-the-art and outlook
Authors: A. Kalinina1,2, M. Spada1, S. Marelli2, P. Burgherr1, B. Sudret2 Affiliations: 1 Paul Scherrer Institute, 5232 Villigen, Switzerland
2 ETH Zurich, Chair of Risk, Safety and Uncertainty Quantifi-cation, Stefano-Franscini-Platz 5, 8093 Zurich, Switzerland Date: June 2016
extensive production facilities like Switzerland. Due to the high costs associated to the detailed simulation of dam failure events, however, traditional approaches to quantify the risk they pose are largely based on the statistical analysis of historical data, or on worst-case scenario modelling. In the latter case, the design of such scenarios is usually based on sometimes contrasting expert opinion or very sparse available data. In addition, there exist no unique framework or set of tools to quan-titatively assess the socio-economical consequences of a dam-related flood event.
The sparsity of available data, combined with the variability of environmental conditions (e.g. weather conditions, time of the day etc.) and lack of knowledge on the failure process (e.g. dam failure mechanisms) create an additional layer of un-certainty that is not yet properly dealt with in the current risk assessment workflows. This report summarizes the state-of-the-art of risk assessment for hydropower production dams at all levels: from the problem statement itself, to the technical tools (theoretical and numerical) available for its solution, with a focus on life loss estimation and on the role of uncertainty on the final analysis results.
The work for this report was conducted within the project “Risk Governance of Deep Geothermal and Hydro Energy” of the National Research Programme “Energy Turnaround”. It is closely coordinated with ongoing activities of the Technology As-sessment group at the Paul Scherrer Institute (PSI) in both the National Research Program (NRP) 70 “Energy Turnaround” and the Swiss Competence Center for En-ergy Research (SCCER) “Supply of Electricity” (SoE).
Keywords: hydropower, risk assessment of dams, peak breach outflow,
1 Introduction 1
2 Risk assessment of dams 2
2.1 Risk assessment . . . 2
2.1.1 Risk analysis . . . 2
2.1.2 Risk evaluation . . . 5
2.2 Dam safety in Switzerland . . . 6
2.2.1 Organization of dam safety in Switzerland . . . 7
2.2.2 Swiss dam safety concept . . . 8
2.2.3 State of hydropower in Switzerland. . . 11
2.3 Summary and discussion . . . 13
3 Goal of the current report 14 4 Estimation of the outflow hydrograph 16 4.1 Methods for the computation of the outflow hydrograph . . . 16
4.1.1 Methods that predict the peak outflow directly . . . 17
4.1.2 Methods that predict breach development directly and the outflow analytically . . . 18
4.1.3 Methods that model the erosion processes, the breach development and the flow in detail. . . 19
4.2 Dam failure case studies . . . 19
4.2.1 Case study: the Malpasset dam . . . 21
4.2.2 Case study: the Vajont dam . . . 23
4.3 Discussion and conclusions . . . 24
5 Dam-break flood simulation 26 5.1 Model for the dam-break flood simulation . . . 26
5.1.1 The model input . . . 26
5.1.2 The numerical elements of the simulation . . . 27
5.1.3 The model output . . . 28
5.2 Research projects on dam-break flood modeling . . . 28
5.2.1 The CADAM project: dam-break modeling including flood routing . 28 5.2.2 The IMPACT project: extreme flood processes and associated un-certainties . . . 29
5.3 Case studies available in literature . . . 30
5.3.1 Treatment of natural geometry in finite volume flow computations using reformulated SWE . . . 30
5.3.2 Modeling of dam-break flow in a channel with a sudden enlarge-ment using different SWE . . . 31
5.3.4 Dam-break flood simulation using a two-dimensional finite volume
method . . . 34
5.4 Summary and conclusions . . . 34
5.5 Available software . . . 35
6 Estimation of life loss 37 6.1 Estimation of life loss using recommended fatality rates . . . 38
6.2 Estimates of life loss using regression analyses . . . 38
6.3 The Life Safety Model . . . 40
6.4 LIFESim . . . 41
6.5 Discussions and conclusions . . . 44
1
Introduction
The following is a comprehensive report on risk assessment for hydropower. To prepare this report, an extensive literature review was conducted as well as consultations with experts in the dam safety field, such as George Darbre and Russell Gunn (Swiss Federal Office of Energy, SFOE) were considered.
This report investigates accident risks of hydropower dams using an integrated ap-proach. It considers both available experience from historical dam failures and models of selected dam failure scenarios and their potential consequences. This research is funded by the project “Risk Governance of Deep Geothermal and Hydro Energy” of the National Research Programme “Energy Turnaround” (NRP 70), and it is closely linked to the ac-tivities of PSI’s Technology Assessment Group in Task 4.1 on “Risk, Safety and Societal Acceptance” of the Swiss Competence Center for Energy Research ”Supply of Electricity” (SCCER-SoE).
The report comprises a broad overview of dam risk assessment as well as a compara-tive evaluation of methods and software used and documented in the literature. The pri-mary goal of the report is threefold: (1) identify possible gaps in the current approaches and methods used, (2) provide a basis to choose the most suitable methods for analysis of hydropower accident risks in this project, and (3) to offer guidance to systematically quantify the associated uncertainties in the modeling of dam break consequences.
The report is structured as follows. First, an introduction and summary on risk as-sessment of dams is given in Chapter 2. This chapter explains the complexity of the risk assessment process and introduces the methods employed in the study. Furthermore, a more detailed overview is made specifically for Switzerland in order to highlight the importance of dam risk assessment in this country and of the maintenance of the good status of Swiss dams. Chapter 3 presents the various goals of the current report that are then presented in detail in the subsequent chapters. Each of these topical review chapters ends with a conclusion section. The dam breach outflow hydrograph estimation methods are addressed in Chapter 4. The simulation of the dam-break flood or, in other words, the propagation of the outflow hydrograph through the downstream area is discussed in Chapter 5. The estimated hydrograph is an important input in the process of determining potential consequences, i.e. the impact of the flood wave on receptors like population, buildings, etc. Methods for the estimation of consequences, in particular, life loss, are discussed in Chapter 6. Finally, Chapter 7 contains a discussion about the methods that can be identified as being the most suitable for the scope and goals of this project.
2
Risk assessment of dams
This chapter consists of three main parts, first a concise overview of risk assessment, and in particular, its two main elements, namely risk analysis and risk evaluation are presented. In the second part the concept of dam safety adopted in Switzerland is intro-duced. To distinguish safety and risk, safety can be defined as relative protection from adverse consequences (The Society of Risk Analysis,2016). Three fundamental principles (tenets) of dam safety in Switzerland are evaluated in detail: structural safety, surveil-lance, and emergency. Finally, an overview about the state of hydropower in Switzerland is given highlighting the development and the importance of this energy source to the country.
2.1 Risk assessment
Dam risk assessment like any other type of risk assessment should consist of an analysis of the risks associated with the operation of dams and an evaluation of these risks (CSA,
1991). Therefore, risk analysis and risk evaluation are two main components of risk assessment. Within risk analysis, the risk posed to human beings, property, and the environment is quantified. Afterwards, risk evaluation compares the quantified risk to the limits of acceptability and tolerance that are set by the corresponding authorities. No comparison is made between different approaches in this section.
2.1.1 Risk analysis
Prior to the risk analysis it is important to give the definition of risk that will be used in this study. According to Equation (1), risk (R) can be expressed as the product of the probability of the occurrence of the undesirable event (P ) and the extent of the damage caused (D) (Kaplan and Garrick,1981;Lowrance,1976;Haimes,2009):
R = P · D. (1)
However, there is no universally accepted definition of risk, and in recent years the fo-cus has become broader to cover the whole spectrum of probabilities, consequences and uncertainties (Aven,2012). In reality, risk assessment of dams is a complex process that requires modeling the complex relationships between potential hazards (situations that pose a level of threat to life, health, property or environment) and the potential response of the dam structure. One way to do this is through the event tree method proposed by
Salmon and Hartford(1995a). Using an event tree, the initiating event (e.g. hazard)
can be decomposed into parts in a logical structure, so that all events, which can cause a failure or malfunctioning of the system, can be evaluated. The event tree also helps to calculate probabilities of occurrence by aggregating the probabilities of the component risks (see Figure1).
Figure 1: Simplified illustrative event tree (Viseu and Betamio de Almeida,2009) tree for a dam is not a straightforward process since the components of the dam system are always unique and site specific (they are not mass-manufactured as, for example, car components). Therefore, dams do not have a standardized lifespan or type of failure (Lecornu,1998).
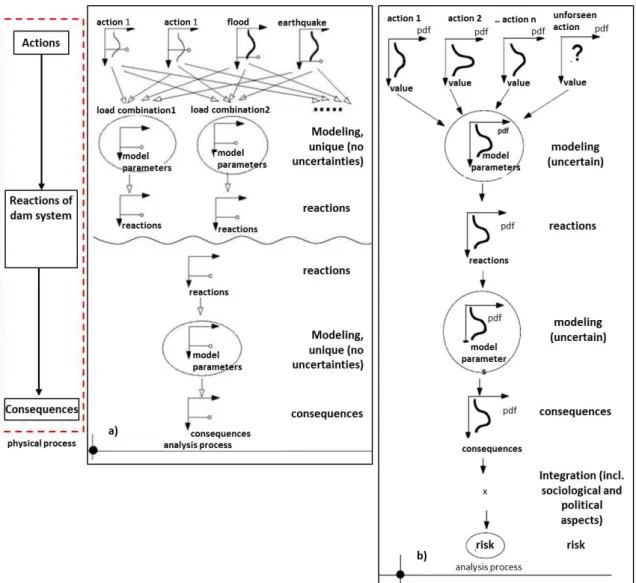
Another approach to assess the risk is employing the physical framework of risk anal-ysis, as interpreted byDarbre (1999). As it is illustrated in Figure 2, deterministic and probabilistic approaches can be distinguished within this method.
In order to understand this physical framework the adopted definitions have to be introduced. Actions are, in the sense of risk analysis, internal and external loads and sometimes also initial conditions. Reactions are the system response to the actions, which can be deformation, stresses or water outflow. In passing from actions to reactions, uncertainties rise from the inherent randomness of material properties, simplifications and assumptions used in the modeling of complex physical processes. How these uncer-tainties are considered distinguishes between deterministic and probabilistic approaches. Whereas, the consequences to be addressed mainly depend on the target auditory of the risk assessment: insurance companies want to know the financial risks; dam own-ers want to undown-erstand potential remediation costs in comparison with the investments; politicians want to understand comparative risk of other energy sources; supervising au-thorities want to assess societal risk (Darbre,1999).
Deterministic risk analysis (Figure 2-a) uses a single value to identify each action. Even when reference is made to a specific return period and, thus, to a probability of recurrence, the action is introduced as a single value. For example, if the action is a severe flood with a 1,000-year return period, which means that the flood has the average recurrence interval of 1,000 years over an extended period of time. Afterwards, these single actions are combined in load combinations in order to give more weight to likely
Figure 2: Risk analysis for dams: Physical framework: a) deterministic type; b) proba-bilistic type. (Darbre,1999)
occurrences and less to unlikely ones. Then, a scenario is constructed of the reactions of the system (e.g. dam failure) to these combinations of actions (e.g. an earthquake and subsequent landslide). However, no uncertainties are quantified and the risk is not calculated, because the probability of occurrence is not calculated. The consequences are estimated and this is usually made independently of the previous steps. For example, the consequences of the dam-break flood are estimated without considering the cause of the dam failure (action or a combination of actions), but assuming a specific reaction of the system (it may also not only be the worst case scenario).
Probabilistic risk analysis (Figure2-b) treats each action in the form of distribution with different probabilities of occurrence. Afterwards, these actions are used as uncertain inputs, which leads to a probability distribution of reaction values. The consequences of these reactions are then modeled. The process of estimating consequences is also uncer-tain and results in distributions of consequences. Different types of consequences can be evaluated: property damage, injuries, deaths, or societal disruptions. Furthermore, the
risk can be evaluated by aggregating the same type of consequences over the entire con-sidered area and including sociological and political aspects. In this project, probabilistic risk analysis employs all ingredients used in uncertainty quantification studies.
2.1.2 Risk evaluation
After the risk has been analyzed, it has to be evaluated to understand what measures are necessary to mitigate and reduce the risk.
Evaluation is done by comparing the risk to the risk limits. Normally two limits can be distinguished: an acceptability limit and a tolerance limit. The acceptability limit denotes a rejectable quality limit and is always lower than the tolerance limit, which is an upper threshold of permissible deviation. These limits can be set either in the form of constant values or curves, where the risk limit (e.g. consequences) varies depending on another parameter (e.g. the probability of the event). As an example for the constant value of the acceptability limit,Lafitte(1993) states that the potential risk of life loss should not be higher than 10−6/year.person. The frequency-consequence (f-N) curve is an example where the risk limit has a different value depending on, for example, the probability of the event. Figure3is an illustration of f-N curves, where the tolerance limit is indicated with an red line and the acceptability limit is a dashed green line with the numbers of fatalities of a magnitude lower for the same probabilities of occurrence.
Figure 3: ANCOLD’s Revised Societal Risk Criterion (Slunga,2001)
The tolerance and acceptability limits are set by society: government, authority, reg-ulator, or others who are directly concerned (Darbre,1999). There are no standardized limits, and furthermore, Figure4 illustrates that there is a variation of limits set by dif-ferent organizations or in difdif-ferent countries. Acceptability and tolerance limits are set
Figure 4: Societal risk criteria for dam failures in different organizations (Fell and Hart-ford,1997)
independently for different types of consequences. Acceptable risks (risks smaller than the acceptability limit) refer to the level of risk that requires no further reduction. On the other hand, all risks larger than the tolerance limit are rejected without further consid-erations (Salmon and Hartford,1995b). For example, if the risk is assessed to be above the tolerance limit, a dam should be decommissioned or rehabilitated. Finally, for risks inbetween these limits, corresponding measures have to be implemented to reduce the risk until it is as low as reasonably practicable (ALARP principle) (Salmon and Hartford,
1995b;Jones-Lee and Aven,2011). For example, if the risk is assessed to be above the
acceptability limit and below the tolerance limit, a decision may be made to do addi-tional reinforcement of dam structure, which can decrease the risk to the level below the acceptability limit.
2.2 Dam safety in Switzerland
The organization of the dam safety process in Switzerland is explained in this section. Afterwards, three main components of the Swiss dam safety concept are given. Finally, the state of the hydropower energy source in this country is discussed.
2.2.1 Organization of dam safety in Switzerland
This section presents information about the organization of dam safety in Switzerland. In particular, information about the types of dams, which are under supervision of the authorities, the process of the organization, and the share of the responsibilities about the dam safety among different authorities.
According to the Swiss Federal Law on Water Policy (22 June 1877) and the Addition to Article 3b of the Federal Law on Water Policy (9 July 1957), safety is a Government responsibility for the following dams (see alsoLafitte(1996)) are those for which:
• the distance between the reservoir level and the lowest water level in the river is at least 10 m;
• the reservoir capacity is larger than 50,000 m3, whereas the distance between the reservoir level and the lowest water level in the river is at least 5 m;
• a particular risk for the downstream area exists.
Responsibilities for the organization of dam safety in Switzerland are shared between the Confederation and the cantonal levels. The Confederation is represented by the Swiss Federal Office of Energy (SFOE), which verifies dam safety compliance by providing tech-nical support, direct supervision and higher-level supervision. Techtech-nical support consists of the preparation of guidelines and technical documents. It also enhances research, training and transfer of the know-how techniques. SFOE provides direct supervision for the operators of 206 large dams. These are under the Government control, according to the criteria given before. Operators of large dams themselves are responsible for safety during construction and operation of a dam. Higher-level supervision means that SFOE enforces the direct supervision of the smaller dams, which is done at the canton level. There are about 600 dams that are supervised by cantons. The operators of smaller dams are responsible for safety during construction and operation phases (Darbre,2015;Swiss
Federal Office of the Energy,2015b).
The current guidelines for the supervision of water retaining facilities were published in 2002 by SFOE fulfilling its role as the Federal Supervisory Authority. Considering the experience gathered since the latest guidance was published and the technological progress achieved in the past years, a revision of these guidelines has appeared neces-sary. The first step is the new Federal Act on Water Retaining Facilities as well as the corresponding Water Retaining Facilities Ordinance of January 2013.
In summary, the well-organized and high quality supervision of dams is also reflected in the good status of the dams, which is recognized abroad. Despite the high level of Swiss dam engineering it is important that new developments in risk assessment such as the quantification of uncertainties are included, which has already been identified as a key topic more than a decade ago (Darbre,1999), and has been addressed regularly in more recent studies different scope and objectives (Wahl,2004;Bornschein,2012).
Figure 5: Safety assessment for dams. Swiss concept (Darbre,1999) 2.2.2 Swiss dam safety concept
The dam safety concept developed by Swiss authorities is closely related to the physical framework of risk analysis described in Section 2.1. As illustrated in Figure5, this concept is based on three fundamental principles: structural safety, monitoring (or surveillance), and emergency concept (Biedermann,1997). By employing these principles, the ultimate goal is to minimize the possible severe consequences associated with the dam operation and to control the remaining risk (Darbre,1999). The risk remaining after risk teatment is also called residual risk. The concept must be applied to dams of all types (concrete, weirs, and embankment), dimensions, purposes (power production, irrigations, water supply), and with private and public operators (Darbre,2015).
Structural safety
Structural safety of dams is ensured by the optimal design of a dam. In this respect, all possible operational conditions have to be evaluated. In particular, the maximum load on the dam due to any of a variety of cases (e.g. severe flood, earthquake) has to be considered in the dam design phase. Dam design has to be performed according to the most recent state of knowledge and considering the protection measures that can be used in the case of an emergency (Biedermann,1997). The two main potential threats that have been identified in Switzerland are floods and earthquakes. These aspects of the structural design of a dam are outside the focus of this project (see Chapter 3), therefore, only a short overview of structural safety is given below.
According toBiedermann(1997) concrete dams in Switzerland have to be designed for a flood peak 50% higher than the one predicted for a 1,000-year return period. In addition, to eliminate critical damage the following rule must hold: the water level in the reservoir should never rise above the water level for the largest flood as considered for design. For concrete dams, this level is higher than the crest (the elevation of the
uppermost surface of a dam excluding any parapet wall, railings, etc.); for embankment dams, it is the crest level or lower if dangerous seepage flow can initiate in the crest area
(Biedermann,1997). The bottom outlets of dams in Switzerland have to be designed for
a large discharge and progressive opening under flood conditions. The mechanisms of the gates, the emergency power unit and the water level gauge have to remain constantly in operational conditions.
Furthermore, the design of the dam has to be in such a way that it can resist the maximum considered earthquake under the conditions of a full reservoir.Darbre(2015) explains the evolution of the verification process of earthquake safety of dams in Switzer-land. Up to the 1970’s, earthquake safety of dams was assessed according to international practice at that time. Since the 1980’s, safety of new projects is systematically assessed based on hazard maps developed in 1978. The current Swiss guideline on dam safety published in 2002-2003 is accompanied by technical document on the earthquake safety assessment for dams. Furthermore, an on-going verification of over 200 earthquake anal-ysis reports, which were prepared by dams experts, is carried out by SFOE.
Surveillance
The monitoring (surveillance) aims to detect structural defects or external hazards to safety so that the necessary control measures can be taken. Monitoring can be done using measurements, visual checks, and functioning tests of gates and valves. Visual inspections help recognize the signs of the changing conditions or the undesired behavior before an accident occurs. For example, visual inspections can be an alternative to measurements in circumstances where a possible threat cannot be assessed with measurements. Functional tests of the gates help ensure that gates are in full operating condition and that they can be operated on a short notice, for example, to empty the reservoir in the conditions of severe flood (Biedermann,1997).
Table 1: Four surveillance levels for the dam safety in Switzerland (Darbre,2015) Surveillance level Activities
1 Dam personnel & Geodetic engineer Visual inspections, measurements, functional tests
2 Qualified professional (civil engi-neer)
Evaluation of measurements and ob-servations, visual inspection every year, analysis of results and findings, annual report
3 Experts (civil engineer, geologist) Comprehensive safety review, report every five years
4 Supervisory Authority Verification of compliance, review and validation of safety reports, on-site in-spections, ordering of technical or op-erational measures
According toDarbre(2015) surveillance of dam safety in Switzerland has four levels: dam personnel, qualified professionals, experts and supervisory authority. Descriptions
of these levels and the associated responsibilities are given in Table1. The supervising authority has formed the fourth surveillance level since the 1980s, performing its own general evaluations of the conditions and behavior of a dam. The presence of a surveyor, the civil engineer and the geologist is required at the site visit that is a preface for the 5-year safety report.
Emergency
The emergency concept covers measures that are required to be taken in order to respond to a hazard. There are three danger thresholds. The first one is assigned when the hazard can be controlled, for example, by lowering the water level. The second threshold corresponds to a situation when the dam expert cannot assess if the situation can be controlled. In this case, the water level has to be lowered and the preparedness of the alarm system is checked to make sure that the population can be evacuated within a short notice. The third threshold is assigned when a dam break cannot be avoided anymore. In this case, the alarm and the evacuation of the population have to be ordered
(Biedermann,1997).
Figure 6: Alarm in municipalities (Biedermann,1997)
The study byBiedermann(1997) describes the alarm system currently employed in Switzerland, which is illustrated in Figure6. A general alarm is used in the whole area that is at risk of being inundated. The second type of siren must be installed in the near zone, which is the area that could be flooded within two hours after the total dam failure. These are water alarm sirens that are activated from the dam and that directly give an order to immediately leave the inundated area. At least two independent information flows have to be set to ensure that the alarming sirens reach the areas where people must act. An evacuation order is usually sent out by the dam owner as a responsible authority for the dam safety (Biedermann,1997).
The timeline for the successful evacuation planning is illustrated in Figure 7. The successful evacuation is assured when the following rule holds: the time necessary to activate the alarm and evacuate the area does not exceed the warning time and the du-ration of the dam-break flood propagation. Possible ways to ensure that there is enough
Figure 7: Criteria for the successful evacuation (Darbre,2015)
time for evacuation is to increase the warning time by recognizing the hazard (enhancing surveillance, creating scenarios) in time or to decrease the time needed to activate the alarm by organizing rapid alarming and the time needed for evacuation by improving evacuation procedures (Darbre,2015).
2.2.3 State of hydropower in Switzerland
Switzerland uses 90% of its available hydro resources, and it has one of the highest densities of dams in the world (Slater,2011). An impressive twenty-eight dam reservoirs are located above an elevation of 2000 m and 107 are between elevations of 1500 m and 2000 m. The country experienced an intense dam construction period between 1950 and 1970, when 100 large dams were constructed. Currently, there are 206 dams under government control as illustrated in Figure8.
Figure 8: Dams and reservoirs under the supervision of the federal government in Switzerland (Swiss Federal Office of the Energy,2015b)
The current overview is focused on large hydropower facilities in Switzerland. The definition of a large hydropower dam follows the International Commission on Large Dams (ICOLD), which defines large dams as dams taller than 15 m. Furthermore, the Report of the World Commission on Dams also considers dams as large that are between 5 and 15 m tall with a reservoir capacity of more than 3 Mio m3.
The information about the physical characteristics of the largest hydropower plants in Switzerland is provided by ICOLD inventory database, Statistik der Wasserkraftanlagen
der Schweiz 1.1.2015, and the Swiss Committee On Dams (SwissCOD). It is summarized
in the remainder of this sub-section.
In Switzerland 25 large dams are more than 100 m tall and four are taller than 200 m. Among those, the Grand Dixence dam (canton Valais) of 285 m height is the tallest gravity dam in the world. Furthermore, the Mauvoisin dam (canton Valais) is the world’s third tallest arch dam (250 m). These large dimensions correspond to large volumes of dam reservoirs. For example, the reservoir volume of 85 dams in Switzerland is larger than 1 Mio m3, in 54 cases larger than 10 Mio m3 and in 13 cases larger than 100 Mio m3.
Following the intensive dam construction between 1950 and 1970, the age of large Swiss dams ranges from 20 to 60 years: 161 dams are more than 20 years old, 145 dams are more than 40, 113 - more than 50, and 65 - more than 60. Furthermore, 17 large Swiss dams were built more than 100 years ago.
Concrete dams clearly dominate among large Swiss dams. For example, gravity dams account for 43% of all dams considered in this list, arch dams - for 32% (among them 2 dams have multiple arches), whereas earthfill and rockfill dams sum up to 23% of large Swiss dams and buttress dams have a share of only 2%.
Large dams in Switzerland serve different purposes. However, the majority of them (145 dams) are employed to produce energy. Of these, 68 dams produce each more than 100 GWh of electricity per year. Grand Dixence, operated by HYDRO Exploitation SA, produces alone 2,152 GWh/year. Gravity dams produce 39% of the total electricity from hydropower, arch dams - 45%, and earthfill dams - 11%. The total energy produced by Swiss dams accounts for around 56% of domestic electricity production (SFOE,2015).
SFOE made a list of the 25 tallest dams in Switzerland. The height (m) and reservoir capacity (Mio m3) of these 25 dams, as well as their geographical location is given in
Swiss Federal Office of the Energy (2015a). The majority of these 25 dams are arch
type (19). All of them are used for electricity production. They are older than 39 years (minimal threshold) and situated mostly in the cantons of Grison, Ticino and Valais. These arch dams have heights between 100 and 250 meters, and an average reservoir capacity of 93.8 Mio m3.
2.3 Summary and discussion
Chapter 2 introduced the concept of dam risk assessment by presenting its main compo-nents, namely risk analysis and risk evaluation. The two main approaches to risk analysis, deterministic and probabilistic, are considered through event trees or a physical frame-work perspective. The physical frameframe-work of risk analysis is explained together with the concepts of activity, reaction and consequence. Probabilistic risk analysis is the approach that will also be used in the current project because it allows for a comprehensive and systematic quantification of uncertainty.
In the second part of this chapter, the dam safety approach in Switzerland is described in detail. This overview describes actions being taken to reduce the risks, and the mon-itoring and supervision system that is in place to assure a high level of dam safety, for which it is also essential to maintain the good status of Swiss dam engineering. The sec-tions in this part have different level of importance for our project (refer to Chapter 3 for further explanations). Therefore, they are reviewed with different levels of complexity. For example, the emergency concept with the warning time and evacuation principles, which is of high importance for consequences estimation, is discussed with more detail than the structural safety, which is given more for the general overview.
The overview of hydropower dams in Switzerland indicates that a focus of the re-search on arch dams could make sense. This type of dams has the highest share in terms of electricity production, and they also are the dominant type among the tallest dams in the country. In conclusion, risk assessment of arch dams will be considered a good test case for this project, and with the focus on uncertainty quantification of consequences, a fully probabilistic approach should be chosen. This would also make sense because the literature review clearly indicated that there are still research gaps in this respect, and this project could thus contribute to answer some of these open questions.
3
Goal of the current report
Prior to uncertainty quantification within the dam risk assessment, which is the ultimate goal of the current project, a clear understanding of the methodological approach for dam risk assessment is needed, which then allows a systematic treatment of uncertainties. As already concluded in Chapter 2, this calls for the implementation of a fully probabilistic approach.
Once the risk assessment approach is defined, we need to model the actions (inter-nal and exter(inter-nal loads), reactions (system response), and consequences (e.g. life loss, economical loss, environmental impact) of a dam failure within the adopted physical framework. In the current report, available methods will be discussed using the informa-tion that was gathered during the literature review and from personal communicainforma-tions with experts in the field of dam risk assessment.
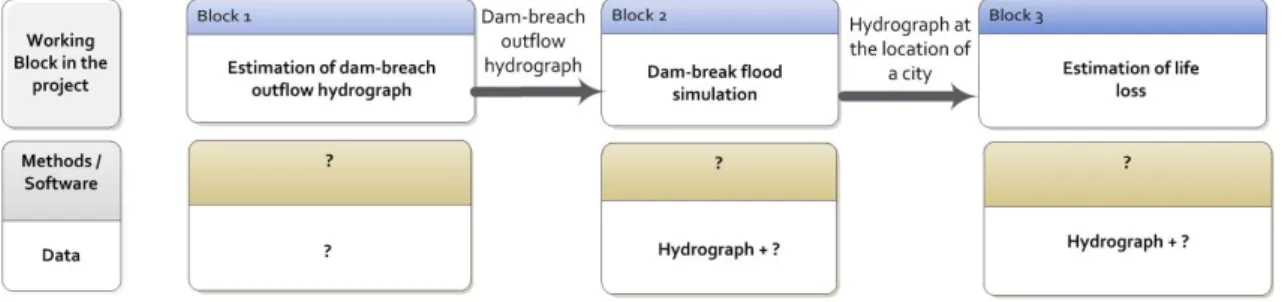
The risk assessment of a dam failure consists of several steps, which are illustrated in Figure9. Each step is presented as an individual working block, where an output of the previous block serves as an input for the next block. All blocks together represent the
methodological concept for dam risk assessment.
Figure 9: Methodological concept of dam risk assessment
In this study, the cause of a dam failure is not analyzed, but the basic assumption is that a dam failure is complete and instantaneous. Furthermore, consideration of as-pects within structural safety and, in particular, modeling of the dam-breach formation (a process of the formation of a hole, a crack, or another kind of the structural damage depending on the dam type) is outside the focus of this study. Therefore, hydrograph (rate of flow over the time) estimation is the first step in the dam risk assessment in this project.
Block 1 in Figure9describes the estimation of the outflow hydrograph. The current report aims to answer the following questions:
• What must be known prior to the dam-breach hydrograph-estimation process? What type of information and data is required to estimate the hydrograph?
• What methods can be used for the dam-breach hydrograph estimation?
The expected output of Block 1 consists in a hydrograph at the location of a dam. This hydrograph will be introduced as an input to Block 2 that is the simulation of the
dam-break flood. The questions for Block 2 are as follows:
• What input data (besides the hydrograph) is required for the process of the hydro-graph propagation?
• What flow equations and numerical techniques are best suited in this context? • What software can be used?
• What output is needed to be able to proceed to the next step?
Output of Block 2 will be a hydrograph at a specific location of interest, which can be a town or a city in the downstream area where the potential consequences have to be estimated. This hydrograph will be introduced as an input to Block 3, which should answer the below questions:
• What methods do we need to calculate the consequences of a dam failure knowing the hydrograph at the location of a city or town?
• What processes and parameters have to be considered in this step in order to achieve accurate results (an example can be the modeling of the warning time, which was for this purpose discussed in detail in Chapter 2)? As it is pointed out in Chapter 2, the type of consequences to be addressed depends on the questions that need to be answered. At this preliminary stage, life loss is the main type of consequences that will be addressed in our project.
The answers to the questions for Block 1 to 3 are essential to make informed decisions and to develop the most suitable approach for these Blocks, and to subsequently allow for a systematic and comprehensive quantification of uncertainties. In the following chap-ters, Block 1 to 3 are presented and discussed in detail.
4
Estimation of the outflow hydrograph
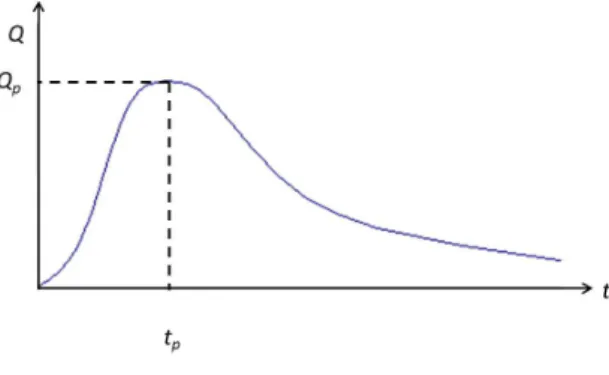
A literature survey of studies on the estimation of the outflow hydrograph is provided in this chapter. A hydrograph is defined to be a flow rate over time. The two main parameters characterizing a dam-breach outflow hydrograph are the magnitude of the peak discharge Qp and the time required for the flow rate to rise to that peak tp, as illustrated in Figure10. The magnitude of the peak discharge affects the inundated area and plays an important role in the propagation of the flood along the valley. The time required for the flow rate to rise to the peak is related to the time available to warn the population at risk.
Figure 10: Scheme of a hydrograph
An accurate estimate of Qp and tp is important because it is the primary input and a substantial source of uncertainties for the whole risk assessment analysis (Wahl,2010). Furthermore, the outflow hydrograph is particularly important to assess the risk for peo-ple and infrastructures close to the dam and for calculating the appropriate warning time in the case of emergency. Two possible approaches to estimate the dam-breach outflow hydrograph could be defined:
• the methodological approach; where the dam-breach outflow hydrograph is com-puted using methods available in the literature.
• the case study approach; where the dam-breach outflow hydrograph is taken from one of the dam failure case studies available in the literature.
These two approaches are evaluated in the following sections. Based on the literature overview and the personal discussions with experts in the field of dam-breach modeling, a recommendation between the approaches will be made.
4.1 Methods for the computation of the outflow hydrograph
The methodological approach allows the dam-breach outflow hydrograph to be computed using methods available in the literature. These methods range from simple to more complex and can be classified in three groups according toWahl(2010):
1. methods that predict the peak outflow directly;
2. methods that predict the breach development directly and, based on it, model the outflow analytically;
3. methods that model the erosion processes, the breach development and the flow in great detail.
4.1.1 Methods that predict the peak outflow directly
The peak outflow discharge can be directly estimated as a function of dam and reser-voir properties using empirical equations developed by regression analysis of historical observations of dam failures. The regression equations typically have the form of the power-law relationship given in Equation (2), where X indicates parameters of the dam or reservoir (e.g. volume, water depth), and a and b are empirical coefficients (Manville,
2001).
Qp = aVwαHwβ (2)
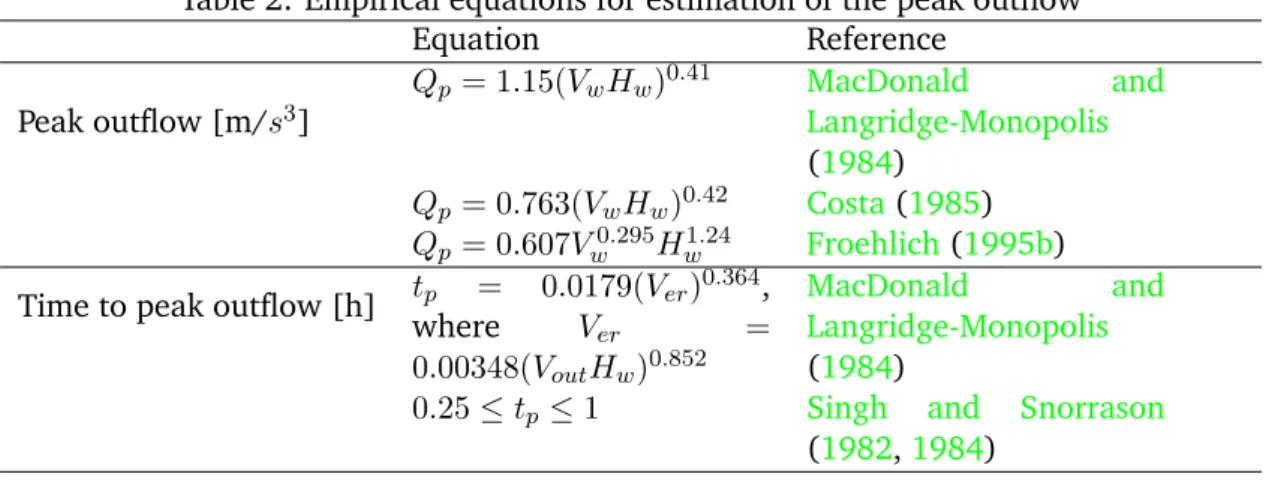
Table2presents several empirical equations for estimations of the peak outflow (m3/s), Qp. In Equation (2) Vw is the reservoir water volume at the time of failure (m3), Hw is the total drop in reservoir level during breach (m), a, α, β are coefficients obtained from regression analysis. MacDonald and Langridge-Monopolis(1984) derive the peak outflow based on the results of a best-fit analysis and boundary curves on 42 failed earth dams. Costa (1985) proposes an equation based on the regression analysis of data for 31 cases for both embankment and concrete dams. Finally, Froehlich (1995b) derives the equation using a multiple linear regression on 22 dams where discharge data was available.
Table 2: Empirical equations for estimation of the peak outflow
Equation Reference Peak outflow [m/s3] Qp= 1.15(VwHw)0.41 MacDonald and Langridge-Monopolis (1984) Qp= 0.763(VwHw)0.42 Costa(1985) Qp= 0.607Vw0.295Hw1.24 Froehlich(1995b) Time to peak outflow [h] tp = 0.0179(Ver)
0.364, where Ver = 0.00348(VoutHw)0.852 MacDonald and Langridge-Monopolis (1984)
0.25 ≤ tp≤ 1 Singh and Snorrason (1982,1984)
The regression-based equations are simple to apply and are not time consuming since the peak outflow can be calculated using only the Vw and Hw values, which have to be provided by the dam operator. However, due to their simplicity, these equations do not account for processes like soil erosion and material erodibility, which might be important
since, for example, erosion processes are related to the flow through the breach. A draw-back of the above equations lies in that they do not determine the time required for the breach initiation. The time parameter predicted by these methods is the time from the end of the breach initiation to the time of the peak outflow. Therefore, the time param-eters predicted by these equations help define the shape of the hydrograph but do not fully answer the question on how much warning time is available prior to the release of the peak outflow. The time from the first overtopping or seepage to the end of the breach initiation can be long and it is this time that is the most important to determine how much time is available for a warning and evacuation.
However, the different equations do not provide any error terms, which would be of utmost importance in the process of uncertainty quantification. To compare these equations between each other one can refer to the study byWahl(2004), in which it was concluded that theFroehlich(1995b) equation is the most accurate among the peak-flow prediction equations presented above.
4.1.2 Methods that predict breach development directly and the outflow analyti-cally
In these methods, the analysis of the dam-breach formation process is carried out sepa-rately from the analysis of the flow through the breach. Although the breach formation process is mostly common for embankment dams (of an earth fill and rock fill type), these methods are presented to give a general complete overview.
The dam-breach formation is modeled with regression methods that are based on his-torical data and aim to predict the parameters characterizing the breach development as a function of dam and reservoir characteristics without simulating the erosion processes. The estimated parameters describing a breach are typically the breach width and the for-mation time. The flow computation is handled analytically. Treating the breach opening as a weir control, the outflow can be calculated with the help of the weir equations, which are hydraulic equations that allow calculation of the flow using the parameters of a weir (width and height).
The empirical equations proposed by different authors are given in Table 3, where V0 is the volume of water released (m3), d is the depth of the reservoir (m). According to Wahl (2004), the most accurate methods for the estimation of breach width are by
Bureau of Reclamation(1988) andLawrence Von Thun and Gillette(1990), and the best
predictions of breach times are byFroehlich(1995a).
The dam breach development can also be simulated using more complex computer simulation models. One of the well-known models is the Dam-Break Flood Forecast-ing Model (DAMBRK) (Fread,1984). DAMBRK is the flood routing model employed by SFOE. It simulates the breach in a way that it is initiated at the top of the dam and ex-pands uniformly downward and outward to reach ultimate breach dimensions for a time specified by the user.
Table 3: Empirical equations for estimation of the parameters of the breach-formation process
Equation Reference
Breach width [m] B = 3(Hw) Bureau of Reclamation (1988)
B = 13.3(V0Hw)0.25 Froehlich(1987) Breach formation time [h]
tb= 3.84(V0)0.364d−0.9 Froehlich(1995a) tb= 0.011B Bureau of Reclamation
(1988)
tb= B/(4Hw+ 61) Lawrence Von Thun and
Gillette(1990)
However, none of the empirical equations or computer simulation models integrates a detailed simulation of the erosion processes that lead to dam breach.
4.1.3 Methods that model the erosion processes, the breach development and the flow in detail
These methods simulate the erosion processes and the associated hydraulics of flow through the developing breach to compute a breach outflow hydrograph, using the most recent developments in dam break modeling. Although erosion processes mostly take place in the body of the earth fill or rock fill dams, these methods are presented to give a general complete overview.
One of the models following this method is the BREACH model of the National Weather Service (Fread, 1988). It determines the ultimate breach width and breach formation time by accounting for the erosion processes since they are related to the flow through the breach. However, this type of model does not incorporate some of the fea-tures of a dam-break flood routing model, for example, the dynamic effects on the flow within the upstream reservoir. This might become a problem, if such effects are signifi-cant.
4.2 Dam failure case studies
The case study approach allows the dam-breach outflow hydrograph from a real case study of a dam failure. To choose the most relevant case studies for the purpose of this work, two main questions have to be answered:
• What dam type should be considered? • What failure type should be considered?
To decide which dam type to consider, it is necessary to know the research topics that are addressed in the case studies of different dam types. For example, the focus of published studies about gravity dams is more on the physical models of the dam structure,
Table 4: Failure rates for different dams in regions
on the properties and behavior of the concrete and on seismicity (Wang and Zhang,
2014; Kishen, 2005; Shi et al., 2014). On the other hand, the focus for arch dams is
mainly on the evaluation and simulation of the several substantial arch dam accidents and the validation of the simulated results with the available field data (Valiani et al.,
2002; Vacondio et al., 2013). Studies are presented in the literature mainly for two
historical cases: the Malpasset dam (429 fatalities, 1959, France) and the Vajont Dam (2,117 fatalities, 1963, Italy).
There is not much information in the gravity-dams-related studies on dam-breach outflow hydrographs. One of the rare examples is the study byBegnudelli and Sanders
(2007) who simulated the St. Francis dam-break flood. On the other hand, a signifi-cant amount of data is available on the dam-breach outflow in arch-dams-related studies. Numerical results (hydrographs at the different locations in the downstream valley) as well as field and laboratory data about the water depth and the velocity are provided, for example, for both the studies of the Malpasset and Vajont dams. Overall, the literature review indicates that the case studies for arch dam failures would be a reasonable source for the dam-breach outflow hydrograph. It is also a good feature for Switzerland situa-tion, since it was concluded in Chapter 2 that arch concrete dams are the representative dam type for the large Swiss hydropower sector. Dam failure rates for different dam types and regions, that are based on historical experience, have been published in several studies. Hirschberg et al. (1998) used their own database (ENergy-related Severe Acci-dent Database, ENSAD) for their analysis, and also provided references to other studies
(Baecher et al., 1980; DEFRA, 2002; Johansen et al.,1997). In a follow up study, Ebi
(2007) provided an updated overview of published dam failure rates. Table 4provides an overview of published dam failure rates. According to these data, overtopping would be the most probable cause of failure for arch dams in the Alpine region (Gruetter and
Schnitter,1982). However, cases of arch dams failed due to the weakness in foundation are known (e.g. Malpasset dam (Valiani et al.,2002)). The Technology Assessment group at the Paul Scherrer Institute (PSI) is currently completing the collection of data related to dam failures within ENSAD. When the current update of these data is completed, it will provide the basis to update Table4, and to make a more informed decision on the processes causing dam failures.
Based on the fact that arch dams and, most probably, overtopping failures appear to be a favorable scenario, the case studies of the Malpasset and Vajont dams are reviewed more in details.
4.2.1 Case study: the Malpasset dam
A case study of the Malpasset dam failure has been carried out by the researchers in the Dipt. di Ingegneria, University di Ferrara in Italy (Valiani et al.,2002). The Malpasset dam-break event occurred in Southern France, in 1959. The cause of failure was most probably the weakness of the foundations. This event caused 429 fatalities. Prior to its failure the dam was 66.5 m high with a reservoir of 55 Mio m3 .
The Malpasset dam break event is an ideal case for model validation, since extensive field data are available for the flood wave due to the break. The maximum water level was recorder by the police at several locations (denoted as P-P16 in Figure11) on both sides along the Reyran River Valley. The propagation time of the flood wave was estimated based on the shutdown time of three electric transformers located in the downstream valley.
In addition, some laboratory experiments were performed for this case. The data are available from the model built by the research group at the Laboratoire National d’Hy-draulique (LNH) of ´Electricit´e de France (EDF) in 1964. The maximum water level was recorded with gauges at several locations of the model (denoted as S1-S5 in Figure11).
The paper byValiani et al.(2002) presents a numerical simulation of the flood wave using the finite volume method (particularly the Godunov-type code (Van Leer,1997)) based on the 2D shallow water equations and on a finite volume cell-centered discretiza-tion techniques, see Sub-secdiscretiza-tion 5.3.4 for details. The software TELEMAC-2D, which was developed by EDF and HR Wallingford, was used to simulate free-surface flows in two di-mensions of horizontal space. It solves the Saint-Venant equations using a finite element method and a computational mesh of irregular triangular elements. It is able to simulate wetting and drying within the model domain (Hervouet and Bates,2000).
The following assumptions were made for the computation. In all simulations a total and instantaneous failure is considered. The initial water level in the reservoir is assumed to be 100 meters above sea level and the rest of the computational domain is treated as being in the dry bed condition. Therefore, the discharge of the downstream river is neglected due to the smallness of the ration of the river discharge and the discharge at the dam site due to the dam break.
Figure 11: The Malpasset dam case: surveyed points (P1 - P16), gauges (S1 - S14) and electric transformer (A, B, C) position (Valiani et al.,2002)
Time series of the water level at several locations along the length of the valley have been presented in Valiani et al.(2002). However, the time series of water level at sur-veyed point P2 (Figure12) is our main interest. Point P2 is located on the left bank of the valley right after the dam. Thus, a hydrograph corresponding to this particular time series (given byAureli et al. (2014) and Alcrudo and Gil (1999)) can be treated as the dam-breach initial outflow hydrograph, because it is the hydrograph prior to flood rout-ing through the valley. This initial outflow hydrograph could be used as an input to the risk assessment in this study. Another time series presented in the paper is given for the location at gauge S11, but it is not suitable for the purpose of this work. This gauge is located in the middle of the valley length where flood routing effects already took place. Thus, the hydrograph at gauge S11 is already specific for this particular topography.
Figure 12: The Malpasset dam case: time series of the water level: (a) at surveyed point P2; (b) at gauge S11 (Valiani et al.,2002)
Although the field data are available from the sources of LNH at EDF, France, retriev-ing them might be difficult. Therefore, a possibility is to extract the data from the given graphical images, for example, using image processing techniques.
The results of the computation are validated with the available field data and the data from laboratory experiments showing a good agreement with numerical results. The simulated value of the maximum water depth at point P2 is 89.34 meters (with 100696 elements mesh) and the value measured at this location was 87.20 meters.
4.2.2 Case study: the Vajont dam
The Vajont dam is an arch dam located in Northern Italy witha height of 262 m high and a reservoir of 168.7 Mio m3. In 1963 a rockslide fell into the artificial reservoir of the dam. This slide generated a tsunami that overflowed the dam and through the downstream narrow gorge reached the Piave valley and the village of Longarone, causing more than 2,000 fatalities. The dam itself remained intact.
Many studies have been completed to analyze the Vajont rockslide from a geologi-cal point of view. Furthermore, in several studies the wave generated by the rockslide was simulated. Firstly, the wave was reconstructed empirically based on the data col-lected by eye witnesses and by marks observed on the ground after the disaster (Selli and
Trevisan, 1964; Viparelli and Merla, 1968; Semenza, 2001; Datei, 1969). More recent
techniques, such as a 2D shallow-water models, have been applied to simulate the wave
(Bosa and Petti,2010). However, in this case the two-dimensional depth averaged
nu-merical scheme can give only approximated results, since it does not include a vertical velocity component and assumes that the pressure is hydrostatic.
Figure 13: The Vajont dam case: Estimated discharge hydrograph overflowing the dam (Vacondio et al.,2013)
Researchers of the University of Parma, Department of Civil Engineering, applied a 3D Smoothed Particle Hydrodynamics (SPH) model to simulate the wave (Vacondio et al.,
2013). SPH is a Lagrangian meshless method originally introduced in astrophysics (
(Monaghan,1994). This numerical technique enables the numerical simulation of free-surface flows with violent impact like breaking waves, dam-break phenomena (Crespo
et al.,2008), interactions between waves and coastal structures.
The numerical simulations resulted in the outflow hydrograph that overtopped the dam shown in Figure13. Two peaks can be observed in the hydrograph: the first peak with a discharge of about 50 · 103 m3/s (at 15 seconds) and the second peak with a maximum peak discharge of about 160 · 103 m3/s (at 30-40 seconds). A comparison between the results of the numerical simulation and the data available in literature (Selli
and Trevisan,1964;Viparelli and Merla,1968) shows that the numerical scheme is able
to fairly reproduce the real values of the peak flow.
4.3 Discussion and conclusions
In order to decide between the two proposed approaches for the estimation of the outflow hydrograph (case study or methodological) an extensive literature review has been carried out. In addition, personal discussions have been arranged with researchers in the field of dam-breach modeling.
Each of the two approaches has its advantages and disadvantages. Highlighting the information available for the each of them helps make a decision about an approach to be used in the current project.
The methodological approach is beneficial because it allows to take own decision re-garding the complexity of the model and a number of parameters to be considered. Ap-plying the simple regression approach of the first group of estimations can define the shape of the hydrograph, but the warning time, which is available prior to the peak out-flow, remains unknown. On the other hand, referring to the complex models of the third group accounting for the erosion processes, breach development processes and hydraulics in great details, the full computation of the dam-break outflow hydrograph and the quan-tification of the associated uncertainties is possible. However, the models of the second and third group are more applicable for embankment dams and have a large number of parameters which may be unknown at this time for concrete arch dams. Uncertain hy-drographs are yet to be built based on the existing empirical laws for peak flow and time to the peak flow.
On the other hand, the case study approach would be comparatively easier to ap-ply, because the main challenge here is to find good-quality information about the dam-breach outflow. One of the drawbacks of this approach is that the quantification of un-certainties for this information is limited. Highlighting the information available for the Malpasset and the Vajont dam case studies will help take the necessary decisions for the case study to be used as source for the outflow hydrograph of this project.
For the case study approach, the preliminary conclusion is to use the hydrograph from the Malpasset dam failure study. The dimensions of this dam are comparable with those of the representative dams for Switzerland. Furthermore, the computational techniques
used in the paper (finite volume method based on the 2D shallow water equations) are well-known and widely applied. Therefore, integration of the results in the flood routing software should not be a major issue. The exact location, at which the hydrograph is computed, is known to be right next to the dam, hence providing a good proxy for the dam-break outflow hydrograph. The Vajont dam case remains a good case study to apply in the current project. However, the resulting hydrograph is substantially influenced by the character of the wave and the applied SPH technique. Furthermore, the field data need to be found and checked. Another aspect is that there was no dam failure or breach in the dam, which might be more an exception than a representative case.
5
Dam-break flood simulation
Once the dam-breach outflow hydrograph has been estimated (see conclusions of Chapter 4), the information is used to simulate the flood propagated through the downstream topography. The main result of this is the hydrograph at any location of the city or town, where the impact of the flood has to be determined.
In this chapter the available methods for simulating the dam-break flood are dis-cussed. In particular, the types of equations to calculate the flow of water are presented, and, what numerical techniques should be used to solve these equations.
In order to make an informed decision, the components of the dam-break flood simu-lation model must be clarified. There are three main components: the input parameters, the simulation numerical elements and the desired output, which refers to a hydrograph at the location of interest. An overview of the methods available in the literature is given to understand the advantages and disadvantages of each method. Two large European projects, which conducted comprehensive dam-break modeling in recent years, have been reviewed to learn more from their experience.
5.1 Model for the dam-break flood simulation
The essential components of the model for the dam-break flood simulation or, in other words, the dam-breach hydrograph propagation are the following:
• the model input: hydrograph at the location of the dam, topography of the valley (Sub-section 5.1.1);
• the simulation of numerical elements: flow equations, numerical techniques to solve them (Sub-section 5.1.2);
• the model output: hydrograph at the location of the city (Sub-section 5.1.3). 5.1.1 The model input
The model input is a dam-breach outflow hydrograph, which was discussed in Chapter 4. Afterwards, this hydrograph is propagated through the considered computational domain representing the downstream topography. To generate this domain, the elevation data of the downstream area has to be imported into the modeling system.
In the context of dam risk assessment in Switzerland, the main question is what down-stream topography should be used? To answer this question one needs to specify the dam types of interest, namely concrete arch dams of 100 m or more height, with a reservoir of about 100 Mio m3 (see Section 2.4). In particular, 19 large arch concrete dams fulfill the aforementioned requirements in Switzerland. Considering their downstream topogra-phies, the choice has to be made between the following two options:
• a single downstream topography is chosen from these 19 topographies. This topog-raphy will be defined as a good representation for Swiss conditions in terms of its
geometry. Its Digital Elevation Model (DEM), the 3D representation of the terrain surface, is extracted from the Swisstopo database. Afterwards, the hydrograph is propagated through this topography.
• all considered 19 topographies are classified into families and a simplified geomet-rical sample (simulation) is generated for each family. Afterwards, the hydrograph is propagated through either each family of topographies or one chosen family. The pros and cons of these two alternatives still need to be discussed and evaluated before a final decision is taken.
The choice of a single topography or the classification of all available topographies can be done with visual inspection of the satellite images of the downstream topographies or with the help of automated landforms classification methods. The topographic position index (TPI) provides a tool that characterizes each cell in a DEM of the area according to the mean elevation of the specified neighborhood (Weiss,2001;Dragut and Blaschke,
2006).
It is important to note that the complexity of the topography will be described using a limited set of parameters. For example, the width, depth, and bottom slope of the valley could be used, whereas other parameters like vegetation type and soil content will not be considered in the first stage but may be introduced later when time allows. In the future a broader range of topography parameters may be included to achieve a higher accuracy. 5.1.2 The numerical elements of the simulation
A broad range of flow equations as well as numerical techniques to solve them is available in the literature. They can be classified as follows (Morris,2000):
• the number of simulated spatial dimensions (e.g. 1D, 2D, 3D);
• the equations describing the flow, e.g. the Shallow Water Equations (SWE) that describe the flow below a pressure surface in a fluid;
• the method applied to solve these equations (finite difference, finite volume, and finite elements models).
Those categories correspond to different types of floods and landscapes. To select the relevant methods, it is necessary to determine the type of flood that is relevant for this project and what topography will be used for flood propagation.
In terms of flood types, only studies about dam-breach flood propagation are of par-ticular interest, whereas studies about tsunami floods or large-scale floods in low-lying areas like the Netherlands are not relevant for the purpose of this study. The dam-breach flow behaves differently from the steady flow, especially right after the dam break occurs
(Soares Frazao and Zech,2002). Particularly, if there is water of any depth on the
faster than the local speed of sound in a fluid) occurs immediately after the dam fails (Wu et al.,1999).
In terms of topography, some characteristics, such as bottom slope, wetting or drying of terrain, as well as the shape of the valley, play an important role in the flood propaga-tion modeling. Therefore, it is critical to understand which topography types, and their corresponding parameters, are relevant for Switzerland. The model of the hydrograph propagation through this selected topography would be the representative model for the country. Results of the topographies classification from the model input will answer this question.
5.1.3 The model output
The output of the dam-breach hydrograph propagation is the hydrograph at the location of the city or town. The parameters that are estimated from the computed hydrograph and the elevation model at the location are (Morris,2000):
• the time of first arrival of the flood wave, • the maximum water level,
• the time to maximum water level, • the velocity of the flood wave.
5.2 Research projects on dam-break flood modeling
Two big research projects were carried out to study dam-break flood modeling in recent years. They are the Concerted Action on Dam Break Modeling (CADAM) project and the Investigation of Extreme Flood Processes & Uncertainty (IMPACT) project. Interna-tional research institutes with great experience in the field of dam breaks and dam-break flood modeling worked on these projects for several years. Their key findings, which are relevant for the current project, are summarized in the following sections.
5.2.1 The CADAM project: dam-break modeling including flood routing
The CADAM project was carried out within a period of three years (1998 - 2000) to establish the state of the art aspects of dam-break modeling, including flood routing, breach formation, sediments and risk management. Eight organizations were involved in this project: HR Wallingford (UK), ´Electricit´e de France (EDF) (France), Universit´e Catholique de Louvain (UCL) (Belgium), Universit¨at der Bundeswehr M¨unchen (UDBM) (Germany), Ente Nazionale per I’Energia eLettrica (ENEL) (Italy), Universidade Tecnica de Lisboa (IST) (Portugal), Universidad de Zaragoza (UDZ) (Spain), Vattenfall Utveckling AB (VU) (Sweden).
The models applied during the CADAM project used various forms of the Saint-Venant or Shallow Water Equations (SWE) (Morris, 2000). These equations are based on the
assumption of gradually varying flow conditions with a hydrostatic pressure distribution. Within CADAM three types of model were applied: finite volume, finite difference, and finite elements. Within the scope of CADAM it was not possible to identify a single best model appropriate to all dam-break flow conditions.
The tests undertaken within CADAM showed that 1D models offer comparable results to those from 2D model (Soares Frazao and Alcrudo,1998;Soares Frazao et al.,1999). The choice of 1D or 2D models is often made based on the preferences of a governmental organization managing the majority of dam-break studies in a country (e.g. ENEL in Italy or EDF in France) or can be driven by economic factors (e.g. a wide use of the Dam-Break Flood Forecasting Model (DAMBRK) software is due to its low complexity and cost effectiveness). It has been noticed that 2D Models have a slight tendency to underestimate the speed of the dam-breach flow, while 1D models tend to overestimate it.
5.2.2 The IMPACT project: extreme flood processes and associated uncertainties The IMPACT project ran for a period of five years (2000 - 2004). The project team comprised 9 partner organizations: HR Wallingford in United Kingdom, Universit¨at Der Bundeswehr Munchen (UniBwM) in Germany, Universit´e Catholique de Louvain (UCL) in Belgium, the Cemagref research institute in France, thex Centre for Advanced Studies on Hydrogeological Risk in Mountain Areas (CUDAM) in Italy, University of Zaragoza (UDZ) in Spain, the CESI company (acquired from the main Italian Electric Utility (ENEL)) in Italy, SWECO Gr¨oner AS in Norway, Instituto Superior Technico (IST) in Portugal, the GEO Group Company in the Czech Republic, and H-EURAqua Ltd. in Hungary. The work in the area of flood propagation focused on the following topics:
• to manage problems in propagation of the flood along a real valley;
• to develop more efficient models that are applicable to more complex problems; • to assess the performance of these methods against experimental data.
Furthermore, the mathematical framework for flood propagation modeling adopted in this work was the full nonlinear SWE in two dimensions (2D) applied to different com-puter models. One of the conclusions of the project is that models based on SWE provide a mathematical framework that is complex enough to represent most of the physics of actual flood flows.
The researchers found that problems can arise during the propagation of a dam-breach hydrograph through the downstream valley: deviation from the model hydro-dynamic assumptions, dominance of bottom slope and friction, wetting and drying of the terrain (Morris,2005).
In addition, the IMPACT project covered the topic of dam breach formation. However, the conclusions they made about this topic are not relevant for this project. The breach
formation modeling by IMPACT was done only for embankments and embankment dams, which are not in the focus of this work.
5.3 Case studies available in literature
Before the automated classification of Swiss downstream topographies is completed, only preliminary suggestions can be made about the type of case studies that are relevant using visual inspection of the satellite images of the dam downstream areas. Based on this preliminary analysis, studies addressing the following topics may be relevant for Switzerland:
• dam-break flow in a channel,
• dam-break flow in a channel with a sudden enlargement, • dam-break flow on dry bed in the presence of a bed slope;
A summary of studies related to the aforementioned geometries is presented in the following sections. Once the classification is completed, it is possible that either a search for additional case studies is necessary or that some of those already considered should be disregarded.
These studies do not only refer to the different geometries of the downstream area, but also to different approaches to improve the accuracy of the flood propagation model-ing by employmodel-ing different SWE, reformulatmodel-ing SWE, or trymodel-ing different numerical tech-niques to solve SWE.
5.3.1 Treatment of natural geometry in finite volume flow computations using re-formulated SWE
Capart et al.(2003) presented an example on how the natural geometry of the
down-stream area can be considered in finite volume flow computations. This case study is performed for the well-known dam-break problem (it is not mentioned which dam case it is exactly) in a channel with a zero bottom slope and unchanged cross-section. Water depth upstream the dam prior to the break is considered to be constant.
Standard finite volume schemes employing shallow water equations can produce sat-isfactory results for the cases with shock waves and flows transitions in irregular under-water depths along the flow propagation. However, they experienced problems balancing the hydrostatic pressure effects due to geometry variations.Capart et al.(2003) proposed a method for the treatment of irregular water flow depth in 1D finite volume computa-tions of open-channel flow based on a reformulation of the Saint Venant equacomputa-tions, which are a simplified unidimensional form of the general form of the shallow water equations given in Equation (6).
Generally, the St.Venant equations describing unsteady open channel flows are given as: