Éthique et économique/Ethics and Economics, 13 (1), 2016 http://ethique-economique.net/
of Ethical and Non-ethical publicly-listed
financial services companies
By/Par John Francis T. Diaz _
Assistant Professor, Department of Finance and Department of Accounting, Chung Yuan Christian University, Chung Li, Taiwan
di.jiang@cycu.edu.tw; johnfrancis_diaz@yahoo.com
A
BSTRACTThis study compares return and volatility performance of ethical and non-ethical publicly-listed financial companies through their long-memory and volatility asymmetry properties. The paper finds that the volatility of the daily stock price returns for both groups of financial companies can be used to predict their future values. Both also follow market fundamentals by exhibiting asymmetric volatility response properties, are not immune to negative shocks and experience losses in economic downturns. However, an interesting finding shows that ethical financial companies generally have higher returns and lower volatility than their non-ethical counterparts. This can be attributed to the positive perception of the investing public on ethical companies, which invites more potential investors providing them with steady investment flows. This study encourages fund managers and investors in continuously adding ethical investment instruments and creating portfolio related to corporate social responsibility initiatives. Findings can also offer more understanding in the properties of ethical financial companies, and open future channels of research to academicians and researchers.
Keywords: ethical and non-ethical financial companies, returns and volatility, long-memory models, volatility asymmetry property
R
ÉSUMÉCette étude compare le rendement et la volatilité des performances des sociétés financières éthiques et non-éthiques cotées, par leur mémoire longue et la volatilité des propriétés d'asymétrie. Ce papier constate que la volatilité des rendements quotidiens du cours des actions des deux groupes de sociétés financières peut être utilisée pour prédire les valeurs futures. Elles suivent également les fondamentaux du marché en présentant des propriétés de réponse à la volatilité asymétriques, ne sont pas à l'abri des chocs négatifs et des pertes d’expérience dans les ralentissements économiques. Toutefois, une constatation montre que les entreprises financières éthiques ont généralement des rendements plus élevés et une volatilité plus faible que leurs homologues non-éthiques. Cela peut être attribué à la perception positive du public investisseur sur les entreprises éthiques, qui invite plus d'investisseurs potentiels en leur fournissant les flux d'investissement stables. Cette étude encourage les gestionnaires de fonds et des investisseurs dans l'addition en continu des
Éthique et économique/Ethics and Economics, 13 (1), 2016
http://ethique-economique.net/ 13
instruments de placement éthiques et à créer des portefeuilles liés aux initiatives de responsabilité sociale des entreprises. Les résultats peuvent également offrir plus de compréhension des caractéristiques des sociétés financières éthiques, et ouvrir des voies futures de recherche pour les universitaires et les chercheurs.
Mots-clés: entreprises éthiques et non-éthiques, rendements financiers, volatilité, modèles à mémoire longue, asymétrie de la volatilité
JEL Classification: G11, M14
I
NTRODUCTIONInvestments in ethical portfolios and companies high corporate social responsibility (CSR) initiatives have already found their way into mainstream investing, and have strong demands from investors, particularly those that truly support socially responsible investments. The term Socially Responsible Investment (SRI) refers to the investments in enterprises with elevated sense of morality and higher number of socially responsible activities. These business organizations act in accordance to saving the environment, improving the conditions of community, and developing ways to uplift the level of corporate governance and transparency.
SRIs have become more appealing to the more discerning stakeholders in recent years as the number of business organization’s ethical issues being exposed over the last decade has increased dramatically. These issues were aggravated with the emergence of the Sub-prime Mortgage Crisis or the Great Recession in 2008, wherein financial services companies were found to be at the center of the problem. Criticisms emerged against big financial institutions like the American International Group (AIG), Lehman Brothers and Goldman Sachs regarding the reckless and irresponsible conducts of their businesses. These problems even more reinforced the clamor of both internal and external stakeholders in having more honest and transparent reporting of corporations, particularly in the financial services industry.
One of the active external stakeholders in business ethics is the Ethisphere Institute; a non-profit organization that advances the standards of ethical business practice. The organization recently released the 2015 World’s Most Ethical Companies. The list recognizes enterprises that go beyond the legal requirements of conducting business; promote ethical business practices in both inside and outside of their organizations; and help shape future industry standards by being role models of best practices. The list covered 50 industries and 21 countries, and named 13 financial services companies that have high standards in five key categories: 1) ethics and compliance; 2) corporate citizenship and responsibility; 3) culture of ethics; 4) innovation and reputation; and governance and leadership.
The inclusion of some financial services companies in the list of most ethical companies inspired this research. The study compares the stock performance of four ethical financial publicly-listed corporations, namely, Allstate Corporation (ticker: ALL), Hartford Financial Services Group (ticker: HIG), Northern Trust Corporation (ticker: NTRS), and Principal Financial Group (ticker: PFG) against four perennial nominees of non-ethical business conduct, namely, AIG (ticker: AIG), Bank of America (ticker: BAC), Goldman Sachs Group (ticker: GS) and J.P. Morgan Chase and Company (ticker: JPM). The latter four non-ethical
Éthique et économique/Ethics and Economics, 13 (1), 2016
http://ethique-economique.net/ 14
financial services corporations have been named by Market Watch and Yahoo! Finance websites, as companies with tainted reputation because of their huge negative involvement in the subprime mortgage crisis, and their unsatisfactory handling of claims and complaints in the aftermath of the problem. These things lead to the sour perception of the public on negligent and greedy corporations, and favor business organizations that balance morality and profitability. The benefits of patronizing ethical businesses have been highlighted in the study of Husted and Salazar (2006), which found that more social and economic output will be achieved by investing in socially responsible businesses. The study of Kempf and Osthoff (2007) also added that investing in companies with CSR activities lead to abnormal returns of 8.7% a year, which is higher than the average annual returns of the S&P 500 since inception. However, there are also some studies like that of Bauer et al., (2006) claiming that returns of SRI funds are underperforming, which was supported by the study of Hayat and Kraeussl (2011) on Islamic equity funds.
Empirical findings regarding the better performance of socially responsible and ethical investments are actually mixed. The study provides additional evidence regarding the stock return and volatility performance of ethical and non-ethical financial services companies through their long-memory and asymmetric volatility properties. Positive dependence or the so-called long-memory process captures the presence of a persistent temporal dependence among distant observations, which implies the predictability of a data time-series in both returns and volatility. On the other hand, the asymmetric volatility property of a financial data describes the negative correlation between returns and volatility innovations. This property is related to the leverage effects property, because negative shocks often are followed by higher market fluctuations than positive shocks. These data characteristics have been seen in stock returns (e.g., Mabrouk and Aloui, 2010; and Tan and Khan, 2010), exchange rates (e.g., Nouira et al., 2004; and Beine et al., 2002), commodities (Choi and Hammoudeh, 2009; and Kyrtsou et al., 2004), and even in CSR indices (Liu et al., 2014). However, there are no extensive literature comparing the predictability and asymmetric volatility properties of ethical and non-ethical publicly-listed financial services corporations. The research is motivated by the growing interest of the investing public in adding ethical publicly-listed companies in their equity portfolios; and the recent surge in the application of fractionally-integrated long-memory models in financial time-series being compared to short-memory models. This research is also motivated by the dearth in the literature of the relatively new academic discipline of Financial Ethics. The paper contributes by comparing two combinations of methodologies, namely, the short-memory ARMA-APARCH models; and the long-memory ARFIMA-FIAPARCH models in examining long-term positive dependence and volatility asymmetry in the stock returns and volatility of ethical and non-ethical financial services companies. In relation to the motivation and contributions, this research has four main objectives:
a) find out which group of financial services companies has higher returns and steadier stock price volatility;
b) identify the presence of the leverage effects and volatility asymmetry phenomena in the time-series of ethical and non-ethical financial services companies
c) examine positive long-term dependence, and examine the dual long-memory process in the stock returns and volatilities of study samples; and
Éthique et économique/Ethics and Economics, 13 (1), 2016
http://ethique-economique.net/ 15
d) determine which type of models (i.e., short- and long-memory models) are better to characterize future values of data samples using lagged returns.
The study is structured as follows: Section 1 presents the literature review; Section 2 details the data and methodology of ARMA-APARCH and ARFIMA-FIAPARCH models; Section 3 presents the empirical results; and Section 4 presents the conclusions, recommendations and limitations of the paper.
1.
L
ITERATURER
EVIEWThe literature is mixed when it comes to the performance of SRIs and ethical portfolios. Studies that favor ethical investments like Bercicci et al. (2001) found that SRIs experience positive returns and are used as proxy for the good overall performance of firms, this was later supported by O’Rourke’s (2003) claim that ethical mutual funds outperformed market averages. Furthermore, Reenebog et al. (2008) showed that SRI funds under European, North American, and Asia-Pacific portfolios have stronger performance than the comparison local portfolios. A more recent study of De and Clayman (2014) found that asset managers with high environment, social and governance (ESG) ratings experience higher portfolio returns over low ESG ratings. The paper also added that the benefit on CSR investing strengthens when markets are more volatile.
Studies saying otherwise like that of Bauer et al., (2006) for instance found that the returns of SRI funds actually underperform in general because of excessive screening fees. The continuation of Reenebog et al.’s (2008) study mentioned above also found that SRI funds in France, Ireland, Sweden, and Japan performed below conventional market portfolios. Moreover, Hayat and Kraeussl (2011) also showed that Islamic equity funds are underperformers compared with the usual equity benchmark funds. The study also concluded that Islamic equity funds performed worse in the recent financial crisis.
Neutral findings in the literature are also evident. For example, Bauer et al. (2005) found no significant differences in risk-adjusted returns among ethical and conventional funds of advanced countries like Germany, UK, and the US. Kreander et al. (2005) did a similar study and compared European ethical and non-ethical mutual funds. The study found no differences between their return performances, and added that neither fund could accurately time the market. The study of Hong and Kacperzyk (2009) has a unique claim and found that sin stocks like tobacco and alcohol have higher expected returns in times of recessions, because of the tendency of people to indulge in vices during miserable times.
The recent study of Liu et al. (2014) utilizing ARMA-APARCH models is the closest to this research when it comes to applying the same methodology. The paper studied return and volatility relations of the three main Thomson Reuters CSR indices, and their three major stock market indices counterparts. The research found both positive and negative effects of the CSR indices on the stock indices. The paper also concluded that both indices share typical investment characteristics and are not immune to bad economic fundamentals and other similar negative shocks.
Éthique et économique/Ethics and Economics, 13 (1), 2016
http://ethique-economique.net/ 16
2.
D
ATA ANDM
ETHODOLOGYResearch data were extracted from Yahoo! Finance website utilizing daily closing prices of eight public-listed financial services companies. The data start from July 1, 2009 or the month after the Great Recession ended according to the the National Bureau of Economic Research, and end in April 9, 2015. The Ethisphere Institute listed 13 ethical financial services companies, 7 of them are publicly-listed. However, 3 did not pass the initial data filtrations. The remaining 4 ethical financial companies were then compared with another 4 non-ethical financial publicly-listed companies. The study chose stocks that are actively-traded to ensure a better time-series data with the absence of zero trading volumes, which negatively affects returns and volatility, and the modeling of the financial time-series. The series of returns were computed as yt =100(logpt−logpt−1),where ptrepresents the price at time .t The financial time-series data were modeled by ARMA-APARCH, and
ARFIMA-FIAPARCH processes are explained below.
2.1 Short- and long- memory processes in the conditional mean
2.1.1 The ARMA Model
Box and Jenkins (1970) formulated time-series methodologies that models short-range correlations, where the predictors are previous observations represented by the AR function, and previous residual errors are captured by the MA process. The basic ARMA (r, s) model can be shown as:
s t s t t r t r t t y y y =
φ
1 −1+...+φ
− +ε
+φ
1ε
−1+...+θ
ε
− (1)and the general ARMA (r,s) can be represented as:
1 1 1 1 0 − = − =
∑
+ +∑
+ = j r i s j j t t i t y yφ
φ
ε
φ
ε
(2)where r denotes the order of the AR(r),
φ
i is the parameter, s is the order of the MA(s), θ jis the parameter andε
t is normally and identically distributed noise. Utilizing the number of parameters of the AR and MA components, ARMA models are flexible and able to describe the serial dependencies of time-series.3.1.2 The ARFIMA Model
Granger and Joyeux (1980) and Hosking (1981) introduced the ARFIMA model because fluctuations in time-series data over time often display long-range correlations. The ARFIMA model allows the difference parameter to be a non-integer and consider the fractionally integrated process I(d) in the conditional mean. The polynominals representing the ARFIMA (r,d,s) model can be denoted as:
t d L yt L L µ θ ε φ( )(1− ) ( − )= ( ) (3)
The fractional differencing operator (1−L)drepresents a notation for the following infinite polynominal:
Éthique et économique/Ethics and Economics, 13 (1), 2016 http://ethique-economique.net/ 17
∑
∞∑
= ∞ = = − Γ + Γ − Γ = − 0 0 ) ( ) ( ) 1 ( ) ( ) 1 ( i i i i i d L d L d i d i L π (4) Whereπ
i(z)≡Γ(i−d)/Γ(i+1)Γ(−d) and Γi denote the standard gamma function. When the difference parameter of the ARFIMA model is−
0
.
5
<
d
<
0
.
5
, the process is stationary where the effect of shocks toε
t decays at a gradual rate to zero. If d = 0, the process indicates short memory and the effect of shocks decays geometrically. When d = 1, there is a unit root process. For 0 < d < 0.5, the process represents a long-memory or positive dependence among distant observations. If -0.5 < d < 0, there is the presence of intermediate memory or anti-persistence. Whend
≥
0
.
5
, the process is called non-stationary, while5
.
0
−
≤
d
denotes a stationarity, but non-invertible process, which means that the data time-series cannot be represented by any AR model.2.2. Short and long-memory models in the conditional variance
2.2.1 The APARCH Model
Ding et al. (1993) developed the APARCH model to include a power term that represents periods of relative tranquility and volatility by magnifying the outliers in the time-series. The APARCH model estimates the optimal power term rather than imposing a structure on the data. The APARCH (p,q) model can be represented as:
∑
∑
= − − − = + − + = p j t j i t i i t q i i t 1 1 1 0 ( ) δ δ δα
α
ε
γ
ε
β
σ
σ
(5) whereα
0> 0, δ ≥ 0,βj ≥ 0,α
i≥ 0 and -1 <γ
i< 1.The APARCH model is flexible in varying the exponent δ with the asymmetry coefficient
γ
i to account for the leverage effect. The APARCH model can be reduced to the ARCH model when δ = 2,γ
i= 0 (i = 1,. . . ,p) and βj= 0 (j = 1,. . . ,p); and GARCH model when δ = 2 andγ
i= 0 (i = 1,. . . ,p).2.2.2 The FIAPARCH Model
Tse (1998) formulated the FIAPARCH model as another extension of the fractionally-integrated models. Making its short-memory counterpart, the APARCH process as the basis, FIAPARCH can be expanded to account for long-memory process through the factorization of the AR polynomial [1 −
β
( )
L
] =φ
(L)(1−L)d where all the roots ofφ( z)= 0 lie outside the unit circle. The FIAPARCH (p, d, q) model can be written as:( )
[
]
( )(
)
(
)
δ δω
β
φ
ε
γε
σ
t t d t = + − − L L −L − − } 1 1 1 { 1 (6) Where d denotes the fractional integration parameter, and gamma (γ
) represents the asymmetry model parameter. The FIAPARCH model has a long-memory process when 0Éthique et économique/Ethics and Economics, 13 (1), 2016
http://ethique-economique.net/ 18
<d< 1. The model illustrates that negative shocks have more impact on volatility than positive shocks when
γ
> 0. The FIAPARCH process can be also reduced to the FIGARCH model ifγ
= 0 andδ
= 2.3.
E
MPIRICALR
ESULTSTable 1 describes relevant statistical characteristics of ethical and non-ethical financial corporations. The group of ethical companies under study has a total market capitalization of US$33.28 billion, while non-ethical financial companies have a massive US$564 billion worth of capitalization as of April 2015 from the Yahoo! Finance website. Although, ethical financial corporations are small compared to non-ethical firms, data statistics show that ethical financial companies on average have significant higher returns and lower volatility compared to their non-ethical counterparts, which fulfill the first objective of this study. Ethical companies posted an average return of 6.23% with 1.89 data dispersion, compared to the 3.78% average return with 2.36 standard deviation of non-ethical corporations. For the other statistical metrics, three financial companies are positively skewed, while the rest of the samples are negatively skewed. All data samples also have positive kurtosis, and the significant Jarque-Bera statistic for residual normality indicated that all stock returns of financial companies under study are under a non-normal distribution assumption.
The paper posits that the higher returns and steadier stock price volatility of ethical financial companies are attributed to the positive perception of the investing public, which invites more potential investors providing them with steady investment flows. On the other hand, the lower returns and large fluctuations in stock prices of non-ethical companies are connected to the undesirable perception of the investing community. This is because of the negative publicities brought about by a series of litigations and complaints which lead to sell-offs and capital flight. The findings of higher returns in SRIs and ethical investments are are consistent with the earlier findings of Bercicci et al. (2001), O’Rourke (2003), Reenebog et al. (2008), and De and Clayman (2014). Thus, the research strongly recommends for fund managers to augment their equity portfolios with investments related to SRI and CSR initiatives, because of the capital inflows and positive gains being experienced by this sector in the recent past.
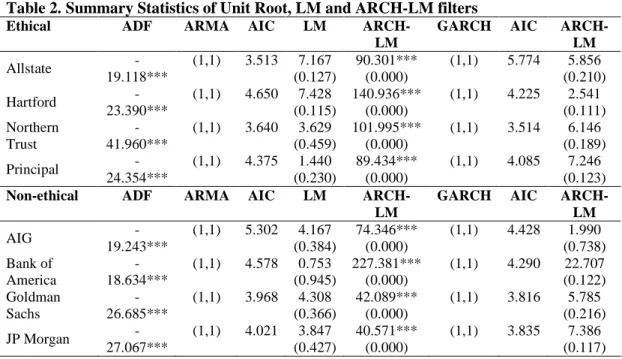
Table 2 illustrates statistics of time-series data using ARMA and GARCH filters. The Augmented Dickey-Fuller (ADF) test examined the stationarity of financial companies’ stock returns, and the test shows no unit roots for all data time-series. The study utilized the basic combination of one-lag AR and one-lag MA with its corresponding Akaike Information Criterion (AIC) as filters. All stock returns have no serial correlation, based on the insignificant results of the Lagrange Multiplier (LM) test. This paper used the ARCH-LM process to identify the ARCH effect, and showed that GARCH models can be applied in the sample with the initial test having significant results. The research also utilized the basic combination of having one-lag GARCH and one-lag ARCH with its corresponding AIC value as filters. The final test determined that all samples are free from heteroscedasticity, because the last ARCH-LM tests yield insignificant results.
Éthique et économique/Ethics and Economics, 13 (1), 2016
http://ethique-economique.net/ 19
Table 1. Data statistics of Ethical and Non-ethical financial services companies
Ethical Market cap. Mean Std.
Dev.
Skew. Kurt. J-Bera
Allstate Corporation 526 million 0.073 1.419 0.174 3.286 660.94***
(0.000) Hartford Financial Services
Group 751 million 0.087 2.484 0.319 5.500
1854.7*** (0.000) Northern Trust Corporation 17 billion 0.020 1.497 -0.239 3.574 786.75***
(0.000) Principal Financial Group 15 billion 0.069 2.177 -0.218 4.146 1051.3***
(0.000) Non-ethical Market cap. Mean Std.
Dev.
Skew. Kurt. J-Bera
American International Group 77 billion 0.078 3.483 1.808 41.008 1.025*** (0.000)
Bank of America 165 billion 0.013 2.408 -0.421 8.320 4231.2***
(0.000)
Goldman Sachs Group 89 billion 0.019 1.768 -0.535 5.381 1820.8***
(0.000) J.P. Morgan Chase and
Company 233 billion 0.041 1.821 -0.149 2.784
474.4*** (0.000) Note: *,**, and *** are significant 10, 5, and 1% levels respectively.
Table 2. Summary Statistics of Unit Root, LM and ARCH-LM filters
Ethical ADF ARMA AIC LM
ARCH-LM
GARCH AIC ARCH-LM Allstate -19.118*** (1,1) 3.513 7.167 (0.127) 90.301*** (0.000) (1,1) 5.774 5.856 (0.210) Hartford -23.390*** (1,1) 4.650 7.428 (0.115) 140.936*** (0.000) (1,1) 4.225 2.541 (0.111) Northern Trust -41.960*** (1,1) 3.640 3.629 (0.459) 101.995*** (0.000) (1,1) 3.514 6.146 (0.189) Principal -24.354*** (1,1) 4.375 1.440 (0.230) 89.434*** (0.000) (1,1) 4.085 7.246 (0.123) Non-ethical ADF ARMA AIC LM
ARCH-LM
GARCH AIC ARCH-LM AIG -19.243*** (1,1) 5.302 4.167 (0.384) 74.346*** (0.000) (1,1) 4.428 1.990 (0.738) Bank of America -18.634*** (1,1) 4.578 0.753 (0.945) 227.381*** (0.000) (1,1) 4.290 22.707 (0.122) Goldman Sachs -26.685*** (1,1) 3.968 4.308 (0.366) 42.089*** (0.000) (1,1) 3.816 5.785 (0.216) JP Morgan -27.067*** (1,1) 4.021 3.847 (0.427) 40.571*** (0.000) (1,1) 3.835 7.386 (0.117) Note: *,**, and *** are significant 10, 5, and 1% levels respectively.
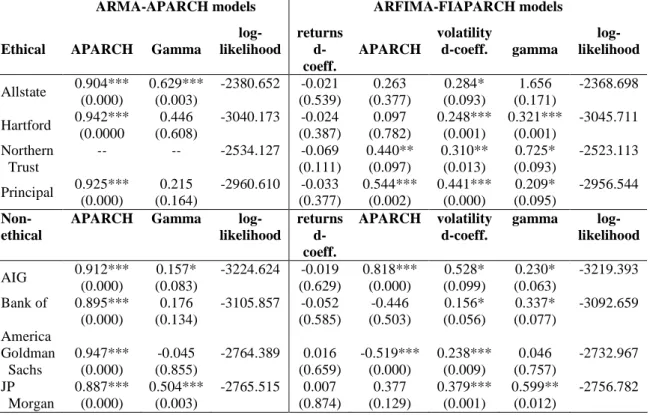
Table 3 compares the results of short-memory and long-memory models, and presents analyses on the asymmetric volatility properties of financial services companies’ stock returns performance. In determining the effects of lagged volatilities (APARCH coefficient),
Éthique et économique/Ethics and Economics, 13 (1), 2016
http://ethique-economique.net/ 20
ARMA-APARCH show a more consistent influence of previous volatility innovations (except for the Northern Trust Corporation where no convergence in the statistical calculation was met) compared to ARFIMA-APARCH models’ lagged volatility on current stock returns. The positive gamma parameter for Allstate Corporation, AIG and JP Morgan Chase and Company from the ARMA-APARCH models shows that their stocks exhibit asymmetric volatility properties. However, the ARFIMA-APARCH models illustrates that all financial services companies stock returns possess asymmetric volatility property except for Allstate Corporation and Goldman Sachs Group. This answers the second objective of this research and suggests that both group of financial companies, whether ethical or non-ethical are not immune to negative shocks, which means that bad news have stronger negative effect on their stock performance than good news. This characteristic is actually common to all investment instruments, and is consistent with the findings of Chen (2011), and Chen and Diaz (2012) with regards to their studies on ethical and faith-based exchange-traded funds (ETFs), respectively. The study of Bekaert and Wu (2000) earlier explained that negative shocks increases conditional variances in the financial markets substantially because of the high volatility feedback mechanism. This claim was particularly observed by Tan and Khan (2010) in their study of Malaysian stock markets during the subprime mortgage crisis. Although returns of ethical financial companies are higher and their volatility are steadier, these findings suggest that fund managers should not treat ethical financial companies as safe haven portfolios in times of economic downturns, because like many other investments they are also vulnerable to negative shocks.
One of the significant features of the ARFIMA-FIAPARCH models are its long-memory parameter through the d-coefficient, which determines the predictability of a given time-series data. Findings on the returns d-coefficient showed no long-memory properties because of insignificant values. However, positive dependence properties were evident in the volatility d-coefficient wherein all findings showed significant results. These results do not really conform to the third objective of this research regarding the dual long-memory process in the stock returns and volatilities. Nevertheless, findings still suggest that volatility structures of financial services companies under study have signs of market inefficiency and investors may possibly earn excess returns or can minimize losses by properly modeling their volatility fluctuations from past prices. These results offer a stark contrast on the weak-form EMH of Fama (1970) explaining that future prices cannot be predicted by analyzing previous prices, which also means that excess returns cannot be gained in the long run through data mining. However, similar with the findings of this paper, empirical evidences regarding the predictability of some investment instruments using technical analysis have been documented by the studies of Kang and Yoon (2007), Korkmaz et al. (2009), Tan and Khan (2010), Chen and Diaz in studying the South Korean, Turkish, Malaysian and Philippine stock markets, respectively. These also explain why technical analysis and data mining using sophisticated mathematical tools are growing exponentially in years.
In identifying the best fitting models for the ethical and non-ethical financial services companies, this study utilized the maximum log-likelihood values. The long-memory, ARFIMA-FIAPARCH models consistently are the better fitting models compared to their short-memory counterpart, ARMA-APARCH models. This finding corresponds to the last objective of this paper, and is consistent with the studies of Ruzgar and Kale (2007), Tansuchat et al. (2009), and Goudarzi (2010) in demonstrating the power of long-memory
Éthique et économique/Ethics and Economics, 13 (1), 2016
http://ethique-economique.net/ 21
models using time-series data of Istanbul stock exchange, commodity futures, and the Bombay stock exchange, respectively. The power of fractionally integrated models is said to be statistically attributed to the allowance given to the difference parameter to be a non-integer offering greater flexibility in modeling time-series data; and the hyperbolic rate of decay present compared to the exponential rate of decay in short memory models. These findings suggest that technical analysts should prioritize the use of long-memory models in modeling financial time-series.
Table 3. Long-memory and asymmetric volatility analyses using ARMA-APARCH and ARFIMA-FIAPARCH models
ARMA-APARCH models ARFIMA-FIAPARCH models
Ethical APARCH Gamma
log-likelihood returns d-coeff. APARCH volatility d-coeff. gamma log-likelihood Allstate 0.904*** (0.000) 0.629*** (0.003) -2380.652 -0.021 (0.539) 0.263 (0.377) 0.284* (0.093) 1.656 (0.171) -2368.698 Hartford 0.942*** (0.0000 0.446 (0.608) -3040.173 -0.024 (0.387) 0.097 (0.782) 0.248*** (0.001) 0.321*** (0.001) -3045.711 Northern Trust -- -- -2534.127 -0.069 (0.111) 0.440** (0.097) 0.310** (0.013) 0.725* (0.093) -2523.113 Principal 0.925*** (0.000) 0.215 (0.164) -2960.610 -0.033 (0.377) 0.544*** (0.002) 0.441*** (0.000) 0.209* (0.095) -2956.544 Non-ethical
APARCH Gamma log-likelihood returns d-coeff. APARCH volatility d-coeff. gamma log-likelihood AIG 0.912*** (0.000) 0.157* (0.083) -3224.624 -0.019 (0.629) 0.818*** (0.000) 0.528* (0.099) 0.230* (0.063) -3219.393 Bank of America 0.895*** (0.000) 0.176 (0.134) -3105.857 -0.052 (0.585) -0.446 (0.503) 0.156* (0.056) 0.337* (0.077) -3092.659 Goldman Sachs 0.947*** (0.000) -0.045 (0.855) -2764.389 0.016 (0.659) -0.519*** (0.000) 0.238*** (0.009) 0.046 (0.757) -2732.967 JP Morgan 0.887*** (0.000) 0.504*** (0.003) -2765.515 0.007 (0.874) 0.377 (0.129) 0.379*** (0.001) 0.599** (0.012) -2756.782 Note: *,**, and *** are significant 10, 5, and 1% levels respectively.
4.
C
ONCLUSIONS,
R
ECOMMENDATIONS ANDL
IMITATIONSThe research compared short-memory models, ARMA-APARCH; and long-memory models, ARFIMA-FIAPARCH, to examine return and volatility performance of ethical and non-ethical financial services companies. The study found that non-ethical companies on average have significant higher returns and lower volatility compared to their non-ethical counterparts. This result is attributed to the general positive perception of the market on ethical companies, which invites more capital inflows; and on the unfavorable perception of the investing public on non-ethical financial companies leading to the exodus of capital.
Éthique et économique/Ethics and Economics, 13 (1), 2016
http://ethique-economique.net/ 22
Evidence of asymmetric volatility properties are also present on both ethical and non-ethical financial services companies’ stock returns, which means that the two groups are not immune to negative shocks, making bad economic fundamentals have stronger negative effect on their stock performance. Regarding their long-memory properties, positive dependence on distant observations were evident in the volatility, making this paper believe that historical values of their stock prices through modeling the volatility can be used to predict their future values. In identifying the best fitting models, this study found that the long-memory attribute of ARFIMA-FIAPARCH models are better in fitting the time-series data models compared to the short-memory, ARMA-APARCH models.
The research strongly recommends that fund managers increase SRI- and CSR-related investments in their equity portfolios given the earnings potential that they are experiencing in recent years. However, this paper suggests that investors should not consider ethical financial companies as safe haven portfolios, because they are also vulnerable to negative shocks. Lastly, given that technical analysis can still be a potent tool in trying to predict their price movements, analysts in the future should see the potential of long-memory methodologies in modeling financial time-series
Given the above contributions, the study is not without its limitations. For example, the recent subprime mortgage crisis of 2008 is a good opportunity for structural break tests (i.e., application of Chow test or ICSS algorithm). Future studies can consider determining changes in return and volatility properties of the financial companies before, during and after crisis periods. Another limitation of this paper is that after determining the predictable structures of the time-series, it did not specify the type of forecast (i.e., one-step ahead, two-step ahead forecasts, and its extensions) that can fit the time-series data. This can be again a viable continuation of this study. The research also focused on financial services industry that were only subjected to specified test, subsequent studies can also apply other methodologies in the fractionally-integrated family of models (e.g., FIGARCH and FIEGARCH models), and use them to examine other types of ethical companies in other industries.
This research can serve as a stepping stone for both the investing public and academic community in the proper modeling of ethical and non-ethical financial services companies. The existence of long-memory and asymmetric volatility properties can assist traders and investors in building equity portfolios that can possibly maximize profits and minimize losses with the careful application of return and volatility models. The results can also offer academicians and researchers additional future research channels about the time-series properties of publicly-listed financial services corporations.
R
EFERENCESBauer, R, Koedijk, K., and Otten, R. (2006). ‘International evidence on ethical mutual fund performance and investment style.’ Journal of Banking and Finance, 29: 1751-1767.
Beine, M., Laurent, S. and Lecourt, C. (2002). ‘Accounting for conditional leptokurtosis and closing days effects in FIGARCH models of daily exchange rates.’ Applied Financial Economics, 12(8): 589-600.
Bekaert, G., and Wu, G. (2000). ‘Asymmetric volatility and risk in equity markets.’ Review of Financial Studies, 13: 1-42.
Éthique et économique/Ethics and Economics, 13 (1), 2016
http://ethique-economique.net/ 23
Bercicci, V., Hockerts, K. and Wagner, M. (2001). ‘Towards a better understanding of the correlation between corporate environmental sustainability and financial performance business strategy and the environment conference.’ Leeds University, UK.
Box, G., and Jenkins, G. (1970). ‘Time series analysis, forecasting and control, Holden-day.’ San Francisco.
Chen, J.H. and J.F. Diaz (2014) ‘Predictability and Efficiency of the Philippine Stock Exchange Index.’ Journal of Business and Economics, 5(4): 535-539.
Chen, J.H. and Diaz, J.F. (2012). ‘Spillover and leverage effects of faith-based exchange-traded funds.’ Journal of Business and Policy Research, 7(2): 1-12.
Chen, J.H. (2011). ‘The spillover and leverage effects of ethical exchange-traded funds.’ Applied Economics Letter, 18(10): 983-987.
Choi, K. and Hammoudeh, S. (2009). ‘Long memory in oil and refined products markets.’ The Energy Journal, 30(2): 97-116.
De, I. and Clayman, M. (2014). ‘The benefits of socially responsible investing: An active manager's perspective.’ SSRN working papers series, 2464204.
Ding, Z., Granger, C. W. J., and Engle, R. F. (1993). ‘A long memory property of stock market returns and a new model.’ Journal of Empirical Finance, 1: 83–106.
Fama, E. (1970). ‘Efficient capital markets: A review of theory and empirical work.’ Journal of Finance, 2: 383-417.
Goudarzi, H. (2010). ‘Modeling long memory in the Indian stock market using Fractionally Integrated EGARCH Model.’ International Journal of Trade, Economics and Finance, 1(3) : 231-237.
Granger, C. and Joyeux, R. (1980). ‘An introduction to long memory time series models and fractional differencing.’ Journal of Time Series Analysis, 1: 15-39.
Hosking, J. (1981). ‘Fractional differencing.’ Biometrika. 68: 165-176.
Hayat R. and Kraeussl, R. (2011). ‘Risk and return characteristics of Islamic equity funds.’ Emerging Markets Review, 12: 189-203.
Hong, H. and Kacperzcyk, M. (2009). ‘The price of sin: The effect of social norms on market.’ Journal of Financial Economics, 93: 15-36.
Husted, B.W. and Salazar, J. (2006). ‘Taking Friedman seriously: Maximizing profits and social performance.’ Journal of Management Studies, 43: 75–91.
Kang, S.H. and Yoon, S.M. (2007). ‘Long memory properties in return and volatility: Evidence from the Korean stock market.’ Statistical Mechanics and Its Applications, 385(2): 591-600.
Korkmaz, T., Cevik, E. and Ozatac, N. (2009). ’Testing for long memory in ISE using ARFIMA-FIGARCH model and structural break test.’ International Research Journal of Finance and Economics, 26: 188-191.
Kreander, N, Gray, R, Power, D, and Sinclair, C (2005). ‘Evaluating the performance of ethical and non-ethical funds: A matched pair analysis.’ Journal of Business Finance and Accounting, 32(7): 1465-1493.
Éthique et économique/Ethics and Economics, 13 (1), 2016
http://ethique-economique.net/ 24
Kyrtsou, C., Labys, W. and Terraza, M. (2004). ‘Noisy chaotic dynamics in commodity Markets.’ Empirical Economics, 29(3): 489-502.
Liu, L.L., J.F. Diaz and E. Ivagov (2014). ‘Linkages in Corporate Social responsibility Indices and Major Financial Market Indices.’ Journal of Advanced Studies in Finance, 2(10): 157-163.
Mabrouk, S. and Aloui, C. (2010). ‘One-day-ahead value-at-risk estimations with dual long- memory models: Evidence from the Tunisian stock market.’ International Journal of Financial Services Management, 4(2): 77-94.
Nouira, L., Ahamada, I., Jouini, J. and Nurbel, A. (2004). ‘Long-memory and shifts in the unconditional variance in the exchange rate Euro/US Dollar returns.’ Applied Economics Letters, 11: 591-594.
Ruzgar, B. and Kale, I. (2007). ‘The use of ARCH and GARCH models for estimating and forecasting volatility.’ Kocaeli Üniversitesi Sosyal Bilimler Enstitüsü Dergisi,14(2): 78-109. O’Rourke, A. (2003). ‘The message and methods of ethical investment.’ Journal of Cleaner Production, 11: 683-693.
Reenebog, L., Jenke, T. and Chendi, Z. (2008). ‘The price of ethics and stakeholder governance: The performance of socially responsible mutual funds.’ Journal of Corporate Finance, 14: 302-322.
Tan, S.H. and Khan, M.T. (2010). ‘Long memory features in return and volatility of the Malaysian stock market.’ Economics Bulletin, 30(4): 3267-3281.
Tansuchat, R., Chang, C.L., and McAleer, M. (2009). ‘Modeling long memory volatility in agricultural commodity futures returns.’ Report Econometric Institute, 35: 1–34.
Tse, Y. (1998). ‘The conditional heteroscedasticity of the Yen-Dollar exchange rate.’ Journal of Applied Econometrics, 193: 49–55.