HAL Id: hal-01987858
https://hal.archives-ouvertes.fr/hal-01987858
Submitted on 21 Jan 2019HAL is a multi-disciplinary open access archive for the deposit and dissemination of sci-entific research documents, whether they are pub-lished or not. The documents may come from teaching and research institutions in France or abroad, or from public or private research centers.
L’archive ouverte pluridisciplinaire HAL, est destinée au dépôt et à la diffusion de documents scientifiques de niveau recherche, publiés ou non, émanant des établissements d’enseignement et de recherche français ou étrangers, des laboratoires publics ou privés.
Implementing Cyclopentane Hydrates Phase
Equilibrium Data and Simulations in Brine Solutions
Son Ho-Van, Baptiste Bouillot, Jérôme Douzet, Saheb Maghsoodloo
Babakhani, Jean-Michel Herri
To cite this version:
Son Ho-Van, Baptiste Bouillot, Jérôme Douzet, Saheb Maghsoodloo Babakhani, Jean-Michel Herri. Implementing Cyclopentane Hydrates Phase Equilibrium Data and Simulations in Brine Solutions. Industrial and engineering chemistry research, American Chemical Society, 2018, 57 (43), pp.14774 à 14783. �10.1021/acs.iecr.8b02796�. �hal-01987858�
1
Implementing Cyclopentane Hydrates Phase Equilibrium Data and
Simulations in Brine Solutions
Son Ho-Van1,2*, Baptiste Bouillot1*, Jérôme Douzet1, Saheb Maghsoodloo Babakhani1, Jean-Michel Herri1
1
Ecole Nationale Supérieure des Mines de Saint-Etienne, SPIN, CNRS 5307, LGF, F-42023, Saint-Etienne, France
2
Oil Refinery and Petrochemistry Department, Hanoi University of Mining and Geology, Duc Thang, Bac Tu Liem, Hanoi, Vietnam
*Corresponding authors: son.ho-van@emse.fr (Son Ho-Van ) and bouillot@emse.fr (Baptiste Bouillot)
Keywords: Cyclopentane Hydrates; Phase Equilibrium; Brine; Experimental; Modelling.
Abstract
Cyclopentane hydrates-based salt removal is considered to be a possible promising technology for desalination. In order to optimize such processes, phase equilibrium data of Cyclopentane Hydrates (CPH) in saline solutions are crucial. Lamentably, these data sets are still incomplete. Therefore, earlier we published a limited experimental and modeling study on CPH equilibrium with some salts present.
This study extends experimental equilibrium to four more common brine systems: Na2SO4,
MgCl2, MgCl2-NaCl, or MgCl2-NaCl-KCl at various salt concentrations. Importantly, four
thermodynamic approaches: the Standard Freezing Point Depression equation based (SFPD), Hu-Lee-Sum (HLS) correlation, and the two van der Waals and Platteuw-based Kihara and Activity-Based Occupancy Correlation (ABOC) methods, are compared to this new set of experimental data. Results show that simulations agree adequately with measured data. Nonetheless, the ABOC method is the best model to reproduce rapid and consistent equilibrium data of CPH in brine, whatever the electrolytes involved.
Introduction
Clathrate hydrates are non-stoichiometric ice-like crystalline compounds formed by combination of a lattice of water molecules, and guest molecules. These guests are small molecules, capable to fit into the lattice cavities, such as CO2, CH4, N2, Cyclopentane, etc.1 Three main polymorphs of
2
clathrate hydrate are well known as structures I (sI), II (sII), and H (sH), composed of a certain number of cavities formed by water molecules through a hydrogen bonding system.1
Clathrate hydrates present many prospective applications, such as gas separation,2,3 gas storage,4,5 air-conditioning,6–8 carbon dioxide capture,9,10 and desalination.1,11,12 Recently, hydrate-based desalination has attracted significant interest due to international fresh water increasing demand.13–17
In hydrate-based desalination, solid salts and dissolved ions are excluded from hydrate crystals during crystallization. Hydrate crystals can then be separated from the aqueous solution using a solid-liquid filter. Fresh water and guest molecules can be isolated after hydrate dissociation. If the guest molecules are gaseous at standard conditions, or hydrophobic, they can easily be removed from fresh water. Afterward, they can be recycled into the desalination process.
Certainly, hydrate-based desalination method has been studied widely and intensively for many years (since the 1960s).13,15,18–25 Nevertheless, this technology is not ready for industrial scale use yet. As stated in the review work by Babu et al.16, there are still some challenges yet to overcome: high energy consumption issues, separating hydrate crystals from highly concentrated saltwater without impurities, and slow kinetics. Recently, He et al.15 suggested a new hydrate based desalination system using Liquefied Natural Gas (LNG) cold energy. Compared to multi-stage flash distillation (MSF), reverse osmosis (RO), and freezing desalination processes, this technology can be attractive since LNG cold energy replaces the external refrigeration cycle, and hence reduces the specific energy consumption.15 Obviously, this novel technology still requires a large and steady source of LNG cold energy. High-pressure reactor is also needed because propane is utilized to form hydrate.
Cyclopentane with water forms sII clathrate hydrates at around 7.1°C under atmospheric pressure.1,26 Because of its capability to form clathrate hydrates under such mild conditions, cyclopentane hydrates (CPH) is a promising candidate for water treatment applications, such as desalination. Recently, some authors have attempted to use CPH for desalination: Corak et al.27 (optimize the subcooling for CPH-based desalination), Han et al.28,29(use post treatment methods: washing, centrifuging, and sweating to remove excessive brine from CPH crystals), Cai et al.30 (desalination by using cyclopentane methane binary hydrate), Lv at al.31 (optimize kinetic of CPH-based desalination conditions), Xu et al.17 (use a three-step separation method, including gravitational separation, filtration, and a washing step with a salt removal efficiency of 81%).
3
However, before this CPH-based desalination technique is commercially ready, some important issues such as kinetic, thermodynamic (phase equilibrium data), entrapped salt quantity, and salt removal efficiency remain. They must be comprehensively understood and optimized. Unfortunately, in terms of CPH thermodynamics in presence of salts, there are still few experimental data available in the literature. Therefore, we previously compiled and verified equilibrium temperatures of CPH in presence of NaCl, KCl, NaCl-KCl, or CaCl2. Moreover,
three thermodynamic methods were applied to simulate them.26 Nonetheless, more phase equilibrium data in other salts are still required, and thermodynamic approaches still need to be compared to a wider range of experimental data.
Consequently, this effort extends experimental dissociation temperature to four other brine systems: Na2SO4, MgCl2, equi-weight mixture of MgCl2-NaCl and equi-weight mixture of
MgCl2-NaCl-KCl under wide-ranges of salt concentrations. Then, our three previously developed
thermodynamic models based on the Standard Freezing Point Depression method, or the van der Waals and Platteuw approaches, are again compared to this new data set. Moreover, a brand new method, the Hu-Lee-Sum (HLS) correlation is considered.
Experimental section
Chemicals
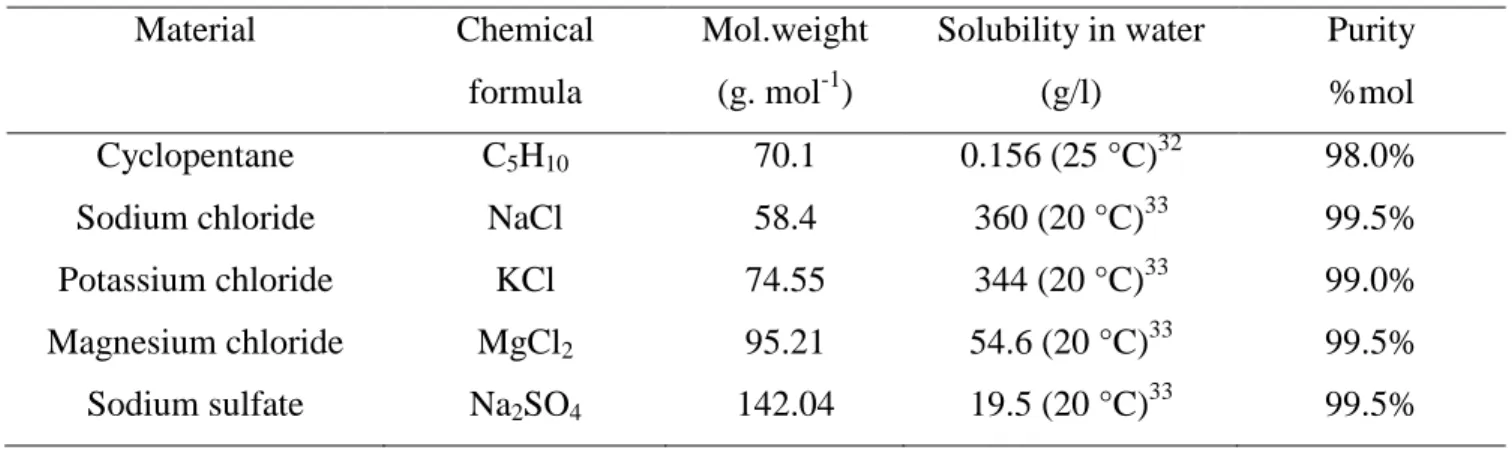
All chemicals used in this work were provided by Sigma-Aldrich Company. A water purification system was utilized to produce high-purity water with a conductivity σ ≤ 0.055 µS.cm-1 and TOC (total organic carbon content) less than 5 ppm. Details of chemicals are listed in Table 1.
Table 1. Purity of initial material used Material Chemical formula Mol.weight (g. mol-1) Solubility in water (g/l) Purity %mol Cyclopentane C5H10 70.1 0.156 (25 °C)32 98.0%
Sodium chloride NaCl 58.4 360 (20 °C)33 99.5% Potassium chloride KCl 74.55 344 (20 °C)33 99.0% Magnesium chloride MgCl2 95.21 54.6 (20 °C)33 99.5%
4
Apparatus
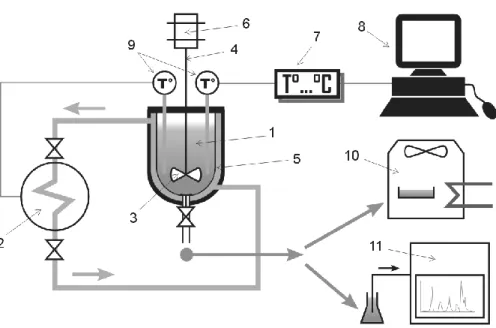
Experimental apparatus is detailed in Figure 1.
Figure 1. Diagram of the experimental apparatus
1-Vessel, 2-Chiller, 3-Impeller, 4-Agitator, 5-Cooling jacket, 6-Motor, 7-Temp transmitter, 8-Computer, 9-Temperature probe, 10-Drying oven, 11-Ion chromatography.
A jacketed glass reactor (1) with a volume of one liter is provided by Verre Equipments (France). A chiller Ministat 240 (2) controls constantly and homogeneously the temperature of the solution, and has an operating temperature range of [-45 °C to 200 °C] with a stability of ± 0.02 °C. The coolant used is a mixture of water and ethylene glycol (44% mass). The solution inside the reactor is mixed by an impeller (3) powered by a motor (6). Two temperature probes (9) are utilized to monitor the aqueous mixture. A transmitter (7) transfers temperature data to a computer (8). LabVIEW observes and records the digital information throughout the course of experiments. To measure salt concentration of the solution, an ionic chromatography (Dionex DX-500 IC) system (11) was utilized. A drying oven (Binder) (10) was employed only for a second salt concentration measurement in the experiments with Na2SO4 solution.
Procedure
To determine the CPH dissociation temperatures, two procedures (quick and slow) are used as described in more detail in a previous article.26
5
Quick procedure:
In the reactor are introduced 500g of pure water, a chosen amount of salt, and 114.38g of CP (corresponding to the hydrate molar ratio water:CP = 17:1). Then, the solution is cooled down to a temperature above the freezing-point of the salt solution. Crystallization is triggered by introducing grams of ice and a corresponding amount of salt to keep a constant salinity. After 1 - 2 hours of crystallization, the chiller is stopped. CPH then dissociates progressively. A sharp rise in temperature is observed when no hydrate is present in the reactor. This point corresponds presumably to the dissociation temperature of CPH. 1 ml and 5 ml of brine solution are taken to measure salt concentration by ion chromatography and drying oven. This step is necessary to make sure all CPH have dissociated.
Of course, due to the high heating rate, this procedure is not quite accurate enough. However, it provides a stepping stone for the next procedure.
Note that, MgCl2 should form salt hydrates (MgCl2.6H2O) after water evaporation at 60°C (set
temperature of drying oven for all experiments).34,35 Therefore, the drying oven was not employed with solutions containing MgCl2 andionic chromatography only was used instead.
Slow procedure:
A duplicate experiment is performed with a different dissociation procedure. After 1 - 2 hours of crystallization, chiller is functioned manually as follows:
The first heating step increases the temperature to a temperature of 4°C below the prior dissociation temperature recorded by the quick procedure. After stabilization, the temperature inside the reactor is increased at an increment of 0.1°C. Then, the temperature is remained constantly for at least 1 hour. If no significant CPH dissociation is observed after 1 hour, the temperature is augmented again by the same increment. This process is iterated until a small amount of hydrate is observed. The temperature is then kept steady for a longer time (12h-24h) to ensure that equilibrium is reached. The last step is required when hydrate is still present. The CPH dissociation temperature is recorded during next to last step as all three phases (CP, CPH and brine) exist.
Images of the aqueous mixture are taken at every step. These images are then compared in order to determine the final step in which only two transparent phases of brine solution and CP can be observed as seen in the initial condition (pictures provided in the previous study26).
6
Moreover, to make sure that there are no longer any CPH in the bulk at the final step, 1 ml and 5 ml of brine solution are sampled to measure salt concentration.
Experimental results
All experimental results on phase equilibrium data of CPH following the slow dissociation procedure are provided in Table 2 and Figure 2. Note that the mass ratio MgCl2:NaCl is 1:1 in the
equiweight mixture of MgCl2-NaCl and the mass ratio MgCl2:NaCl:KCl is 1:1:1in the equiweight
mixture of MgCl2-NaCl-KCl.
Our measure results show that the equilibrium temperatures obtained by the slow dissociation procedure (Tslow) are systematically lower than those provided by the quick dissociation procedure (Tquick). This difference between the measured data from both procedures (∆T= Tquick- Tslow) ranges from 0.3°C up to 3.2°C. We believe that quick dissociation procedure likely misses the total dissociation temperature, i.e. the equilibrium temperature, as stated by Ho-Van et al.26. Hence, the slower process furnishes more trustworthy and consistent equilibrium data than the quick.
Figure 2 indicates that the equilibrium temperatures considerably decrease with higher salt concentrations. Of course, electrolytes in solution affect significantly water activity, and hence CPH phase equilibria. Both phenomena of clustering and salting-out lower the equilibrium temperature of CPH.1,26,36 Moreover, influence on equilibrium temperature is different for each salt. For instance, Table 2 reveals that the measured dissociation temperatures for Na2SO4 are
higher than those for MgCl2, MgCl2-NaCl, or MgCl2-NaCl-KCl. This can be attributed to the
lower water activity and molality in presence of Na2SO4 compared to others salt at same
7
Table 2. Equilibrium temperaturesa of CPH in the presence of Na2SO4, MgCl2, an equiweight
mixture of MgCl2-NaCl, or an equiweight mixture of MgCl2-NaCl-KCl (slow dissociation
procedure) Salinityb,c,d,in % mass in Na2SO4 (°C) in MgCl2 (°C) in MgCl2-NaCl (°C) inMgCl2 -NaCl-KCl, (°C) 0 7.1 7.1 7.1 7.1 1 6.7 6.7 6.5 6.7 2 6.4 6.2 6.1 6.1 3.5 6.0 5.2 5.1 5.2 5 5.6 4.3 4.1 4.6 6 5.3* - - - 8 - 2.1 2.3 2.7 10 - 0 0.5 1.2 12 - -2.2 -1.6 -0.2 14 - -5.2 -3.6 -1.8 16 - -8.7 -5.8 -3.8 18 - -12.7 -8.8 -5.7 20 - -17.6 -12 -8 22 - - -15.5 -10.8
* corresponds to eutectic point. a Uncertainty of the temperature measurements: ±0.1 °C. b Uncertainty due to weighing: ±0.002 %mass. c Uncertainty due to drying oven: ±0.2 %mass. d Relative uncertainty due to ion chromatography: 1.5% (see the supporting information from Ho-Van et al. 26 for all uncertainty estimations).
8
Figure 2. Experimental equilibrium temperature of CPH in the presence of salts (slow procedure only)
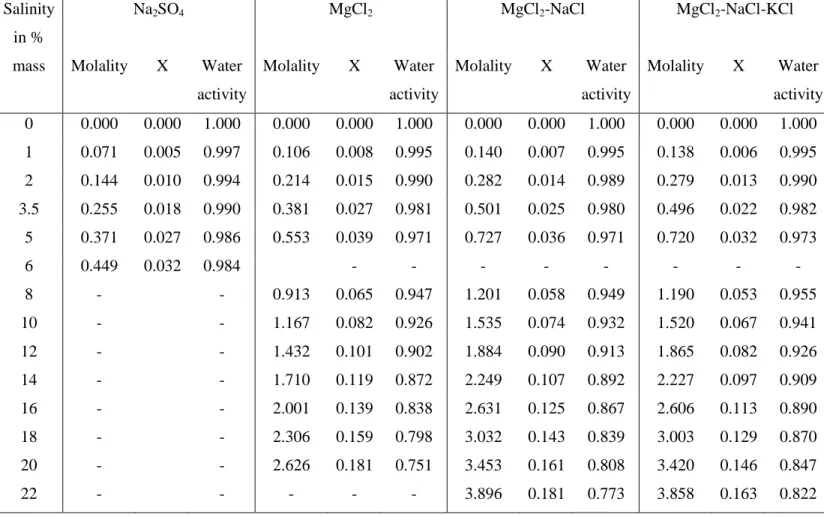
Indeed, as seen in Table A1 (in Appendix I), MgCl2-NaCl and MgCl2-NaCl-KCl mixtures have
approximately the same molality at the same salt concentration (in % mass). Therefore, the variance in the dissociation point between these two brine solutions can be observe through the role of each salt when ions interact with water molecules. Table 2 illustrates that the equilibrium temperatures in the brine system of MgCl2-NaCl are lower than those in the brine system of
MgCl2-NaCl-KCl. This means the effect of NaCl on phase equilibria is stronger than KCl. In
addition, MgCl2 shows the significant impact on the equilibria at concentration above 8% mass.
This is because MgCl2 has a considerable influence on water activity even at lower molality at the
same salt concentration (see Appendix, Table A1).
In fact, the effect of each salt on hydrate phase equilibria depends on ions charge density. Observations showed that small cations with high charge density can lead to powerful electrostatic interaction between the cations and water molecules. This weakens hydrogen bonding interaction between water molecules, inhibiting the hydrate formation.37,38
9
The ionic radius of Mg+2 (+2 charge), Na+ (+1 charge) and K+ (+1 charge) are 0.78Å, 1.02 Å and 1.38 Å, respectively.37,38 Hence, the charge density of Mg+2 is higher than Na+ or K+. According to Sabil et al.37 andCha et al.38, the hydrate inhibiting strength rises in the following order: Mg+2 >Na+ >K+. This agrees well with our observation in the presence of MgCl2 (above 8%mass),
MgCl2-NaCl, and MgCl2-NaCl-KCl.
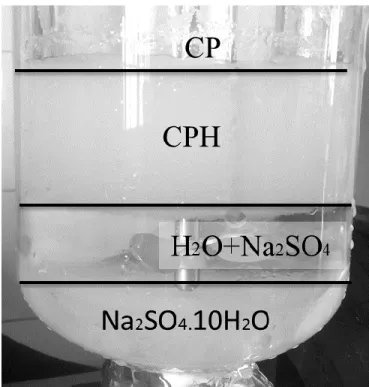
Then, at 8% mass Na2SO4, when hydrate formed, co-precipitation of salt hydrates was observed
at the bottom of the reactor (at temperatures less than 7°C, see Figure 3). Indeed, according to phase diagram of Na2SO4 with water39, we expect Na2SO4 to form Na2SO4.10H2O hydrates in the
system under these conditions. Indeed, both CPH and Na2SO4.10H2O hydrates dissociate
concurrently when increasing temperature. When no CPH was observed, the temperature of system was recorded to be 5.4°C following the slow procedure (see Figure 4). Therefore, 5.3°C was recorded to be the dissociation point for CPH phase. However, Na2SO4 hydrates were still
present at the bottom of the reactor. Consequently, salt concentration in aqueous phase was not 8% mass. At this moment, two samples of 1 and 5 ml were then taken by a syringe Rhizon with a mean pore size of the porous part of 0.15 µm in order to separate salts solid or any crystal from the aqueous solution (see Figure 4). Both drying oven and ionic chromatography provided an identical measured salt concentration of 6%. Therefore, 5.3°C at 6% salt concentration is the eutectic point of the four-phase system (Na2SO4 + H2O, Na2SO4.10H2O, CP, and CPH). This
means that if the temperature is decreased below 5.3°C at 6% mass salt concentration, CPH and Na2SO4.10H2O will form simultaneously.
10
Figure 3. Photo of the experiment with Na2SO4 at 8%, 5.2°C following the slow procedure.
11
Modelling CPH thermodynamic equilibrium
In this effort, four different approaches are utilized to model phase equilibria of CPH in the presence of salts. The first approach is based on the standard freezing point depression equation.40,41 The second is a new correlation by Hu et al.42,43, called HLS correlation. It is a derivation of the freezing point depression equation developed especially to calculate gas hydrate suppression temperatures in presence of single salts (Hu et al.42), or salt mixtures (Hu et al.43). The two others methods are based on van der Waals and Platteuw model.44 As aforementioned, these approaches are described in detail in our previous article.26
In the following, average absolute deviation (AAD) between experimental and simulated results is defined as follows:
𝐴𝐴𝐷 =𝑁1∑𝑁 |𝑇𝑖,𝑝𝑟𝑒𝑑− 𝑇𝑖,𝑒𝑥𝑝|
𝑖=1 (1)
where N is the number of experimental data points, Ti,pred (K) the predicted-equilibrium
temperature, and Ti,exp (K) the experimental equilibrium temperature.
Standard Freezing Point Depression (SFPD) approach
In this approach, water activity in brine with the CPH present is expressed as follows40,41: ln 𝑎𝑤 =∆𝐻𝑓𝑚 𝑅 (𝑇𝑓−𝑇) 𝑇𝑓𝑇 + ∆𝐶𝑓𝑚 𝑅 [ (𝑇𝑓−𝑇) 𝑇 − 𝑙𝑛 ( 𝑇𝑓 𝑇)] (2)
where Tf is the dissociation temperature in K45, ΔHfm the molar enthalpy of dissociation in
J/mol45, ΔCfm the change of molar specific heat between the sub-cooled liquid and the crystals in
J/mol/K, and aw the water activity. PHREEQC46 was employed to calculate water activity in brine
using PITZER database.
ΔCmf is only unknown and could not be ignored. Therefore, a correlation for ΔCmf established
previously26 using experimental data in the presence of NaCl under the form as follows:
∆𝐶𝑓𝑚 = 𝐹(𝑇) = 𝑎 × exp(𝑏 × 𝑇) (3)
The equilibrium temperatures of CPH in other brine solutions (Na2SO4, MgCl2, MgCl2-NaCl, or
12
Hu-Lee-Sum (HLS) correlation Hu et al.42,43 observed that ∆𝐻𝑛𝑅
𝑑𝑖𝑠𝑠 remains constant, while ∆T
𝑇0𝑇only depends on the effective mole fraction. Therefore, they developed a new correlation for the suppression temperature (∆T = To –
T) based on equation (2) as follows:42,43,47
∆T 𝑇0𝑇 = − nR ∆H𝑑𝑖𝑠𝑠ln 𝑎𝑤 = 𝐶1𝑋 + 𝐶2𝑋2+ 𝐶3𝑋3 (4) where To and T are the hydrate equilibrium temperatures in pure water and brine solution,
respectively. ΔHdiss is the hydrate dissociation enthalpy, n the hydration number, and aw the water
activity. C1, C2, and C3 are fitted coefficients, X the effective mole fraction. X can be expressed as
follows43:
X = ∑𝑗=𝑠𝑎𝑙𝑡𝑠∑𝑖=𝑖𝑜𝑛𝑠|𝑧𝑗,𝑖|𝑥𝑗,𝑖 (5) where i and j represent the ion and salt, respectively. z is the ion charge number, x the mole fraction. In the end, the hydrate formation temperature is:
𝑇 = 𝑇0[1 + (𝑇∆T 0𝑇) 𝑇0]
−1
(6)
Equation (4) was originally developed for structure I hydrates, but has been derived for salt mixtures and structure II hydrates lately.43 To account for SII hydrates, the authors suggested a new parameter α: 𝛼 =( ∆T 𝑇0𝑇)𝑆𝐼𝐼 (∆T 𝑇0𝑇)𝑆𝐼 (7) So that: 𝑇 = 𝑇0[1 + 𝛼 (𝑇∆T 0𝑇)𝐼𝑇0] −1 (8)
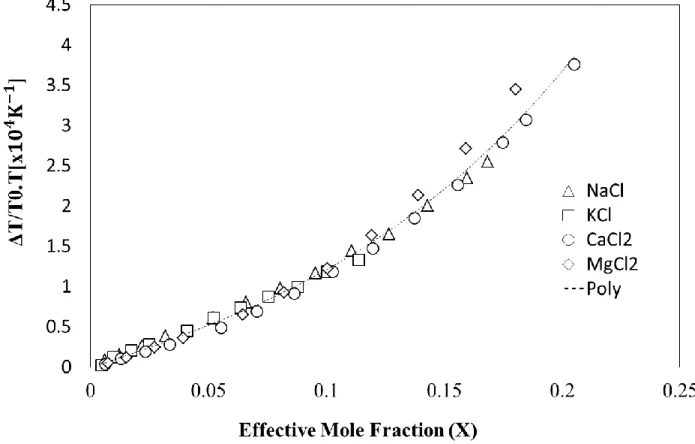
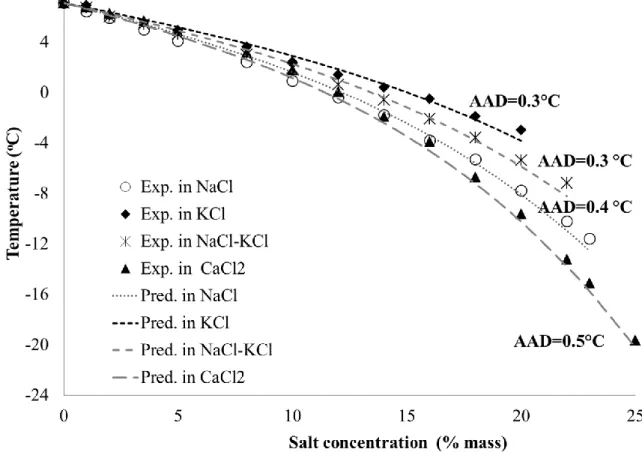
By this mean, SII hydrate suppression temperature is correlated to SI suppression temperature. In our work, the studied system is different since no gas molecules are considered. Instead, cyclopentane is the guest molecule, and the pressure dependency of CPH is negligible. Therefore, we first checked Hu et al. assumption in water+CP+salt systems considering the same salts {NaCl, KCl, CaCl2, MgCl2}. Figure 5 shows that
∆T
𝑇0𝑇 is indeed strongly correlated to the effective mole fraction (see also equation 4), although there is a slight deviation for MgCl2 system at high
concentrations (X>0.15).
Since the parameters furnished by Hu et al.42 have not led to satisfactory simulation for CPH formation temperature (see Appendix II), data from Figure 5 have been used to optimize C1, C2,
13
and C3 coefficients. Note that, on Figure 5, dissociation points of CPH in the presence of NaCl,
KCl, and CaCl2 come from Ho-Van et al.26 and results involving MgCl2 come from the present
work. Figure 5 shows the CPH depression temperature versus the effective mole fraction of NaCl,
KCl, CaCl2, and MgCl2. Based on Figure 5, and Hu et al., ∆T
T0T can be expressed as a fitted function of X as follow (regression coefficient R= 0.990):
∆T
𝑇0𝑇 = 0.000956623X + 0.00059779𝑋
2+0.01897593𝑋3 (9)
Hence, C1, C2, and C3 for CPH are now determined to be 0.000956623, 0.00059779, and
0.01897593, respectively.
Figure 5. The CPH hydrate depression temperature versus the effective mole fraction of NaCl, KCl, CaCl2, and MgCl2.
14
Kihara Approach
van der Waals and Platteeuw model44 is a standard approach in clathrate science1. Its use for CPH crystallization from brine has been explained by Ho-Van et al.2. Therefore, it will not be detailed in this section. However, for the sake of understanding, here is some basic information.
Equilibrium is calculated by searching uniform chemical potentials of water in both liquid and hydrate phase. A reference state (β) is used: the empty clathrate. Hence, it can be expressed as follow: ∆𝜇𝑤𝛽−𝐻 = ∆𝜇𝑤𝛽−𝐿 (10) L w
, the difference between chemical activity of water in β state and liquid phase can be expressed from the Gibbs-Duhem equation48, whilst
wH, the difference between β state and hydrate phase can be calculated via van der Waals and Platteeuw model as follows:∆𝜇𝑤𝛽−𝐻 = −𝑅𝑇 ∑ 𝑣𝑖 𝑖ln(1 − ∑ 𝜃𝑗 𝑗𝑖) (11)
where R is the universal gas constant, T the absolute temperature, νi the number of type i cavities
per water molecule in the hydrate (just 8/136 for CPH since cyclopentane only occupies large cavities of sII), and𝜃𝑗𝑖 the occupancy factor (𝜃
𝑗𝑖[0, 1]) of the cavities of type i by the guest
molecule j (the guest molecule here is CP). Occupancy factor 𝜃𝑗𝑖 can be obtained from integration
of Kihara potential (Parrish et al.49), and fugacity of guest molecules. It will not be developed hereafter. However, the reader should now be aware that calculation of
wH is possible under the condition that Kihara parameters (maximum attractive potential ε, distance between the cores at zero potential energy σ, and the hard-core radius a) are available. In our previous work, optimization of these parameters for cyclopentane has been performed for ε and a (the hard core radius is supposed to be known). Results are presented in Figure 8.In this approach, activity of water is needed for the chemical potential of water in liquid phase, as well as specific thermodynamic properties. Like the first approach, PHREEQC has been used for water activity. The others parameters have been chosen, and taken from literature, based on previous work and observation (Herri et al.48 and Ho-Van et al.26).
15
Activity-Based Occupancy Correlation (ABOC) approach
The fourth approach is similar to the latest. However, instead of using Kihara parameters, ergo an interaction potential, a more simple approach has been used. Instead of considering a Langmuir type method for the occupancy of cavities, an elementary correlation between the occupancy factor and water activity, F
aw , can be used.26 By this mean, the knowledge of water activity (with PHREEQC, or any activity coefficient method, for instance) is enough to estimate θ. The correlation is expressed as follow:𝜃(𝑎𝑤) = 𝑚 × (𝑎𝑤2) + 𝑛 × (𝑎𝑤) + 𝑝 (12)
where m, n and p are the empirical constants reported by Ho-Van et al.26: -0.0004772, 0.0004731, and 0.9998800 respectively. Note that these constants have been obtained from CPH equilibrium points in water + NaCl mixtures only.
Modelling results
SFPD approach
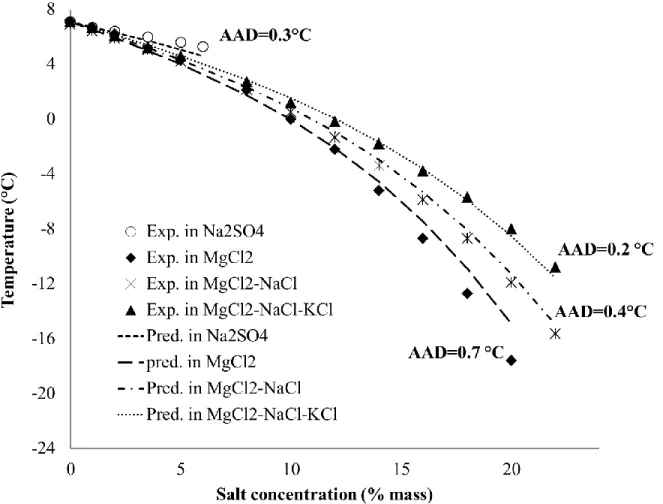
Figure 6 illustrates the experimental and predicted equilibrium temperatures according to the SFPDapproach. Absolute average deviations are: 0.1°C in Na2SO4; 0.3°C in MgCl2-NaCl-KCl;
0.4°C in MgCl2-NaCl; and 0.5°C in MgCl2. Results indicate that dissociation temperatures are
relatively well reproduced using the ΔCmf(T) correlation for CPH.
Unfortunately, there is a significant gap between the modelling and experimental data in presence of MgCl2 (≥ 18% mass) and MgCl2-NaCl mixture (≥ 20% mass). This might be due to water
activity calculations. However, since our fourth approach (ABOC) provides better results using the same estimation tool (PHREEQC), deviations seem to be due to the method itself and its simplified hypothesis (considering CPH as a pure water crystal with its specific thermodynamic properties).
16
Figure 6. Experimental and predicted dissociation temperature of CPH in the presence of salts according to the SFPD approach
HLS correlation
The CPH equilibrium temperatures in brine solutions of MgCl2-NaCl, MgCl2-NaCl-KCl, or
Na2SO4 have predicted using equation (6) using the three coefficients obtained earlier (equation
9). Simulated results are presented in Figure 7. They are in relatively good agreement with the measured data. Average absolute deviations are: 0.3°C for Na2SO4, 0.2°C for MgCl2-NaCl-KCl,
0.4°C for MgCl2-NaCl, and 0.7°C for MgCl2.
HLS correlation is however less comfortable with MgCl2.42 This is not surprising when looking at
Figure 5. Indeed, there is a behavior deviation from equation (9) (higher 𝑇∆T
0𝑇 than correlation curve for X>0.15).
17
Figure 7. Experimental and predicted dissociation temperature of CPH in the presence of salts according to HLS approach
Kihara approach
Figure 8 reveals the experimental and predicted hydrate equilibrium temperatures of Kihara-based method. In this case, the simulated results agree reasonably well with the experimental data. Average absolute deviations are less than 0.2°C in the presence of Na2SO4, MgCl2-NaCl, or
MgCl2-NaCl-KCl, and regrettably about 0.5°C in presence of MgCl2.
18
Figure 8. Experimental and predicted dissociation temperature of CPH in the presence of salts, and Kihara parameters for CP obtained by using the experimental data in NaCl
Activity-Based Occupancy Correlation (ABOC)
The simulated results of CPH phase equilibrium with ABOC method are presented in Figure 9. Predicted results agree well with the experimental data. Importantly, the average absolute deviation is about 0.1°C for either Na2SO4 or MgCl2-NaCl or MgCl2-NaCl-KCl and about 0.2°C
for MgCl2. This shows that the ABOC approach reproduce successfully the experimental
dissociation temperatures for CPH in all cases. Note that it was already the recommended approach to use in the previous study26 and here its application is extended. These superb new results solidify that activity-based occupancy correlation (ABOC) is the best method to use so far.
19
Figure 9. Experimental and predicted dissociation temperature of CPH in the presence of salts according to the ABOC approach.
Discussion on the models
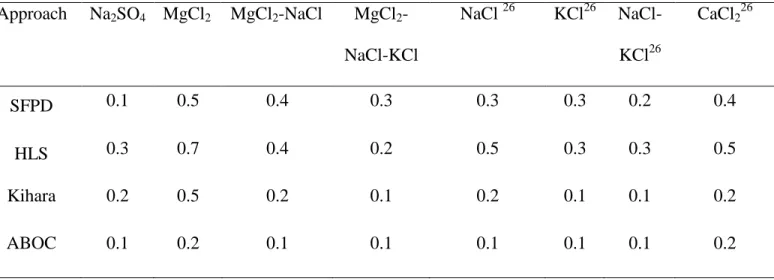
The average deviation between the present simulation and the experimental data and from Ho-Van et al.26 are listed in Table 4. Note that HLS deviations for the former systems (NaCl, KCl, or MgCl2) have been calculated and are presented in Appendix III. As highlighted in this table, all
three approaches can reproduce acceptably the CPH phase equilibrium temperature. The average deviations are reported to be less than, or equal to 0.7 °C in all brine systems.
In addition, the Kihara (except for MgCl2) and ABOC methods predict satisfactorily CPH
formation temperature. As stated by Ho-Van et al.26, the weakness of the Kihara method is that it requires Kihara potential integration. This can lead to different final values depending on the calculation code, and it is also influenced by the use of the Antoine equation for CP vapor pressure. Consequently, the ABOC approach is the strongest model to achieve rapid and consistent CPH equilibrium temperature from different brine systems.
20
Finally, HLS correlation, while being also useful and very simple to use, seems to be less versatile in terms of systems (especially MgCl2) since it is based on effective mole fraction.
However, this correlation seems promising because of the excellent results the authors obtained for gas hydrates. Maybe new developments of this correlation for heavier non-gaseous guest molecules, such as cyclopentane, are necessary to provide a more accomplished tool.
Table 4. Average deviation (in °C or K) of different approaches for predicting CPH equilibrium
temperature. Approach Na2SO4 MgCl2 MgCl2-NaCl MgCl2 -NaCl-KCl NaCl 26 KCl26 NaCl-KCl26 CaCl226 SFPD 0.1 0.5 0.4 0.3 0.3 0.3 0.2 0.4 HLS 0.3 0.7 0.4 0.2 0.5 0.3 0.3 0.5 Kihara 0.2 0.5 0.2 0.1 0.2 0.1 0.1 0.2 ABOC 0.1 0.2 0.1 0.1 0.1 0.1 0.1 0.2
Conclusion
The dissociation temperature of CPH in four different brine systems Na2SO4, MgCl2, MgCl2
-NaCl, or MgCl2-NaCl-KCl were determined experimentally following two different procedures:
quick and slow. First essential approximations on CPH phase equilibrium data were obtained by the quick procedure, then more trustworthy and consistent measurements were provided by the slow dissociation. A temperature gap between the dissociation temperatures following two procedures was observed. Because the quick procedure is likely to misjudge the correct value, its recorded measurements were hence slightly higher than the right dissociation point in all brine systems tested.
Results also point to that the CPH dissociation temperature decreased considerably with increasing in brine concentration due to two well-known phenomena: clustering and salting-out. In addition, differing brine systems show dissimilar effects on the dissociation temperature: Na2SO4 exhibits the smallest effect at concentration from 1% to 5% mass whilst MgCl2 displays
21
the great impact on the equilibria at concentration above 8%. Furthermore, the equilibrium temperatures in the brine system of MgCl2-NaCl are reported to be lower than those in the brine
system of MgCl2-NaCl-KCl at any salt concentration. This means the effect of NaCl on phase
equilibria is stronger than KCl. In addition, the eutectic point of the four-phase system Na2SO4 +
H2O, Na2SO4.10H2O, CP, and CPH was also recorded at 6% mass Na2SO4 at 5.3°C.
Lastly, four thermodynamic approaches were employed, including the novel HLS correlation from Hu et al.42,43 to predict CPH dissociation temperatures. Simulated results show that all four approaches reproduced adequately the CPH dissociation temperature with an average deviation less than 0.7 °C. However, the activity-based occupancy correlation (ABOC) method is overall better. This is the recommended method to achieve rapid and reliable equilibrium temperatures of CPH in different brine systems, with a deviation less than 0.2°C.
Notation
a water activity [–] or Kihara parameter, spherical nucleus radius [m], coefficients [–] for the correlation of the change of molar specific heat
b coefficient linear temperature dependency of the heat capacity [J mol−1 K−2], and coefficients [–] for the correlation of the change of molar specific heat
C fitted coefficient in the HLS approach H molar enthalpy [J mol−1]
m coefficient of the correlation of the cage occupancy N number of points of a given set of data
n mole number, coefficient of the correlation of the cage occupancy P pressure [Pa]
p coefficient of the correlation of the cage occupancy R universal gas constant [8.314472 m2 kg s−2 K−1 mol−1], T temperature [K]
x mole fraction
X effective mole fraction z ion charge number
Greek letters
ε Kihara parameter, maximum attraction potential [−] µ Chemical potential [J mol−1]
22
υ number of cavities per molecules of water [−] θ occupation rate of cavity/gas
σ Kihara parameter, distance between the molecules and the cavity wall, at null potential [m]
α Hu-Lee-Sum parameter accounts for the hydrate structure difference [−] β Hu-Lee-Sum parameter represents the hydrate suppression temperature [−]
Superscripts
H hydrate phase L liquid phase
β hypothetical reference phase for the hydrate phase corresponding to empty lattice
Acknowledgements
The authors would like also to thank Christopher Yukna very much for his advice on English and proofreading.
23
APPENDIX I. Molality, effective mole fraction, and water activity
Table A1. Molality, effective mole fraction (X), and water activity (calculated by using PHREEQC46at the CPH dissociation point) of four brine solutions
Salinity in % mass Na2SO4 MgCl2 MgCl2-NaCl MgCl2-NaCl-KCl Molality X Water activity Molality X Water activity Molality X Water activity Molality X Water activity 0 0.000 0.000 1.000 0.000 0.000 1.000 0.000 0.000 1.000 0.000 0.000 1.000 1 0.071 0.005 0.997 0.106 0.008 0.995 0.140 0.007 0.995 0.138 0.006 0.995 2 0.144 0.010 0.994 0.214 0.015 0.990 0.282 0.014 0.989 0.279 0.013 0.990 3.5 0.255 0.018 0.990 0.381 0.027 0.981 0.501 0.025 0.980 0.496 0.022 0.982 5 0.371 0.027 0.986 0.553 0.039 0.971 0.727 0.036 0.971 0.720 0.032 0.973 6 0.449 0.032 0.984 - - - - 8 - - 0.913 0.065 0.947 1.201 0.058 0.949 1.190 0.053 0.955 10 - - 1.167 0.082 0.926 1.535 0.074 0.932 1.520 0.067 0.941 12 - - 1.432 0.101 0.902 1.884 0.090 0.913 1.865 0.082 0.926 14 - - 1.710 0.119 0.872 2.249 0.107 0.892 2.227 0.097 0.909 16 - - 2.001 0.139 0.838 2.631 0.125 0.867 2.606 0.113 0.890 18 - - 2.306 0.159 0.798 3.032 0.143 0.839 3.003 0.129 0.870 20 - - 2.626 0.181 0.751 3.453 0.161 0.808 3.420 0.146 0.847 22 - - - 3.896 0.181 0.773 3.858 0.163 0.822
APPENDIX II. Use of HLS correlation with Hu et al. coefficients
First thing we did when utilizing HLS correlation was to use Hu et al. parameter.42 Since cyclopentane is the guest, and not methane or other light hydrocarbon, and since CPH form structure II, the second work from Hu et al.43 was considered. In this effort, SII hydrate suppression temperature is written:
(𝑇∆T 0𝑇)𝐼𝐼 = 𝛼 ( ∆T 𝑇0𝑇)𝐼 = 𝛼(𝐶1𝑋 + 𝐶2𝑋 2+ 𝐶 3𝑋3) (13)
And the hydrate dissociation temperature can be calculated from: 𝑇 = 𝑇0[1 + 𝛼 (𝑇∆T
0𝑇)𝐼𝑇0] −1
24
Coefficient α can be estimated from the ratio 𝛽2/𝛽1:
(∆T 𝑇0𝑇)𝐼𝐼 (∆T 𝑇0𝑇)𝐼 =𝑅𝑙𝑛(𝑎𝑤)( 𝑛 ∆𝐻𝑑𝑖𝑠𝑠)𝐼𝐼 𝑅𝑙𝑛(𝑎𝑤)(∆𝐻𝑑𝑖𝑠𝑠𝑛 ) 𝐼 = 𝛽2 𝛽1 = 𝛼 (15)
This ration accounts for the hydrate structure difference. Two methods are suggested by Hu et
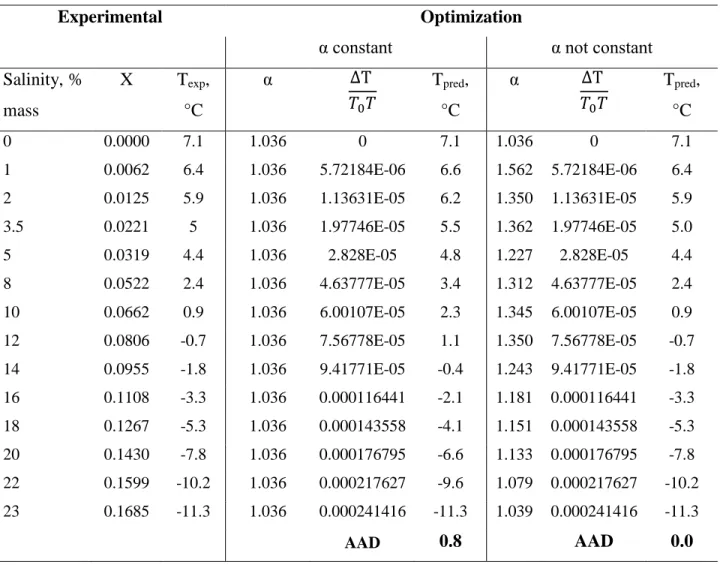
al.43 to calculate α: optimization from experimental data, or evaluation of hydrate dissociation heat and hydration number for direct calculation. We first tried to optimize α as a constant using equilibrium data in {water+NaCl} solutions, using C1, C2 and C3 parameters from Hu et al.42 In
our opinion, results were not satisfactory (AAD = 0.8, see Table A2).
Then, we optimized α for each equilibrium point, trying to find a correlation under the form 𝛼 = 𝛼(𝑋). Table A2 presents the results for water + NaCl system. Obviously, since α was adjusted for each point, the new predictions fit perfectly the experimental data (AAD=0). However, our intention was to find an appropriate correlation for α, under the form 𝛼 = 𝛼(𝑋). Unfortunately, the correlation 𝛼(𝑋) remains under a complicated form, as shown in Figure A2. This is why we chose to optimize C1, C2, C3 coefficients in our work.
25
Table A2. Optimization with α constant and not constant
Experimental Optimization
α constant α not constant Salinity, % mass X Texp, °C α ∆T 𝑇0𝑇 Tpred, °C α ∆T 𝑇0𝑇 Tpred, °C 0 0.0000 7.1 1.036 0 7.1 1.036 0 7.1 1 0.0062 6.4 1.036 5.72184E-06 6.6 1.562 5.72184E-06 6.4 2 0.0125 5.9 1.036 1.13631E-05 6.2 1.350 1.13631E-05 5.9 3.5 0.0221 5 1.036 1.97746E-05 5.5 1.362 1.97746E-05 5.0 5 0.0319 4.4 1.036 2.828E-05 4.8 1.227 2.828E-05 4.4 8 0.0522 2.4 1.036 4.63777E-05 3.4 1.312 4.63777E-05 2.4 10 0.0662 0.9 1.036 6.00107E-05 2.3 1.345 6.00107E-05 0.9 12 0.0806 -0.7 1.036 7.56778E-05 1.1 1.350 7.56778E-05 -0.7 14 0.0955 -1.8 1.036 9.41771E-05 -0.4 1.243 9.41771E-05 -1.8 16 0.1108 -3.3 1.036 0.000116441 -2.1 1.181 0.000116441 -3.3 18 0.1267 -5.3 1.036 0.000143558 -4.1 1.151 0.000143558 -5.3 20 0.1430 -7.8 1.036 0.000176795 -6.6 1.133 0.000176795 -7.8 22 0.1599 -10.2 1.036 0.000217627 -9.6 1.079 0.000217627 -10.2 23 0.1685 -11.3 1.036 0.000241416 -11.3 1.039 0.000241416 -11.3 AAD 0.8 AAD 0.0
26
APPENDIX III. HLS approach compared to former system26
Predicted results present a higher AAD than ABOC method. However, to fit C1, C2 and C3
parameters, data from {water + MgCl2} solutions were also considered. Since there is a deviation
from the standard behavior ( 𝑇∆T
0𝑇= 𝑓(𝑋) ), it is probable that the use of such data lead to worse simulation results for NaCl, KCl, or CaCl2 salts.
Figure A3. Experimental and predicted dissociation temperature of CPH in the presence of salts according to HLS approach for the four brine solutions from Ho-Van et al26
Literature Cited
(1) Sloan ED, Koh CA. Clathrate Hydrate of Natural Gases. 3rd ed. CRC Press, FL: Boca Raton, 2008.
(2) Babu P, Linga P, Kumar R, Englezos P. A review of the hydrate based gas separation (HBGS) process forcarbon dioxide pre-combustion capture. Energy. 2015;85:261-279. doi:10.1016/j.energy.2015.03.103.
27
carbon dioxide capture employing an unstirred reactor with cyclopentane. Energy. 2013;63:252-259. doi:10.1016/j.energy.2013.10.031.
(4) Burnol A, Thinon I, Ruffine L, Herri JM. Influence of impurities (nitrogen and methane) on the CO2 storage capacity as sediment-hosted gas hydrates - Application in the area of the Celtic Sea and the Bay of Biscay. Int J Greenh Gas Control. 2015;35:96-109.
doi:10.1016/j.ijggc.2015.01.018.
(5) Taheri Z, Shabani MR, Nazari K, Mehdizaheh A. Natural gas transportation and storage by hydrate technology: Iran case study. J Nat Gas Sci Eng. 2014;21:846-849.
doi:10.1016/j.jngse.2014.09.026.
(6) Douzet J, Kwaterski M, Lallemand A, Chauvy F, Flick D, Herri JM. Prototyping of a real size air-conditioning system using a tetra-n-butylammonium bromide semiclathrate hydrate slurry as secondary two-phase refrigerant - Experimental investigations and modelling. Int J Refrig. 2013;36(6):1616-1631. doi:10.1016/j.ijrefrig.2013.04.015. (7) Darbouret M, Cournil M, Herri JM. Rheological study of TBAB hydrate slurries as
secondary two-phase refrigerants. Int J Refrig. 2005;28(5):663-671. doi:10.1016/j.ijrefrig.2005.01.002.
(8) Ogoshi H, Takao S. Air-Conditioning System Using Clathrate Hydrate Slurry. JFE Tech
Rep. 2004;3(3):1-5.
(9) Duc NH, Chauvy F, Herri JM. CO2 capture by hydrate crystallization - A potential solution for gas emission of steelmaking industry. Energy Convers Manag.
2007;48(4):1313-1322. doi:10.1016/j.enconman.2006.09.024.
(10) Li S, Fan S, Wang J, Lang X, Wang Y. Clathrate hydrate capture of CO2 from simulated flue gas with cyclopentane/water emulsion. Chinese J Chem Eng. 2010;18(2):202-206. doi:10.1016/S1004-9541(08)60343-2.
(11) Englezos P. Clathrate Hydrates. Ind Eng Chem Res. 1993;32:1251-1274. doi:10.1021/ie00019a001.
(12) Javanmardi J, Moshfeghian M. Energy consumption and economic evaluation of water desalination by hydrate phenomenon. Appl Therm Eng. 2003;23(7):845-857.
doi:10.1016/S1359-4311(03)00023-1.
(13) Park K nam, Hong SY, Lee JW, et al. A new apparatus for seawater desalination by gas hydrate process and removal characteristics of dissolved minerals (Na+, Mg2+, Ca2+, K+, B3+). Desalination. 2011;274(1-3):91-96. doi:10.1016/j.desal.2011.01.084.
28
(14) Lee H, Ryu H, Lim J-H, Kim J-O, Dong Lee J, Kim S. An optimal design approach of gas hydrate and reverse osmosis hybrid system for seawater desalination. Desalin Water Treat. 2016;57(19):9009-9017. doi:10.1080/19443994.2015.1049405.
(15) He T, Nair SK, Babu P, Linga P, Karimi IA. A novel conceptual design of hydrate based desalination (HyDesal) process by utilizing LNG cold energy. Appl Energy.
2018;222(March):13-24. doi:10.1016/j.apenergy.2018.04.006.
(16) Babu P, Nambiar A, He T. A Review of Clathrate Hydrate Based Desalination to Strengthen Energy-Water Nexus. ACS Sustain Chem Eng. 2018.
doi:10.1021/acssuschemeng.8b01616.
(17) Xu H, Khan MN, Peters CJ, Sloan ED, Koh CA. Hydrate-Based Desalination Using Cyclopentane Hydrates at Atmospheric Pressure. J Chem Eng Data.
2018:acs.jced.7b00815. doi:10.1021/acs.jced.7b00815.
(18) Subramani A, Jacangelo JG. Emerging desalination technologies for water treatment: A critical review. Water Res. 2015;75:164-187. doi:10.1016/j.watres.2015.02.032.
(19) Colten SL, Lin FS, Tsao TC, Stern SA, Barduhn AJ. Hydrolysis losses in the hydrate desalination process: rate measurements and economic analysis. Desalination. 1972;11(1):31-59. doi:10.1016/S0011-9164(00)84047-3.
(20) Sugi J, Saito S. Concentration and demineralization of sea water by the hydrate process.
Desalination. 1967;3(1):27-31. doi:10.1016/S0011-9164(00)84021-7.
(21) R.A. McCormack, N.G. A. Build and operate clathrate desalination pilot plant, U.S. Dept. of the Interior, Bureau of Reclamation, 1998.
(22) R.A. McCormack, R.K. Andersen, Clathrate desalination plant preliminary research study, U.S. Dept. of the Interior, Bureau of Reclamation, 1995.
(23) R.W. Bradshaw, D.E. Dedrick, B.A. Simmons, J.A. Great- house, R.T. Cygan, E.H. Majzoub, Desalination Utilizing Clathrate Hydrates, Sandia National Laboratories, California, 2008.
(24) M.D. Max, Hydrate desalination for water purification, US 6991722 B2, 2006.
(25) Englezos P. The Freeze Concentration Process and its Applications. Dev Chem Eng Miner
Process. 1994;2(1):3-15. doi:10.1002/apj.5500020102.
(26) Ho-Van S, Bouillot B, Douzet J, Maghsoodloo S, Herri J-M. Experimental Measurement and Thermodynamic Modeling of Cyclopentane Hydrates with NaCl, KCl, CaCl2 or NaCl-KCl Present. Am Inst Chem Eng J. 2017. doi:10.1002/aic.16067.
29
(27) Corak D, Barth T, Høiland S, Skodvin T, Larsen R, Skjetne T. Effect of subcooling and amount of hydrate former on formation of cyclopentane hydrates in brine. Desalination. 2011;278(1-3):268-274. doi:10.1016/j.desal.2011.05.035.
(28) Han S, Shin JY, Rhee YW, Kang SP. Enhanced efficiency of salt removal from brine for cyclopentane hydrates by washing, centrifuging, and sweating. Desalination. 2014;354:17-22. doi:10.1016/j.desal.2014.09.023.
(29) Han S, Rhee YW, Kang SP. Investigation of salt removal using cyclopentane hydrate formation and washing treatment for seawater desalination. Desalination. 2017;404:132-137. doi:10.1016/j.desal.2016.11.016.
(30) Cai L. Desalination via formation of binary clathrate hydrates. Ph.D.Thesis, Princeton University, New Jersey, 2016.
(31) Lv Y-N, Wang S-S, Sun C-Y, Gong J, Chen G-J. Desalination by forming hydrate from brine in cyclopentane dispersion system. Desalination. 2017;413:217-222.
doi:10.1016/j.desal.2017.03.025.
(32) McAuliffe C. Solubility in Water of Paraffin, Cycloparaffin, Olefin, Acetylene,
Cycloolefin, and Aromatic Hydrocarbons1. J Phys Chem. 1966;70(4):1267-1275. doi:DOI: 10.1021/j100876a049.
(33) Dean JA. LANGE’S HANDBOOK OF CHEMISTRY. Mater Manuf Process. 1990;5(4):687-688. doi:10.1080/10426919008953291.
(34) Han H, Dong O, Li D, Zeng D. Phase diagram of the NaCl–MgCl2–H2O system at 25– 75°C and its application for MgCl2 · 6H2O purification. Russ J Phys Chem A.
2017;91(7):1255-1259. doi:10.1134/S0036024417070147.
(35) Huang Q, Lu G, Wang J, Yu J. Thermal decomposition mechanisms of MgCl2·6H2O and MgCl2·H2O. J Anal Appl Pyrolysis. 2011;91(1):159-164. doi:10.1016/j.jaap.2011.02.005. (36) Sloan D, Koh CA, Sum AK. Natural Gas Hydrate in Flow Assurance. Gulf Professional
Pub./Elsevier; 2011.
(37) Sabil KM, Román VR, Witkamp GJ, Peters CJ. Experimental observations on the competing effect of tetrahydrofuran and an electrolyte and the strength of hydrate inhibition among metal halides in mixed CO2 hydrate equilibria. J Chem Thermodyn.
2010;42(3):400-408. doi:10.1016/j.jct.2009.09.012.
(38) Cha M, Hu Y, Sum AK. Methane hydrate phase equilibria for systems containing NaCl, KCl, and NH4Cl. Fluid Phase Equilib. 2016;413:2-9. doi:10.1016/j.fluid.2015.08.010.
30
(39) Wells RC. Sodium sunphate: its sources and uses. United States Geol Surv. 1923. (40) Hildebrand JH, Scott RL. Regular Solutions. Prentice-Hall, NJ: Englewood Cliffs, 1962 (41) Miyawaki O, Saito A, Matsuo T, Nakamura K. Activity and activity coefficient of water in
aqueous solutions and their relationships with solution structure parameters. Biosci
Biotechnol Biochem. 1997;61(3):466-469. doi:10.1271/bbb.61.466.
(42) Hu Y, Lee BR, Sum AK. Universal correlation for gas hydrates suppression temperature of inhibited systems: I. Single salts. AIChE J. July 2017. doi:10.1002/aic.15846.
(43) Hu Y, Lee BR, Sum AK. Universal correlation for gas hydrates suppression temperature of inhibited systems: II. Mixed salts and structure type. AIChE J. 2018;64(6):2240-2250. doi:10.1002/aic.16116.
(44) van der Waals JH, Platteeuw JC. Clathrate solutions. Adv Chem Phys. 1958;2:1-57. doi:10.1002/9780470143483.ch1.
(45) Nakajima M, Ohinura R, Mori YH. Clathrate hydrate formation from cyclopentane-in-water emulsions. Ind Eng Chem Res. 2008;47(22):8933-8939. doi:10.1021/ie800949k. (46) Parkhurst, D.L., Appelo, C.A.J., 1999. User’s guide to PHREEQC (version 2) – a
computer program for speciation, batchreaction, one-dimensional transport, and inverse geochemical calculations, Water-Resour. Invest. Rep. 99-4259. US Geol. Surv. Denver, Colorado.
(47) A. Pieroen. Gas hydrates - approximate relations betvveen heat. Recl des Trav Chim des
Pays-Bas. 1955;74:995-1002.
(48) Herri J-M, Bouchemoua A, Kwaterski M, Fezoua A, Ouabbas Y, Cameirao A. Gas hydrate equilibria for CO2–N2 and CO2–CH4 gas mixtures—Experimental studies and
thermodynamic modelling. Fluid Phase Equilib. 2011;301(2):171-190. doi:10.1016/j.fluid.2010.09.041.
(49) Parrishl WR, John M. Dissociation Pressures of Gas Hydrates Formed by Gas Mixtures.
31 For Table of Contents Use Only