En vue de l'obtention du
DOCTORAT DE L'UNIVERSITÉ DE TOULOUSE
Délivré par :Institut National Polytechnique de Toulouse (INP Toulouse)
Discipline ou spécialité :
Dynamique des fluides
Présentée et soutenue par :
Mme MYRIAM PEYROUNETTE le mercredi 25 octobre 2017
Titre :
Unité de recherche : Ecole doctorale :
Towards brain-scale modelling of the human cerebral blood flow: hybrid
approach and high performance computing
Mécanique, Energétique, Génie civil, Procédés (MEGeP) Institut de Mécanique des Fluides de Toulouse (I.M.F.T.)
Directeur(s) de Thèse :
MME SYLVIE LORTHOIS M. YOHAN DAVIT
Rapporteurs :
M. BENOÎT NOETINGER, IFPEN
M. PIERRE-YVES LAGREE, UNIVERSITE PIERRE ET MARIE CURIE
Membre(s) du jury :
Mme STEPHANIE PITRE-CHAMPAGNAT, UNIVERSITE PARIS 11, Président M. MICHEL QUINTARD, INP TOULOUSE, Membre
vii ix xi xv
Contents
Abstract Résumé Remerciements Nomenclature 1 Introduction 191.1 Why is the brain microcirculation important? . . . . 19
1.2 The cerebral vasculature: a multiscale architecture . . . . 20
1.2.1 The brain macrocirculation . . . . 20
1.2.2 The brain microcirculation . . . . 22
1.2.3 Scales terminology . . . . 22
1.3 Limitations of the existing investigation tools . . . . 23
1.3.1 Investigation tools in “relatively small” volumes . . . . 24
1.3.2 With a view to brain-scale investigation . . . . 25
1.4 Objective of the present work . . . . 27
1.5 Strategy adopted . . . . 29
1.5.1 For the simulation of blood flow at mesoscopic scale . . . 29
1.5.2 For the simulation of blood flow in the whole human brain . . . 32
2 Current approaches for modelling blood flow and mass transfers in human brain microcirculation 35 2.1 Microvascular architecture and blood rheology . . . . 35
2.1.1 Anatomical material and investigation of the microvascular architecture . . . . 35
2.1.2 Blood rheology in microvascular networks . . . . 38
2.2 Standard modelling of blood flow and mass transfers in the microcirculation . . . 39
2.2.1 Blood flow modelling to understand regulation mechanisms . . . 39
2.2.2 Adding mass transfers to investigate oxygen and nutrients delivery . . . . 44
2.3 Upscaling approaches . . . . 46
2.3.1 The use of a coarser network representation . . . . 47
2.3.2 Homogenization: the microvascular networks as a porous medium . . . . 48
3 Modelling groundwork for the hybrid approach 53
3.1 Main simplifications and hypotheses . . . 54
3.2 Network model for the arteriolar and venular trees . . . . 54
3.2.1 Geometry, vocabulary and conventions . . . . 54
3.2.2 Flow equations . . . . 56
3.2.3 Setting of linear system . . . . 57
3.3 Continuum approach for the capillary bed . . . . 58
3.3.1 Geometry, vocabulary and conventions . . . . 58
3.3.2 Flow equations . . . . 59
3.3.3 Numerical approach: finite volume method . . . 59
3.3.4 Setting of the linear system . . . . 64
3.3.5 Bonus: Extension of the FV scheme to non-cubic cells . . . . 65
3.4 Computation of the effective properties of the continuum . . . 65
3.5 Conclusion . . . . 67
4 Multiscale coupling condition to link arteriolar and venular trees to the contin-uum 68 4.1 Inspiration: the well model developed for petroleum engineering . . . . 69
4.1.1 The idea of Peaceman’s well model . . . . 69
4.1.2 Limits of the well model . . . . 74
4.2 Adaptation to the context of brain microcirculation . . . . 76
4.2.1 Geometry, vocabulary and conventions . . . . 76
4.2.2 Analytical approximations of the pressure field in the vicinity of a coupling point 78 4.2.3 Expression of the coupling condition . . . . 80
4.2.4 Off-centering: distribution of the coupling source term . . . 82
4.2.5 Setting of the linear system and numerical implementation . . . . 84
4.2.6 Bonus: Multiscale coupling condition adapted to non-cubic finite volume cells 87 4.2.7 Conclusion . . . . 88
5 Validation of the hybrid approach 89 5.1 How we validate the model . . . . 89
5.1.1 The complete network approach as a reference . . . . 89
5.1.2 Comparison with a simple hybrid approach . . . . 90
5.1.3 Network datasets . . . . 90
5.1.4 Error metrics for the comparison of the hybrid approach with CN simulations 97 5.1.5 Reconstruction of the pressure field in the vicinity of couplings . . . 98
5.2 Validation of the multiscale coupling model on simple test cases . . . . 99
5.2.2 Scale separation . . . 102
5.2.3 Off-centering . . . 106
5.2.4 Boundary effects . . . 106
5.2.5 Interaction between several couplings . . . 110
5.2.6 Summary . . . 112
5.3 Extension to more realistic networks . . . 114
5.3.1 Morphometrical complexification of the capillary bed . . . 114
5.3.2 Topological complexification of the capillary bed . . . 120
5.3.3 Complexification of the arterio-venular structures . . . 123
5.3.4 Summary . . . 126
5.4 Validation of the hybrid approach on realistic configuration . . . 128
5.4.1 More realistic configuration . . . 128
5.4.2 Presentation of the results . . . 129
6 Large vascular networks: a computational challenge 135 6.1 The point of having efficient programming practices . . . 135
6.2 Coding strategy . . . 137
6.2.1 Collaboration . . . 137
6.2.2 Reliability . . . 140
6.2.3 Computational performance . . . 144
6.2.4 Portability . . . 145
6.3 Parallelization of the code . . . 147
6.3.1 Generalities: Supercomputer architecture and parallel programming . . . 148
6.3.2 Parallelization of the HybridNetwork-FiniteVolume code . . . 150
6.3.3 Partitioning tools for HNFV-Code . . . 155
6.3.4 Code performance . . . 165
7 Conclusions and perspectives 173 7.1 Conclusions . . . 173
7.1.1 Challenges . . . 173
7.1.2 A new hybrid approach . . . 173
7.1.3 Accuracy and robustness of our hybrid approach . . . 174
7.1.4 Computational gain of the hybrid approach . . . 174
7.2 Perspectives: toward whole-brain simulations and extension of the hybrid approach . 176 7.2.1 Towards whole-brain simulations . . . 176
7.2.2 Extension of the hybrid approach . . . 180
8 Appendices 183
8.1 Averaging of microscopic fields to mesoscopic scale . . . 183
8.2 Two-dimensional analytical solution of Darcy’s law . . . 185
8.3 Three-dimensional analytical solution of Darcy’s law . . . 187
8.3.1 Implementation of the condition of pressure continuity at the interface between the arteriolar and venular trees, and the continuum . . . 188
8.4 6- and 3-regular networks with same vascular density . . . 191
8.5 Details about the configuration of test cases . . . 191
8.6 DMDA partitioning algorithm . . . 194
Abstract
Towards brain-scale modelling of the human cerebral blood flow:
hybrid approach and high performance computing
The brain microcirculation plays a key role in cerebral physiology and neuronal activation. In the case of degenerative diseases such as Alzheimer’s, severe deterioration of the microvascular networks (e.g. vascular occlusions) limit blood flow, thus oxygen and nutrients supply, to the cortex, eventually resulting in neurons death. In addition to functional neuroimaging, modelling is a valuable tool to investigate the impact of structural variations of the microvasculature on blood flow and mass transfers.
In the brain microcirculation, the capillary bed contains the smallest vessels (1-10 µm in diameter) and presents a mesh-like structure embedded in the cerebral tissue. This is the main place of molecular exchange between blood and neurons. The capillary bed is fed and drained by larger arteriolar and venular tree-like vessels (10-100 µm in diameter).
For the last decades, standard network approaches have significantly advanced our understanding of blood flow, mass transport and regulation mechanisms in the human brain microcirculation. By averaging flow equations over the vascular cross-sections, such approaches yield a one-dimensional model that involves much fewer variables compared to a full three-dimensional resolution of the flow. However, because of the high density of capillaries, such approaches are still computationally
limited to relatively small volumes (<100 mm3). This constraint prevents applications at clinically
relevant scales, since standard imaging techniques only yield much larger volumes (∼100 cm3), with
a resolution of 1-10 mm3.
To get around this computational cost, we present a hybrid approach for blood flow modelling where the capillaries are replaced by a continuous medium. This substitution makes sense since the capillary bed is dense and space-filling over a cut-off length of ∼50 µm. In this continuum, blood flow is characterized by effective properties (e.g. permeability) at the scale of a much larger representative volume. Furthermore, the domain is discretized on a coarse grid using the finite volume method, inducing an important computational gain. The arteriolar and venular trees cannot be homogenized because of their quasi-fractal structure, thus the network approach is used to model blood flow in the larger vessels.
The main difficulty of the hybrid approach is to develop a proper coupling model at the points where arteriolar or venular vessels are connected to the continuum. Indeed, high pressure gradients build up at capillary-scale in the vicinity of the coupling points, and must be properly described at the continuum-scale. Such multiscale coupling has never been discussed in the context of brain micro-circulation. Taking inspiration from the Peaceman “well model” developed for petroleum engineering, our coupling model relies on to use analytical solutions of the pressure field in the neighbourhood
of the coupling points. The resulting equations yield a single linear system to solve for both the network part and the continuum (strong coupling).
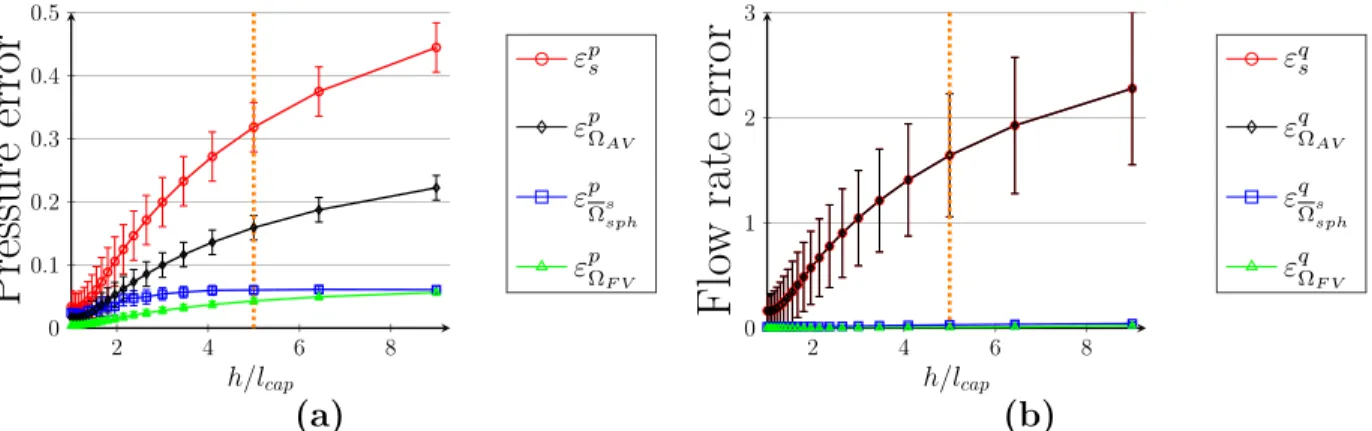
The accuracy of the hybrid model is evaluated by comparison with a classical network approach, for both very simple synthetic architectures involving no more than two couplings, and more complex ones, with anatomical arteriolar and venular trees displaying a large number of couplings. We show that the present approach is very accurate, since relative pressure errors are lower than 6 %. This lays the goundwork for introducing additional levels of complexity in the future (e.g. non uniform hematocrit).
In the perspective of large-scale simulations and extension to mass transport, the hybrid approach has been implemented in a C++ code designed for High Performance Computing. It has been fully parallelized using Message Passing Interface standards and specialized libraries (e.g. PETSc). Since the present work is part of a larger project involving several collaborators, special care has been taken in developing efficient coding strategies.
Résumé
Vers une modélisation de l’écoulement sanguin cérébral humain
à l’échelle du cerveau : approche hybride et calcul haute performance
La microcirculation cérébrale joue un rôle clé dans la physiologie cérébrale. Lors de maladies dégénératives comme celle d’Alzheimer, la détérioration des réseaux microvasculaires (e.g. occlu-sions et baisse de densité vasculaires) limite l’afflux sanguin vers le cortex. La réduction associée de l’apport en oxygène et nutriments risque de provoquer la mort de neurones. En complément des tech-niques d’imagerie médicale, la modélisation est un outil précieux pour comprendre l’impact de telles variations structurelles sur l’écoulement sanguin et les transferts de masse. Dans la microcirculation cérébrale, le lit capillaire contient les plus petits vaisseaux (diamètre de 1-10 µm) et présente une structure maillée, au sein du tissu cérébral. C’est le lieu principal des échanges moléculaires entre le sang et les neurones. Le lit capillaire est alimenté et drainé par les arbres artériolaires et veinulaires (diamètre de 10-100 µm). Depuis quelques décennies, les approches “réseau” ont significativement amélioré notre compréhension de l’écoulement sanguin, du transport de masse et des mécanismes de régulation dans la microcirculation cérébrale humaine. Cependant, d’un point de vue numérique, la
densité des capillaires limite ces approches à des volumes relativement petits (<100 mm3). Cette
contrainte empêche leur application à des échelles cliniques, puisque les techniques d’imagerie
médi-cale permettent d’acquérir des volumes bien plus importants (∼100 cm3), avec une résolution de
1-10 mm. Pour réduire ce coût numérique, nous présentons une approche hybride pour la mod-élisation de l’écoulement dans laquelle les capillaires sont remplacés par un milieu continu. Cette substitution a du sens puisque le lit capillaire est dense et homogène à partir d’une longueur de coupure de ∼50 µm. Dans ce continuum, l’écoulement est caractérisé par des propriétés effectives (e.g. perméabilité) à l’échelle d’un volume représentatif plus grand. De plus, le continuum est dis-crétisé par la méthode des volumes finis sur un maillage grossier, ce qui induit un gain numérique important. Les arbres artério- et veinulaires ne peuvent être homogénéisés à cause de leur structure quasi-fractale. Nous appliquons donc une approche “réseau” standard dans les vaisseaux les plus larges. La principale difficulté de l’approche hybride est de développer un modèle de couplage aux points où les vaisseaux artério- et veinulaires sont connectés au continuum. En effet, de forts gra-dients de pression apparaissent à proximité de ces points, et doivent être homogénéisés proprement à l’échelle du continuum. Ce genre de couplage multi-échelle n’a jamais été introduit dans le con-texte de la microcirculation cérébrale. Nous nous inspirons ici du "modèle de puits" développé par Peaceman pour l’ingénierie pétrolière, en utilisant des solutions analytiques du champ des pressions dans le voisinage des points de couplage. Les équations obtenues forment un unique système linéaire à résoudre pour l’ensemble du domaine d’étude. Nous validons l’approche hybride par comparaison avec une approche “réseau” classique, pour des architectures synthétiques simples qui n’impliquent qu’un ou deux couplages, et pour des structures plus complexes qui impliquent des arbres artério- et
veinulaires anatomiques avec un grand nombre de couplages. Nous montrons que cette approche est fiable, puisque les erreurs relatives en pression sont faibles (<6 %). Cela ouvre la voie à une complex-ification du modèle (e.g. hématocrite non uniforme). Dans une perspective de simulations à grande échelle et d’extension au transport de masse, l’approche hybride a été implémentée dans un code C++ conçu pour le calcul haute performance. Ce code a été entièrement parallélisé en utilisant les standards MPI et des librairies spécialisées (e.g. PETSc). Ce travail faisant partie d’un projet plus large impliquant plusieurs collaborateurs, une attention particulière a été portée à l’établissement de stratégies d’implémentation efficaces.
Remerciements
Les travaux de thèse présentés dans ce manuscrit ont été réalisés au sein du Groupe d’Étude des Milieux Poreux (GEMP) de l’Institut de Mécanique des Fluides de Toulouse (IMFT). Ils ont été financés par une allocation de recherche de l’Institut National Polytechnique de Toulouse (INPT) et par l’ERC Consolidator BrainMicroFlow (GA615102). C’est donc tout naturellement que je tiens à remercier ces différentes institutions, sans lesquelles ce projet de recherche n’aurait pu être mené.
Mercis élémentaires représentatifs
J’amorce la déferlante de remerciements en exprimant ma plus profonde gratitude envers ma directrice de thèse, Sylvie Lorthois. Merci de m’avoir ouvert les portes du monde de la recherche et de m’y avoir tout appris. Merci de l’avoir fait avec tant d’humanité et de justesse. Merci de m’avoir fait confiance et d’avoir supporter mes peyrounetteries en tout genre. J’admire la manière que tu as de te dévouer à ce qui te tient à coeur et je suis fière d’avoir pu participer à l’aventure BrainMicroFlow, ce beau projet, à la belle ambition, que tu portes avec brio.
Aux côtés de Sylvie, adjoint précieux, je tiens à remercier Yohan Davit. Ta curiosité et ton ent-housiasme communicatifs m’ont toujours (re)motivée. J’ai beaucoup apprécié toutes les discussions scientifiques (ou non) que l’on a pu avoir. Tu as de plus su porter sans anicroche la double casquette de directeur de thèse et de camarade, aux côtés des autres doctorants et post-doctorants du groupe GEMP. Je te souhaite de belles années de recherche !
J’aimerais ensuite remercier les deux rapporteurs de ma thèse, Pierre-Yves Lagrée et Benoît Noetinger, qui ont pris le temps de lire avec soin ce manuscrit. Vos retours ont été précieux. Merci également aux autres membres de mon jury, Stéphanie Pitre-Champagnat, Patrick Jenny et Michel Quintard. Merci pour l’intérêt que vous avez porté à ces travaux et pour vos questionnements constructifs.
Un merci particulier à Michel, qui a suivi mes travaux de thèse depuis le début. Merci de m’avoir guidée à la fois dans mes intégrations volumes finis, et dans des dédales spéléologiques inconnus.
Remerciements multi-échelle
À l’échelle internationale, j’aimerais remercier Chris Schaffer et Nozomi Nishimura, qui m’ont ac-cueillie pendant un mois dans leur laboratoire, à la Cornell University. J’y ai beaucoup appris sur la recherche "à l’américaine" et ai pris beaucoup de plaisir à visiter les environs.
À l’échelle de la région, je tiens à remercier le mésocentre CALMIP, pour avoir mis à disposition leur puissance de calcul, mais également un support technique et pédagogique efficace. Je pense notamment aux nombreux messages échangés avec Pierrette Barbaresco lors de ma découverte du supercalculateur EOS.
À l’échelle de l’IMFT, je tiens à remercier le service COSINUS, pour m’avoir conseillée et aidée dans le développement de mon code de simulation. Je pense en particulier à Annaig Pedrono, Kevin Larnier et Pierre Elyakime. Merci d’avoir recompilé PETSc moultes fois sans broncher et de m’avoir guidée dans mes choix de programmation.
Je souhaite également saluer les différents permanents avec qui j’ai eu le plaisir d’enseigner, animer ou seulement discuter. Gérald Debenest, Rachid Ababou, Ludovic Cassan, Rémi Zamansky, Thomas Bonometti, Dominique Anne-Archard, Pauline Assémat, Pascal Swider. Merci d’avoir fait de mon passage à l’IMFT une expérience riche et variée.
Hors cadre scientifique, j’ai une pensée particulière pour Sandrine Chupin. J’ai beaucoup ap-précié nos discussions et nos moments de partage. Je souhaite également ne pas remercier Ruddy Soeparno, pour toutes nos conversations inutiles et le temps perdu qu’implique systématiquement le fait de te croiser dans les couloirs. Et j’aimerais saluer affectueusement André Rouch, que j’avais toujours plaisir à croiser en arrivant ou partant du labo. Un sourire ou quelques mots échangés avec chacun d’entre vous étaient un petit rayon de soleil dans la journée.
À l’échelle du groupe GEMP, je tiens à remercier Suzy Bernard, notre gestionnaire de groupe, pour son professionalisme et son agréabilité à toute épreuve. Grâce à toi, l’aventure administrative devient beaucoup plus facile.
Et évidemment, je tiens à remercier les copains : Sylvain, Frédéric, Martin, Ange, Jacques, Hamza, re-Yohan, re-Pauline, Pierre, Tawfik, Baptiste, Yara, Romain, Amy, Adlan, Maxime, Edith, Vincent, Mauricio, Benjamin, Laetitia, Lingguo, Jianwei, Maha, Antoine,... Je garderai de très bons souvenirs de nos parties endiablées de tarot, des quelques soirées et repas partagés, ainsi que du mariage de Fred et Camille ! Merci à tous pour avoir instauré une ambiance de travail fort sympathique.
MerC++
Je profite encore un peu de ces pages pour souligner le plaisir que j’ai eu à travailler avec toute la clique BrainMicroFlow : Adlan ("y a Faustine à la fenêtre !"), Maxime (*check*), Amy ("that come into play!") et Vincent ("là je mets plutôt un pointeur ou une référence ? Hum... bon, je vais voir Vincent."). Vous avez été un réél appui, scientifique et amical. Je pense simplement à votre
gentillesse et votre générosité, auxquelles j’ai été très sensible. Vous allez me BrainMicroFlower1.
Prenez BrainMicroFlow2 des petits BrainMicroFlows3, Florian et Arthur.
Et dans un coin du bureau, il y avait aussi Edith, qui est devenue bien plus qu’une co-bureau avec le temps. Merci Edith pour ton soutien, tes conseils, toutes nos discussions, les courbatures à cause du bloc,... et surtout nos séances musicales ! J’ai énormément apprécié toutes ces occasions de partager avec toi.
1 manquer 2 soin 3 derniers
Puis s’il y a une autre personne qui mérite bien son paragraphe personnel de remerciements, c’est... Laetitia !! Merci d’avoir été présente à des moments délicats de ma thèse-vie, merci pour les bières, les clopes, les coinches, les balades, les heures de blablas,... Merci pour ta franchise et ta générosité, merci pour tes encouragements, merci d’être venue à ma soutenance,... Merci pour pas mal de choses en fait ! Je vais m’en tenir là. À très bientôt, pour de nouvelles aventures !
Effets de bord
Je souhaite en fin prendre le temps de remercier ma famille. Tout spécialement mes parents, qui ont rendu possibles toutes ces années d’étude et qui m’ont laissée être curieuse, essayer, changer d’avis, choisir. Je vous dois beaucoup. Merci aussi aux sœurs, Sandra et Rachel, pour leur soutien indéfectible, et au petit frère, Thomas. Merci d’avoir été présent ces derniers temps, pour t’occuper de moi et me changer les idées.
Aussi, je glisse un merci à Benjamin. Pour le support technico-logistico-psycholigico-affectif, pour le canard à l’orange, et surtout pour ta présence qui a le don de m’apaiser. Tout est important, mais rien n’est grave !
Nomenclature
Abbreviations
FV . . . : Finite Volume
REV . . . : Representative Elementary Volume
CN . . . : Complete Network
SH . . . : Simple Hybrid
HbFi . . . : Hemodynamically-based Functioning imaging
Pi . . . : Perfusion imaging
VR . . . : Virshow-Robin
HNFV-Code : HybridNetworkFiniteVolume-Code
CPU . . . : Central Processing Unit
GPU . . . : Graphics Processing Unit
MPI . . . : Message Passing Interface
DMDA . . . : Distributed Arrays
Notations
Network
lcap. . . : the typical length of a capillary (m)
dcap. . . : the typical diameter of a capillary (m)
α, β, etc . . : a network vertex
[αβ] . . . : the vessel defined by the vertices α and β
Nα . . . : the set of neighbouring vertices of the vertex α
Nα,in. . . : the set of inner neighbouring vertices of the vertex α
dαβ . . . : the diameter of the vessel [αβ] (m)
lαβ . . . : the length of the vessel [αβ] (m)
Gαβ . . . : the conductance of the vessel [αβ] (kg−1· m4· s)
µappαβ . . . : the apparent viscosity of blood in the vessel [αβ] (kg · m−1· s−1)
Hαβ . . . : the hematocrit of the vessel [αβ]
πα. . . : the pressure defined at the vertex α (kg · m−1· s−2)
qαβ . . . : the flow rate defined in the vessel [αβ] (m3· s−1)
πΓ. . . : the weighted average pressure in the capillaries connected to a coupling point
empty (kg · m−1· s−2)
lΓ. . . : the weighted average length of the capillaries connected to a coupling point (m)
RΓ. . . : the harmonic average resistance of the capillaries connected to a coupling point
πCN. . . : a network pressure obtained by complete network simulations (kg · m−1· s−2)
πH. . . : a network pressure obtained by hybrid simulations (kg · m−1· s−2)
qCN. . . : a network flow rate obtained by complete network simulations (m3· s−1)
qH. . . : a network flow rate obtained by hybrid simulations (m3· s−1)
Continuum
h . . . : the side of a discretization cell (m)
i, j, etc . . . : a discretization cell
[ij] . . . : the surface between two discretization cells i and j
Ni. . . : the set of neighbouring cells of the cell i
Ni. . . : the set of neighbouring cells of the cell i + the cells sharing a corner with i
Keff. . . : the effective permeability (m2)
Kref . . . . : a reference effective permeability (m2)
µeff . . . . : the effective viscosity of blood (kg · m−1· s−1)
µref. . . . : a reference effective viscosity of blood (kg · m−1· s−1)
U . . . : the Darcy velocity (m · s−1)
P . . . : the pressure of the continuum (kg · m−1· s−2)
Q . . . : the flow rate of the continuum (m3· s−1)
Pi . . . : the pressure of the cell i (kg · m−1· s−2)
Qij . . . : the flow rate at the interface between the two cells i and j (m3· s−1)
Coupling
s . . . : a coupling point
S . . . : the set of coupling points
doff. . . : the distance between the coupling point and the center of the coupled FV cell (m)
dAV. . . : the distance between two arteriolar and venular coupling points (m)
dboundary. . : the distance between a coupling point and the domain boundary (m)
dk,s. . . : the distance between the coupling point s and the center of the FV cell k (m)
πs . . . : the pressure defined at the coupling point s (kg · m−1· s−2)
qs. . . : the flow rate source term defined at the coupling point s (m3· s−1)
qs,i. . . : a fraction of the source term qs assigned to the FV cell i (m3· s−1)
τi. . . : a partition coefficient to assign a partial source term qs,i to the FV cell i
f . . . : the linear coupling expression
Domains
ΩAV . . . : the set of network vessels in the arteriolar and venular trees
Ωcap. . . : the set of capillary vessels connected to a coupling point
Ωlin,s . . . : a spherical subdomain of R3 of radius lΓ, centered in the coupling point s
ΩF V . . . : the set of cells used to discretize the continuum
Ωs
F V,neigh. . : the cell coupled to the point s and its neighbours, including the diagonal ones
ΩsF V,neigh. . : a reduction of ΩsF V,neigh, which excludes the coupled cell
Ωε
F V . . . : a reduction of ΩF V, which excludes the sets ΩsF V,neigh
Ωssph. . . : the set of cells that share a face with ΩsF V,neigh
Ωs,εsph. . . : an extension of Ωssph, which includes the cells sharing a corner with Ωs
F V,neigh
Ωs
sph. . . : a subdomain of R3 that corresponds to Ω
s F V,neigh∪ Ω s sph Errors εp
ω. . . : the pressure error related to the component ω (vertex or cell)
εq
ω. . . : the flow rate error related to the component ω (edge or surface between two cells)
εpΩ . . . : the mean pressure error computed in the domain Ω
εqΩ . . . : the mean flow rate error computed in the domain Ω
Partitioning
M . . . : the number of discretization cells of the continuum
Mx. . . : the number of discretization in the x-direction
My. . . : the number of discretization in the y-direction
Mz. . . : the number of discretization in the z-direction
p . . . : the number of available processing units
px. . . : the number of processing units assigned to the domain partitioning in the x-direction
py. . . : the number of processing units assigned to the domain partitioning in the y-direction
1
Introduction
The aim of this Introduction section is to outline the motivations of the present thesis, while a detailed state-of-the-art and literature survey will be presented in the next section. Here, our goal is to provide a global perspective on the problem we want to address, highlighting the importance of better understanding cerebral hemodynamics, molecular exchanges between blood and the neuronal network, and neurovascular coupling, i.e. the relationship between blood flow regulation and neuronal activity. By presenting the main limitations of the existing investigation tools, we want to point out the challenges of this thesis. Further, we detail both the overall strategy and the specific goals of the present work with a view toward whole-brain investigation, focusing on the multiscale nature of the human brain architecture.
1.1
Why is the brain microcirculation important?
The brain microcirculation plays a key role in cerebral physiology, since blood flowing through the cerebral microvasculature is the primary driver of oxygen delivery and metabolic waste removal in the cortex. In particular, cerebral blood flow is the main energy supplier of neurons [Boas et al., 2008, Hirsch et al., 2012, Sakadžić et al., 2014, Lücker et al., 2015, Schmid et al., 2017]. As a consequence, it is closely related to neuronal activation, i.e. the solicitation of specific neurons in response to internal or external stimuli (e.g. visual). Thus, better understanding the physiological mechanisms involved in the human brain microcirculation would provide a new angle of investigation on the relationship between blood flow regulation and neuronal activity, which is crucial for the study of the neurovascular coupling [Buxton et al., 2004, Girouard and Iadecola, 2006, Metea and Newman, 2006, Hamilton et al., 2010].
Further, the brain microcirculation is also linked to neurodegenerative diseases, such as Alzheimer’s Disease (AD), or sudden stroke events. In both cases, severe deterioration of the microvascular net-works may occur (e.g. vascular occlusions or capillary rarefaction [Hunter et al., 2012]). Such structural modifications limit blood flow, thus oxygen, nutrients and waste transfers with the cortex, possibly resulting in supply shortage and neuronal death [Shih et al., 2015]. Understanding how such disease-induced modifications of the microvascular structure affect blood flow and transport mechanisms in the brain is a fundamental challenge with regard to diagnosis and prevention issues [Iadecola, 2013]. For instance, it has been recently demonstrated in humans that blood flow
de-1. Introduction
creases early in AD, before any measurable change in other biomarkers or onset of cognitive decline [Iturria-Medina et al., 2016]. Thus the development of new clinical procedures based on the rela-tionship between brain hemodynamics (e.g. regional blood flow), mass transfers (e.g. diffusion of markers) and pathologies could lead to clinical breakthroughs with regard to diagnosis and treatment strategies.
Yet cerebral microcirculation received much less interest than “more fascinating” components of the brain, such as the central nervous system and the associated neuronal networks [Itti and Koch, 2001, Guenther et al., 2006, Friston, 2009, Rottschy et al., 2012]. Comparatively, we still understand little about the structure and functions of the microvascular networks, let alone their regulation mechanisms, robustness to perturbations and involvement into pathologies. In particular, we still need to improve the accuracy of the available investigation tools at the scale of the whole brain, for the purpose of understanding the systemic impact of localized effects, such as a vascular occlusion, in both physiology and physiopathology.
1.2
The cerebral vasculature: a multiscale architecture
The cerebral circulation involves a broad range of spatial scales [Perdikaris et al., 2016]. This multi-scale architecture makes it difficult not only to understand the mechanisms occurring at the different levels, but also to understand and assess their interdependency. It also makes it difficult to combine investigation tools that are confined to separate scales (e.g. neurofunctional imaging and numerical models, as discussed below). To support our speech, we take the time here to detail the structural organization of the entire cerebral vasculature, the scales of interest and the vocabulary that will be used in the remainder of this manuscript.
The role of the cerebral circulation is to supply cells of the neuronal network (e.g. neurons, astrocytes or glial cells), which are embedded in the cerebral tissue, with nutrients, and to drain the metabolic waste out of this tissue. To perform this function, the circulation is divided into two distinct parts, the macro and microcirculation, that each have different roles.
1.2.1 The brain macrocirculation
The macrocirculation contains the largest vessels and is aimed at rapid, stable and resilient transport. As displayed in Fig. 1.1(a)), the carotids are the largest arteries of this macrocirculation. They
1. Introduction carry blood from the heart to the brain. They are connected to the Circle of Willis, which is a circulatory anastomosis, i.e. a loop of interconnected arteries, as displayed in Fig. 1.1(b)i. By creating redundancy, this very specific arrangement provides resilience and prevents supply shortage in the event that parts of the upstream arteries are blocked or narrowed, for instance in case of stenoses or aneurysms rupture [Cassot et al., 1995]. This roundabout structure is also perfectly adapted to distribute blood toward all the regions of the cortex, through the cerebral arteries, as schematized in Fig. 1.1(b)ii. Further away, these cerebral arteries are extended by pial arteries, which also have a redundant structure. As shown in Fig. 1.1(b)ii, these pial vessels deploy on the entire surface of the cortex. When they enter into the cortex, the vessels are below hundred microns in diameter and the pulse wave induced by the heart pumpage has been damped in the upstream vessels [Santisakultarm et al., 2012]. While this arteriolar pial system is in charge of supplying oxygen and nutrient, a similar venular pial network is in charge of carrying the blood back to the heart and draining the metabolic waste out of the cortex.
Anterior cerebral artery Internal carotid artery Circle of Willis Basilar artery
Bottom view of brain Posterior cerebral artery Middle cerebral artery i ii (a) (b)
Figure 1.1: Schematics of the larger vessels of the human cerebral circulation. (a) The carotids bring the blood pumped by the heart to the brain. Source: http://www.strokecenter.org/professionals/brain-anatomy/blood-vessels-of-the-brain/. (b) At the bottom of the brain, the circle of Willis distribute blood to all the regions of the brain through the cerebral arteries. Adapted from: http://pennstatehershey.adam.com/content.aspx?productId=116&pid=2&gid=18009.
1. Introduction
1.2.2 The brain microcirculation
The intracortical vasculature is commonly called the brain microcirculation, which is the region of interest in the present work. Fig. 1.2 displays its multiscale architecture. As detailed below, the microvasculature is composed of two main classes of vessels: the capillaries and the arteriolar and venular trees.
Embedded in the cortex, the capillaries are the smallest vessels of the cerebral vasculature (1-10 µm in diameter), as displayed in red in Fig. 1.2(c) and (d). They form a dense structure that is termed “capillary bed”. This is the main place of molecular exchanges between the blood and the brain cells, which are located within the surrounding tissue. In capillaries, the red blood cells and the molecules transported by the plasma carry oxygen and nutrients, respectively. To supply brain cells, they pass through the endothelial cells that compose the vascular wall and diffuse in the cerebral tissue. The space-filling mesh-like structure of the capillary bed ensures supply to all regions of the cerebral tissue by minimizing the distance between any point of the brain tissue and the capillary vasculature [Lorthois and Cassot, 2010]. As a result, it involves a huge number of vessels, which is estimated at tens of billions in a whole human brain.
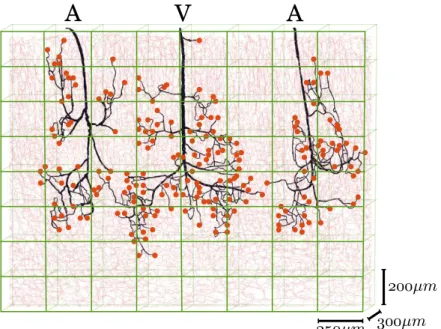
The penetrating arterioles and ascending venules connect this capillary bed to the upstream pial arteries and downstream pial veins at the surface of the cortex. Contrary to the capillary network, they present a tree-like structure [Cassot et al., 2009, Lorthois and Cassot, 2010] composed of a main trunk perpendicular to the cortical surface and connected to branches, with diameters in the range ∼10-100 µm. They are displayed in black in Fig. 1.2(c). While the penetrating arterioles supply the capillary bed with blood carrying oxygen and nutrients, the ascending venules drain the blood transporting the metabolic waste, which is produced by the functioning of the neurons. Their tree-like structure is adapted to their function of efficiently delivering blood down to the bottom of the cortex.
1.2.3 Scales terminology
For consistency, the scales terminology used in the remainder of this manuscript is as follows (see also Fig. 1.2):
• the microscopic or capillary scale refers to a the scale of a capillary vessel, which length is typically ∼ 50 µm (Fig. 1.2(d));
1. Introduction (c) 500 ¹m (a) (b) (d) 1mm 100 ¹m x y
Figure 1.2: Multiscale architecture of microvascular networks in human brain. (a) Brain scale (∼60 cm2×300 µm): 300 µm-thick cortical section, where blood vessels have been injected with India ink for contrast enhancement [Duvernoy et al., 1981]. (b) Macroscopic scale or cortical scale (∼20 mm2×300 µm): reconstruction of parts of the collateral sulcus by confocal laser microscopy [Cassot et al., 2006]. (c) Meso-scopic scale (∼5 mm2×300 µm): region of interest in which vessels of more than 10 µm in diameter are colored in black and vessels of less than 10 µm in diameter are colored in red (diameters have been mul-tiplied by 2 for visualization). In contrast with the capillary bed, the arteriolar and venular trees have a quasi-fractal structure [Lorthois and Cassot, 2010]. (d) Representative Elementary Volume the capillary bed (∼0.05 mm2×300 µm): detailed view of the capillary bed. The capillary bed is dense and space-filling over a cut-off length of ∼ 50 µm [Lorthois and Cassot, 2010].
• the mesoscopic scale refers to a representative volume of the microvasculature, as displayed in Fig. 1.2(c). Such volume includes both tree-like structures (in black) and the space-filling mesh-like capillary bed (in red). The duality of this architecture will be at the heart of the present work, as discussed in more detail in the remainder of the manuscript;
• the macroscopic or cortical scale refers to a representative volume of the cortex, e.g. a circon-volution, as displayed in Fig. 1.2(b);
• the brain scale refers to the whole cortex (Fig. 1.2(a)).
1.3
Limitations of the existing investigation tools
As already mentioned, the brain microvasculature is the place of crucial hemodynamics and transport mechanisms with regard to neuronal functioning. This has motivated the development of a large number of investigation tools for the last decades. In this section, we focus on approaches that became standard in either communities of cerebral physiology and neuroimaging, which both rely on invasive or non-invasive imaging techniques in the framework of animal experiments or cognitive clinical studies, or numerical simulation. However, all these approaches still present limitations that
1. Introduction
prevent investigation of the microcirculation at the scale of a whole human brain. More detail about the progress allowed by such technologies and their limitations will be brought in Section 2. The goal of this section is to lay the groundwork for introducing the objectives of the present thesis.
1.3.1 Investigation tools in “relatively small” volumes
i. Brain imaging techniques. In the last decade, advances in imaging techniques led to rapid progress in the experimental investigation of brain microcirculation. In particular, multiphoton laser scanning microscopy [Shih et al., 2012, Hirsch et al., 2012], a cutting-edge fluorescence microscopy with unprecedented microscopic scale resolution and cortical penetration depth, has enabled the spatio-temporal investigation of hemodynamics and mass transfers at macroscopic scale in the living brain of healthy or diseased rodents [Nishimura et al., 2006, Boas et al., 2008, Tsai et al., 2009]. This
corresponds to a cerebral volume up to 10 mm3 containing tens of thousands of vessels.
Furthermore, recent whole-brain post-mortem imaging techniques make it already realistic to ob-tain three-dimensional datasets of the whole microvascular network in mice, with a spatial resolution enabling the reconstruction of the network representation down to the scale of capillaries [Mayerich
et al., 2011]. This corresponds to volumes of ∼500 mm3 containing millions of vessels.
However, such volumes are still relatively small compared to the volume of a whole human brain
(∼700 cm3 containing tens of billions of vessels), and such performance is not possible in humans yet.
Nowadays, the best way of obtaining three-dimensional post-mortem human anatomical datasets is to combine confocal microscopy that generates images of thick cortical sections (∼300 µm, as displayed in Fig. 1.2), and computer-assisted methods of reconstruction to connect them to each other. Such methods allow the description of three-dimensional microvascular structures down to the scale of
capillaries, in volumes up to ∼1 mm3 [Cassot et al., 2006], as displayed in Fig. 1.3(a).
ii. Numerical simulation. Numerical approaches have also proven themselves for understanding regulation mechanisms induced by structural variation of the microvasculature, and their impact on blood flow and mass transfers. In particular, a lot of emphasis has been put on network approaches. In these approaches, the vasculature is treated as a network of interconnected tubes and transport mechanisms are averaged at the scale of individual vessels, down to the microscopic scale. While this is an advantage to investigate the details of blood flow dynamics, microscopic knowledge of the geometry and topology of the vascular network is required to perform such computations, therefore
1. Introduction
limiting the computational volume to that of available anatomical databases in humans (∼1 mm3)
[Reichold et al., 2009, Lorthois and Cassot, 2010], as displayed in Fig. 1.3(b).
D ia m e te r Pressure (a) (b)
Figure 1.3: Blood flow dynamics in “relatively small” volumes compared to human whole-brain dimensions. (a) This figure has been extracted from [Cassot et al., 2006]. This displays a two-dimensional projection of a three-dimensional reconstruction of the collateral sulcus in the temporal lobe of a human brain. Such reconstruction stems from the combination of confocal microscopy and computer-assisted methods of three-dimensional reconstruction. (b) This figure has been extracted from [Lorthois et al., 2011a]. This displays the pressure distribution obtained by simulation of blood flow in the human anatomical dataset displayed in (a). Note that the two representations are mirror images.
1.3.2 With a view to brain-scale investigation
i. Brain imaging techniques. Perfusion imaging (Pi) techniques and hemodynamically-based functional imaging (HbFi) techniques both enable brain imaging at the scale of a whole human cortex. Both Pi and HbFi techniques are based on the use of a contrast agent, or tracer, which produces contrast while carried by the blood stream and flowing through the observed organ. The signal changes induced by the tracer are measured dynamically and converted into concentration-time curves by application of a modality-specific signal model. This allows the generation of a series of maps, representing the spatio-temporal evolution of the tracer concentration at a scale defined by the spatial resolution of the imager [Sourbron, 2014].
Various tracer classes are associated to these techniques (see Table 1): intravascular tracers, which do not cross the blood-brain-barrier and remain in blood, or diffusible tracers, which can be transported across vessel walls and diffuse into the brain tissue; exogenous tracers, that must be injected to the subject making the imaging technique invasive, or endogenous tracers, that are
1. Introduction
naturally present in blood (or can be remotely excited, e.g. using a radiofrequency field in MRI).
Tracer Imaging modality Tracer properties
Gadolinium MRI Exogenous Intravascular
Deoxygenated Haemoglobin BOLD-fMRI Endogenous Intravascular
Excited protons ASL-MRI Endogenous Diffusible
Radiolabeled water PET Exogenous Diffusible
Table 1: Example of tracers and tracer properties associated to various imaging modalities.
In Pi techniques (e.g. Positron Emission Tomography, PET, or Arterial Spin Labeling, ASL-MRI), the resulting concentration-time tracer profiles are analyzed using very simple compartmental models to deduce cerebral blood flow (CBF, see Fig. 1.4(a)). Such models are well known to be highly oversimplified, leading to large errors in flow estimates [Sourbron, 2014, Lorthois et al., 2014]. Nevertheless, they are largely used in the clinics [Wintermark et al., 2005], mainly because of their simplicity and the lack of alternate modelling approaches.
HbFi techniques (e.g. PET or Blood-Oxygen Level Dependent functional Magnetic Resonance Imaging, BOLD-fMRI) rely on the same basic principles, but are used to study the variations of tracer concentrations or CBF induced by a change of cerebral activity. Two acquisition sessions are performed sequentially, the first one associated with a reference task (often rest), and the second one while the task of interest (e.g. visual, motor, memory test) is performed by the subject (healthy human or patient). The underlying idea is that, because of the strong regulation of blood flow as a function of local neural activity (neuro-vascular coupling [Harrison et al., 2002]), the associated hemodynamic variations can be interpreted as changes in neuronal activity. Such techniques are widely used for research in fundamental cognitive neurosciences [Fan et al., 2003, Werring et al., 2004]. They are also widely used in clinics to support diagnosis and help design prevention strategies [D’Esposito et al., 2003]. However, many authors have noted that better understanding the relation-ship between neuronal activity and signal changes is still needed. In particular, how the underlying vascular architecture (e.g. capillary density) modulates this relationship is still poorly understood [D’Esposito et al., 2003, Weber et al., 2008, Lorthois et al., 2011b, Schmid et al., 2017].
Such imaging methods may differ by quantitative accuracy, but they typically characterize
hemo-dynamics and neuronal activation in large brain-scale volumes (100 cm3) at the scale of voxels
1. Introduction in this manuscript (Fig. 1.2(c)). Thus, no distinction can be made in the image maps between the tree-like arterioles and venules, and the capillary bed: the details of the underlying vasculature is not discernible. Therefore, while HbFi and Pi techniques are able to image a whole human brain, they are limited by their resolution, which is quite poor to study blood flow dynamics.
ii. Numerical simulation. Contrary to HbFi techniques, numerical network approaches are able to describe hemodynamics and mass transfers at the scale of individual vessels. For the purpose of applying network approaches to larger volumes despite the lack of human anatomical data at this scale, synthetic networks may be used to replace the capillaries and/or the arteriolar and venular trees, as in Fig. 1.4(b). For that purpose, complex algorithms have been developed to generate synthetic networks with anatomically accurate statistical properties (e.g. mean vascular length and diameter, trifurcations, presence or not of vascular loops) [Lorthois and Cassot, 2010, Linninger et al., 2013, Smith, 2016, Merrem et al., 2017]. However, even if such networks were generated at the scale of the whole brain, the huge number of vessels involved (tens of billions) still represents a significant numerical obstacle. Thus these approaches are computationally limited to relatively small
cortical volumes, with no volume larger than 30 mm3 (Fig. 1.4(b)) exploited yet in the context of
brain microcirculation.
To summarize, today brain imaging techniques allow the visualization of the whole human brain, but only at the scale of voxels, i.e. at mesoscopic scale. In parallel, numerical network approaches have proven themselves to accurately describe blood flow and mass transfers at the scale of individual vessels, i.e. at microscopic scale. However, the computational limitations of today supercomputers prevent any simulation resolved at this scale to be performed in a whole human brain using such detailed models. Finally, in a perspective of whole-brain studies, imaging techniques and numerical simulations are confined to separate scales of the cerebral microvasculature. As a consequence, the combination of these two investigation tools, which would considerably accelerate our understanding of crucial physiological mechanisms in human brain microcirculation, is not possible yet.
1.4
Objective of the present work
This thesis is part of the BrainMicroFlow project (http://brainmicroflow.inp-toulouse.fr/en/home.html), which has been awarded to Sylvie Lorthois in 2014 by the European Research Council (ERC). In
1. Introduction
10 cm
3 mm
(a) (b)
Figure 1.4: Scale difference between images obtained by a standard brain imaging technique and the flow rate distributions computed by a standard network approach. (a) This figure has been extracted from the review of Wintermark et al. [Wintermark et al., 2005]. This represents the PET CBF images of a patient with moyamoya disease, before (Pre) and after (Post) a right-hand side bypass surgery. (b) This figure has been extracted from the paper of Linninger et al. [Linninger et al., 2013]. A vasculature of volume 3 mm × 3 mm × 3 mm is presented. Both the larger vessels (on the top) and the capillaries (added on the bottom image) have been generated from algorithmic methods. Blood flow has been simulated in this structure using a standard network approach, which expresses the average flow rate in each vessel as a linear function of the local pressure drop.
a long-term view, the perspective of this project is to allow the combination of brain imaging tech-niques and numerical models at clinically relevant scale. This would be a valuable tool to understand the structure/function relationships of brain microcirculation in humans, in healthy or diseased con-dition, with a focus on the role of vascular factors in Alzheimer’s Disease.
For that purpose, we must bridge the gap between the accuracy of the network approaches in describing blood flow and transport mechanisms at microscopic scale, and the ability of the HbFi techniques to investigate the whole human brain with a mesoscopic resolution. For that purpose, as computational modellers, we focus on building new numerical tools, which will allow the simulation of blood flow and mass transfers: (1) at mesoscopic scale, and (2) in the whole human brain.
To our knowledge, no such numerical tools have been developed yet in the context of brain microcirculation. Thus, the specific goal of the present manuscript is to build solid theoretical foundations for introducing a completely new simulation paradigm. Because we are at the beginning
1. Introduction of a step by step validation process, we focus here on blood flow distributions only, under some simplifying assumptions (e.g. isotropy of the capillary bed or uniform hematocrit) that will be further detailed in Section 3. The aim here is to establish and validate a relevant strategy, which will open the way to account for additional levels of complexity in the future, in particular to mass transfers.
1.5
Strategy adopted
In this section, we detail our strategy to achieve the simulation of blood flow distributions: (1) at mesoscopic scale, and (2) in the whole human brain. This also gives the opportunity to introduce the structure of the present thesis, which is in line with this strategy.
1.5.1 For the simulation of blood flow at mesoscopic scale
i. The idea. The idea is to upscale the flow equations used in network approaches from the scale of individual vessels to larger volumes that are representative at mesoscopic scale. This upscaling process is termed homogenization, and requires the existence of a unique characteristic length-scale of the medium. This is the case of the mesh-like capillary bed that has been proven to become dense and homogeneous over a cut-off length of ∼ 50 µm [Lorthois and Cassot, 2010, Cassot et al., 2010]. However, this is not the case of the arteriolar and venular tree-like vessels that present a quasi-fractal structure [Lorthois and Cassot, 2010]. As a consequence, we will only apply the homogenization process to the capillary bed, and use a standard network approach in the larger vessels of the brain microvasculature. The resulting approach is called hybrid, since it will involve two separate frameworks, according to the dual architecture of the cerebral microcirculation.
Homogenizing the flow equations in the capillary bed consists in replacing it by a continuum, where the flow is characterized by partial differential equations and effective properties (e.g. perme-ability) at the scale of a much larger representative volume [Bear, 1972, Erbertseder et al., 2012].
As will be justified later, such volume is typically in the order of magnitude of (100 µm)3, which
corresponds to the mesoscopic scale. The first advantage of this approach is that the use of effective properties prevents the need for microscopic knowledge of the capillary geometry and topology in the whole cortex. Second, the flow equations in the continuum will be discretized on a coarse grid, using the finite volume method [Eymard et al., 2000, Versteeg and Malalasekera, 2007]. This will tremendously decrease the computational cost compared to the classical network approaches, since a
1. Introduction
cell of the coarse finite volume grid may contain hundreds of capillaries, thereby reducing the number of unknowns of the problem. Finally, the resulting pressures and flow rates will be representative at the scale of the finite volume cells, i.e. at mesoscopic scale, in the same spirit as the information obtained by HbFi and Pi imaging techniques at the scale of voxels.
ii. What already exists. Homogenization is commonly used in the community of porous media [Bear, 1972, Whitaker, 1986, Quintard and Whitaker, 2000, Davit et al., 2013a]. As detailed in Section 2, such upscaling process has already been used for the modelling of blood flow and molecular exchanges in the context of lung tumor or brain microcirculation, which both involve arteriolar and venular trees connected to capillary networks [El-Bouri and Payne, 2015]. However, the tree-like constraint of the largest vessels, which prevent such structure to be homogenized, is sometimes overlooked [Hyde et al., 2014]. In this work, as in previous work [Erbertseder et al., 2012], we account for the dual architecture of microvascular networks by developing a hybrid approach. The network and continuum models involved will be presented in Section 3. As presented below, our contribution further aims at improving the existing hybrid methods by developing a proper multiscale coupling strategy at the interface between the arteriolar and venular trees modelled by network approaches, and the homogenized capillary bed.
iii. What is new. One of the main difficulty of the hybrid method, which has been overlooked in previous work and will be at the heart of this manuscript, is the development of a proper coupling model at the interface between the arteriolar and venular trees, and the capillary bed, i.e. at the interface between the network and continuum approaches. Indeed, high pressure gradients build up at the scale of the capillaries in the vicinity of the coupling points, i.e. where the arteriolar or venular end-tips are connected to a capillary, and must be properly described at the scale of the continuum. This is difficult primarily because variables that are seemingly identical do not have the same physical meaning. In particular, the blood pressure in the continuum approach represents a field that is spatially averaged over a representative volume of the capillary bed, while the pressure of the network approach represents a cross-sectional average within each tube. Simply imposing a condition of pressure continuity at the interface between the two frameworks may imply important errors that could propagate through the whole system. To our knowledge, this kind of multiscale coupling has never been discussed in the context of brain microcirculation. By contrast, numerous multiscale coupling models exist in hydrology or petroleum engineering to describe flow fields in
1. Introduction fractured aquifers, or interactions between a wellbore and the surrounding porous rock.
Taking inspiration of the “well models” developed by Peaceman in this last context [Peaceman, 1978], we will introduce a coupling model based on the use of analytical solutions to describe the pressure field in the vicinity of coupling points. This development will be detailed in Section 4. The main advantage of this approach is that the resulting equations yield a strong coupling, i.e. a single linear system to solve for both the network part and the continuum, thus limiting the computational cost compared to iterative methods that are often used to couple separate frameworks.
iv. How we will validate our approach Our hybrid approach will be validated in Section 5 by comparing our results with “complete network” (CN) simulations, where all the vessels are modelled using a classical network approach, including the capillaries. Since network approaches have been proven to accurately describe blood flow in microvascular networks [Pries et al., 1990], they are considered as a reference in the context of brain microcirculation. To further highlight the need for a proper multiscale coupling model, our results will be compared to “simple hybrid” (SH) computations, where a simple condition of pressure continuity will be imposed at the interface between the network part and the continuum. Such coupling condition overlooks the coupling issues described above.
In Section 5.2, we will first validate the multiscale coupling model, which is at the heart of our hybrid approach. For that purpose, we will compare the results of CN and SH simulations in idealized configurations involving periodic synthetic capillary networks. Furthermore, these idealized test cases will involve only a few couplings induced by the connection of the continuum with isolated arteriolar and/or venular vessels, i.e. arteriolar and/or venular vessels that are not interconnected. In this way, the flow fields in the vicinity of couplings will interact only via the continuum, not via the network part. As will be detailed, the use of both simplified capillary networks and isolated arteriolar/venular vessels enables us to avoid two kinds of uncertainties in the computation of errors: those induced by the estimation of effective properties of the continuum, and those induced by the rheology of blood flow dynamics in complex arteriolar and venular trees.
In Section 5.3, the comparison of our results with CN and SH simulations will be progressively extended to more realistic, i.e. anatomically accurate, configurations. First, the synthetic representa-tion of capillary networks will be complexified by adding morphometrical and topological constraints that typically occur in the brain microcirculation (e.g. trifurcations or distribution of vessels di-ameters). In this case, the network part will still involve isolated arteriolar and/or venular vessels. The point will be to assess the robustness of the continuum approach in accounting for microscopic
1. Introduction
variations of the underlying capillary structure. Second, we will extend the validation of our model to configurations involving anatomic, thus complex, arteriolar and/or venular trees. In this case, the capillary networks will still be represented by idealized synthetic lattices. The point will be to evaluate the interaction between couplings that are interconnected, i.e. connected via the network part. Finally, an application to a fully realistic configuration will be presented in Section 5.4. This application will involve both anatomical arteriolar and venular trees, which display a large number of interconnected couplings, and a realistic capillary network.
1.5.2 For the simulation of blood flow in the whole human brain
As mentioned above, replacing the capillary bed by a continuum implies an important computational gain. However, it is far from being sufficient to consider the extension to mass transfers and simu-lations at the scale of a whole human brain. That is why the hybrid approach is implemented in a C++ code designed for High Performance Computing (HPC), as detailed in Section 6.3. First, it is fully parallelized using Message Passing Interface (MPI) standards. The parallel architecture of the linear system to solve is handled using the PETSc library, and the distribution of the structure among the processing units is operated by specialized partitioning tools, including the ParMETIS library. The performance of our code will be presented in Section 6.3.4.
Further, since the present work is part of a larger project, which involves several collaborators, the numerical platform has been thought as a long-term wide-variety computational tool. In particular, special care has been taken in developing efficient coding strategies (e.g. testing, pair-programming) to ensure the performance, the reliability and the portability of the code. Details about these strate-gies will be provided in Section 6.1.
The aim of the present manuscript is to validate the potential of combining a hybrid approach and high performance computing to simulate blood flow at mesoscopic scale in a whole human brain. To assess this statement, we will finally present, in Section 7, the computational performance of
our code (e.g. execution time) when running a simulation of blood flow in a volume of ∼16.2 cm3
of the brain microvasculature. No such volume has been investigated in the context of the human brain microcirculation yet. This execution will assess the computational potential of our approach with regard to whole-brain simulations of blood flow in humans.
1. Introduction brain exists yet, such imaging performance will be soon possible. Indeed, recent brain imaging techniques are already able to image all vessels above 7 µm, i.e. all tree-like arterioles and venules,
in rat brains of volume ∼2 000 mm3 [Zhang et al., 2015]. With the evergrowing improvement in
technologies, we can imagine that this capacity will extend to larger mammals, including humans
(brains of volume∼ 700 cm3), in the next decades. This perspective support our own project, which
2
Current approaches for modelling
blood flow and mass transfers
in human brain microcirculation
In this section, we present an overview of the main works of previous decades that support the current models of blood flow and mass transfers in the human cerebral microcirculation. We focus on applications to human brain, but references to similar applications (e.g. human lung microcirculation or animal cortex) are also made as comparison or sources of inspiration. This overview covers several topics, from the morphological study of the human cerebral microvasculature to the existing hybrid approaches for modelling blood flow and mass transfers in microvascular networks. The first goal of this presentation is to provide an insight of the current landscape, in which our work is included, to then introduce the equations of our model in Section 3. The second goal is to understand the limitations of the current approaches, especially with regard to computational performance and multiscale coupling in the hybrid approaches.
2.1
Microvascular architecture and blood rheology
2.1.1 Anatomical material and investigation of the microvascular architecture
As mentioned in the Introduction, the oxygenation of the cerebral tissue is strongly dependent on the spatial arrangement of the microvessels. Thus the investigation of blood flow and mass transfers in the brain microvascular networks first requires a good knowledge of their morphology and topology.
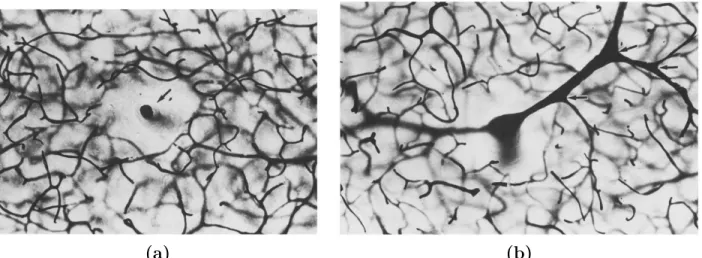
In the human cortex, most of the anatomical material comes from the work of Duvernoy et al. [Duvernoy et al., 1981], who injected the intravascular network of twenty-five different brains with Indian ink and gelatin. As displayed in Fig. 2.1, this technique is able to outline the inner space of the vessels down to the scale of the capillaries, using stereoscopic or scanning electron microscopy. Such level of details supported major advances from the 1980s concerning the classification and the morphological study of the cortical vessels in healthy or pathological conditions [Duvernoy et al., 1983, Raybaud et al., 1989, Hirsch et al., 2012].
2. Current approaches for modelling blood flow and mass transfers
(a) Superficial cortical vessels
(b) Intracortical vessels
Figure 2.1: Duvernoy et al.’s study [Duvernoy et al., 1981] of the morphology of the cortical vessels in the human brain. (a) Left: photograph of the medial orbital gyrus of 49 years old male. Right: drawing of the cortical pial vessels of a 50 years old female. (b) Left: photograph of a cortical section of the temporal lobe of a 54 years old male. Right: drawing of the morphological features of the penetrating arteries (red) and ascending veins (black).
density in intracortical regions of the brain. In particular, he highlighted the stratified structure of the intracortical vasculature and differentiated about ten different layers according to their vascular density and the depth of penetration of the arteriolar and venular trees (see Fig. 2.1(b)). Further-more, he observed capillary-free zones in the vicinity of the penetrating arterioles and ascending venules, as displayed in Fig. 2.2. This capillary-free zone has received several names (e.g. Pfeiffer space). In this work, it will be termed Virshow-Robin space, according to the clinical vocabulary [Heier et al., 1989]. As confirmed later by [Kasischke et al., 2011], Duvernoy suggested that the
2. Current approaches for modelling blood flow and mass transfers supply of this zone with oxygen and nutrients is not provided by the capillaries, but rather by the largest arteriolar and venular vessels, whose wall characteristics allow molecular exchange with the surrounding cerebral tissue. Further, [Al-Kilani et al., 2008] proved later that this typical spatial organization mainly stems from the remodelling of the capillaries into arterioles or venules during the morphogenesis of the brain microcirculation. Consistent with this idea, the radial distance between the capillaries and the largest vessels has recently been estimated to ∼ 50 µm [Kasischke et al., 2011], which corresponds to the typical length of a capillary vessel.
(a) (b)
Figure 2.2: Observation of capillary-free regions in the vicinity of the largest intracortical vessels by Durvernoy. The study of the vascular density in the intracortical vasculature highlighted capillary-free areas in the vicinity of both the penetrating aterioles (a) and the ascending venules (b).
While the work of Duvernoy enabled significant advances in the understanding of the morpholog-ical characteristics of the human brain microcirculation, the lack of three-dimensional quantitative data was still an obstacle with regard to topological analysis of microvascular networks.
In 2006, Cassot et al. developed a computer-assisted method to derive three-dimensional images from confocal laser microscopy [Cassot et al., 2006]. By applying this method to 300 µm-thick sections of an Indian ink-injected brain of the Duvernoy collection, they reconstructed volumes of several cubic millimeters of the intracortical vasculature, opening the way to the spatial characterization of human microvascular networks [Cassot et al., 2010, Lauwers et al., 2008, Lorthois and Cassot, 2010]. Such studies highlighted a large heterogeneity in microvessels (e.g. vessels length, diameter or tortuosity), depending on their hierarchical position in the brain microcirculation. Moreover, they pointed out the multiscale architecture of the microvasculature by differentiating homogeneous and fractal patterns. This study identified the dual architecture of the microcirculation composed
2. Current approaches for modelling blood flow and mass transfers
of quasi-fractal tree-like arteriolar and venular trees, plunging in a space-filling mesh-like capillary bed, as displayed in Fig. 1.2. In particular, it has been shown that capillary bed becomes dense and homogeneous beyond a cut-off length of ∼50 µm, which corresponds to the typical length of a capillary [Lorthois and Cassot, 2010].
Such multiscale classifications have also been discussed in animals [Heinzer et al., 2006]. Fur-ther than establishing a hierarchy in microvessels, these studies led to important hypotheses on microvascular angiogenesis (i.e. growth of new vessels from pre-existing ones during the embryonic development [Le Noble et al., 2005]), and to the characterization of the microvascular networks in healthy and pathological conditions (e.g. fractal properties of tumourous microvascular structures in primate and rat [Risser et al., 2007]). Moreover, the topological analysis of the space-filling mesh-like structure of the capillary bed opened the way to the generation of synthetic network representations that accurately mimic the capillary architecture (e.g. based on Voronoi diagrams [Lorthois and Cassot, 2010]). Such synthetic capillary networks are essential for investigating the brain
microcircu-lation in large cortical volumes, i.e. larger than ∼ 1 mm3. Indeed, as mentioned in the Introduction,
today imaging techniques do not allow the observation of the cerebral microvasculature down to the scale of capillaries in such volumes yet.
Besides the fundamental interest in understanding the architectural organization of brain mi-crovascular networks, their morphometrical and topological characteristics impact the blood flow dynamics through the complex rheology of blood in presence of confined vessels and bifurcations. That is why, in the next paragraph, we detail the three main non-linear rheological properties of blood in microvessels and their impact on blood flow dynamics.
2.1.2 Blood rheology in microvascular networks
The complex rheology of blood is mainly induced by the circulation of red blood cells. Indeed, while 50 % of the blood volume is composed of plasma, which is a Newtonian fluid similar to water in density, the remaining 50 % are mainly composed of red blood cells (99 % of the molecular components), which are in charge of carrying and releasing oxygen. The percentage of the blood volume occupied by the red blood cells (RBCs) is called hematocrit, and is about 45 % in humans.
More specifically, the tube hematocrit HT, i.e. the volume fraction of RBCs within a vessel at a given


![Figure 2.8: The general model concept used in [Erbertseder et al., 2012]. These figures has been extracted from [Erbertseder et al., 2012]](https://thumb-eu.123doks.com/thumbv2/123doknet/3096720.87756/51.918.118.801.81.443/figure-general-model-concept-erbertseder-figures-extracted-erbertseder.webp)