Any correspondence concerning this service should be sent
to the repository administrator:
[email protected]
This is an author’s version published in:
http://oatao.univ-toulouse.fr/27290
To cite this version: González Martínez, María and Dupont,
Capucine and Anca-Couce, Andrés and da Silva Perez,
Denilson and Boissonnet, Guillaume and Thiéry, Sébastien and
Meyer, Xuân-mi and Gourdon, Christophe Understanding the
torrefaction of woody and agricultural biomasses through their
extracted macromolecular components. Part 2: Torrefaction
model. (2020) Energy, 210. 118451. ISSN 0360-5442
Official URL
DOI :
https://doi.org/10.1016/j.energy.2020.118451
Open Archive Toulouse Archive Ouverte
OATAO is an open access repository that collects the work of Toulouse
researchers and makes it freely available over the web where possible
Understanding the torrefaction of woody and agricultural biomasses
through their extracted macromolecular components. Part 2:
Torrefaction model
Maria Gonzalez Martinez
a. b, c,*
, Capucine Dupont
ct
, Andrés Anca-Couce
e,Denilson da Silva Perez
f,Guillaume Boissonnet
c,Sébastien Thiéry
c,Xuân-mi Meyer
b,Christophe Gourdon
ba Université de Toulouse, IMT Mines Albi, RAPSODEE CNRS UMR-5302, Campus jarlard, F-81013 Albi Cedex 09, France
b Laboratoire de Génie Chimique, Université de Toulouse, CNRS, INPT, UPS, Toulouse, France c Université Grenoble Alpes, CEA, Laboratory of Bioresources Preparation (LPB), Grenoble, France
d IHE Delft lnstitute for Water Education, Department of Environmental Engineering and Water Technology, Delft, the Netherlands • lnstitute of Thermal Engineering, Graz University of Technology, lnffeldgasse 25b, 8010, Graz, Austria
r FCBA, lnTechFibres Division, CS 90251, 38044, Grenoble, France
ABSTRACT Keywords: Biomass Torrefaction Solid kinetics Polysaccharides Lignin
A new torrefaction mode! was proposed for predicting solid mass loss in torrefaction as a function of biomass main macromolecular composition and type, as well as on the operating conditions. To do this, solid degradation kinetics were modelled following a 2-successive reaction scheme for each macro compound and the additive modelling approach through biomass macromolecular component behavior in torrefaction proposed by Nocquet et al. (2014). The use of extracted fractions from different woody and agricultural biomass species (ash-wood, beech, miscanthus, pine and wheat straw) instead of commercial compounds increased the accuracy of the prediction of solid kinetics in biomass torrefaction. The validation of the proposed mode! with 9 raw biomasses in torrefaction showed an accurate pre diction for woods, white the prediction for agricultural biomasses was acceptable.
1. Introduction
Torrefaction is a thermochemical conversion treatment suitable for dry biomasses, occurring between 200 and 300 to 350 °C under a default-oxygen atmosphere from several tens of minutes to 1 h. As a result, a torrefied solid is produced, whose properties are close to those of coal in terms of heating value, flowability, grindability and hydrophobicity. At the same time, gaseous products are released, including permanent gases, water and volatile species [ 1 ]. The proportion and the properties of the torrefied solid and the gaseous species produced are mainly dependent on temperature and time [2-4]. Furthermore, biomass main macromolecular
• Corresponding author. Université de Toulouse, IMT Mines Albi, RAPSODEE CNRS UMR-5302, Campus Jarlard, F-81013 Albi Cedex 09, France.
E-mail address: [email protected] (M. Gonzalez Martînez).
https: / /doi.org/ 10.1016/j.energy.2020.118451
composition in cellulose, hemicelluloses and lignin strongly im pacts the yield and the nature of the torrefaction products [3,5-7]. The influence of extractives and ash present in biomass still re mains controversial in the torrefaction temperature range [8-10]. While extractives are supposed to be mostly released below 200 °C [11.12], inorganic elements might catalyze thermochemical con version, but rather at higher temperatures corresponding to py rolysis or under gasification conditions [ 13-15 ].
Up to know, the proposed modelling schemes for pyrolysis and torrefaction were based on a single or several consecutive or par allel reactions, either for biomass or for its macromolecular com ponents [16-20]. A review of the models proposed in literature is provided in Table 1. Mild pyrolysis models were also considered as torrefaction temperature range partly overlaps the lower pyrolysis temperatures [21-23 ].
First pyrolysis models were focused on cellulose behavior [24,25]. They were based on a first formation step ofa called "active cellulose", whose nature still remains controversial [16]. A recent
Abbreviations E k ko R T ti,Ti mj(ti, Ti) wmf
activation energy O/mol) mean absolute error mean relative error
function minimized by least square fitting for the kinetic parameters determination
kinetic constant ( ç 1) pre-exponential factor ( ç 1)
ideal gas constant (8.314] mo1-1 K-1)
temperature (K)
: instantaneous values of time and temperature : instantaneous remaining solid mass ofj, where j can be replaced by e («cellulose»), e1 ( «cellulose
I» ), en ( «cellulose II»), DMSO
r ( «DMSO residue» ),
exp (experimental), Glu (glucan), H1
( «hemicelluloses 1 » ), H2 ( «hemicelluloses 2» ), HT
( «total hemicelluloses» ), L ( «lignin» ), mod (mode! prediction), rb (raw biomass). In ail cases mj(0 s,
273 K) = 1
: instantaneous mass fraction of j in k at t = 0, where j and k can be replaced by e («cellulose»), e1
( «cellulose I» ), en ( «cellulose II»), DMSO
r ( «DMSO
residue» ), Glu (glucan), H1 ( «hemicelluloses 1» ),
H2 ( «hemicelluloses 2» ), HT ( «total
hemicelluloses»), L («lignin»), rb (raw biomass) : weight-moisture-free basis
study has associated the activation of crystalline cellulose to the formation of reducing end groups in this polymer [26]. Shafizadeh and ehin proposed the first biomass pyrolysis mode! in 1977, which consisted ofa global scheme ofthree competitive parallel reactions, the main products being gas, liquids (tar) and char. Then, Koufo panos et al. modified this mode! by adding an intermediate mechanism about gas and condensable species formation [27].
Pyrolysis mode! development was typically based on lumped components, for which kinetic parameters were fitted with experimental data [16]. To do this, a first order reaction rate was typically supposed for a sequence of simultaneous and/or consec utive reactions of known or representative stoichiometry. The ki netic scheme of 2-succesive-step mode! developed by Di Blasi and Lanzetta [28] was one of the most frequently used. It is based on the competition between the formation of volatiles and solid products at each step of the reaction. Even if it was initially developed for xylan pyrolysis, it was then applied to biomass and other macro molecular components pyrolysis [7,29-32] and torrefaction [7,33]. Bates and Ghoniem proposed to calculate the volatile species composition for each reaction of the Di Blasi scheme for willow [34].
Kinetic pyrolysis models based on lumped components were progressively developed to increase the level of detail of the description of biomass transformation. In this sense, molecular based kinetic models were developed, in parallel to kinetic models based on lumped components with a higher level of complexity. Thanks to molecular-based models, kinetic parameters can be calculated for each chemical reaction involved in biomass transformation, which contributes in a deep description of the phenomena involved [35]. However, the main challenge to their development is achieving an accurate description of biomass composition, especially in the case of hemicelluloses. A simple but
effective description of beech transformation through torrefaction was proposed by Nocquet et al. [29]. His torrefaction mode! is based the additive behavior in torrefaction of commercial cellulose, xylan and lignin, and showed interesting results in predicting solid mass Joss and volatile species composition for beech torrefaction. Molecular-based models that can be applied for torrefaction were developed by Vinu and Broadbelt for fast pyrolysis cellulose and glucose-based carbohydrates [36], by Klein et al. for lignin fast pyrolysis [37] and biomass gasification [38], as well as by Norinaga et al. for cellulose [39], wood [40] and lignin pyrolysis [41 ]. Even if these models lead to a detailed description of the volatile species formed, they are based either on mode! molecules or on commer cial compounds [42].
Ranzi's group proposed a more detailed approach to pyrolysis (and therefore torrefaction) modelling through lumped stoichio metric reactions. Its mode! consists of a multicomponent mecha nism based on the superposition of the pyrolysis sub-mechanisms of cellulose, hemicellulose and lignin [ 43,44 ]. Solid kinetics, as well as the production of volatile species, were predicted for woods by considering their macromolecular and elemental composition [45,46]. However, the main limitations of Ranzi's mode! were considering xylan as representative of hemicelluloses, neglecting interactions between macromolecular components and inorganic elements in biomass, as they might play a raie at the pyrolysis temperature range, as well as secondary charring reactions [16]. Anca-eouce introduced some modifications to Ranzi's mode! [44,47,48], in particular the charring reactions description, which is especially relevant for slow processes as torrefaction, and to some extent the influence of the inorganic elements [16,49]. This modi fied mode! was applied by Anca-eouce et al. for torrefaction as well as slow and intermediate pyrolysis [ 49-51 ]. Later, Dussan et al. contributed to this mode! by detailing the transformation mecha nism of hemicelluloses and lignin. This description was based on five mode! compounds representing hemicelluloses main sugar units from woody, herbaceous and agricultural biomasses (xylan with acetyl and 4-methyl-d-glucuronic acid groups, arabinoxylan, xyloglucan, glucomannan and B-glucan). As a result, pentose and hexose-based sugar transformation mechanisms were described [52]. Lignin was defined through dimeric pseudo-components with phenolic functionalities based on two of the lignin base units, namely, p-hydroxyphenyl, guaiacyl and syringyl groups, linked through B-O-4' aryl ether bonds [53]. Dussan's lignin mode! accurately described heating rate and temperature influence on the product distribution, as well as monoaromatic content in the vol atile fraction.
The objective of the present work is to propose a kinetic mode! able to predict solid mass Joss in torrefaction as a function of the biomass type and its main macromolecular composition of cellu lose, hemicelluloses and lignin, as well as of the main operating conditions, namely time and temperature. This mode! aims to contribute in describing biomass through more representative cellulose, hemicelluloses and lignin fractions, which were extracted from ash-wood, beech, miscanthus, pine and wheat straw, instead of using commercial compounds. However, the detailed chemical reactions involved in the mechanisms of transformation ofbiomass through torrefaction were not assessed in this work. The experi mental results of torrefaction of extracted compounds were pre sented in the first part of this paper [54] and here kinetics are derived and employed to predict biomass torrefaction. The pro posed mode!, based on the additive experimental behavior of the extracted fractions in torrefaction, was compared to previous models in the literature and then validated with nine additional woody and agricultural biomass samples.
2. Mode) development
The proposed torrefaction mode! was based on the additivity of the behavior of cellulose, hemicelluloses and lignin in torrefaction, as suggested by Nocquet et al. [29]. The main difference with Nocquet's mode! is that extracted fractions from five biomasses were considered, instead of commercial compounds. Iwo levels were defined in the present mode! in function of the extracted fractions selected for representing biomass main macromolecular components.
2.1. First-level model
In this first-level mode!, the extracted fractions identified as« cellulose Il» (C1\ «hemicelluloses 1» (H
1) and «lignin» (L) were
considered as the representative main macromolecular compo nents for each biomass. The so-called "additive mode!" is based on the sum of the behavior of these extracted fractions, analyzed in the in part 1, weighted by the proportions of the corresponding main macromolecular components on each raw biomass (Eq. (1 ), Table 2).
mrb(ti, Ti)= Xc,rbmcII(ti, Ti)+ xH,rbmH, (ti, Ti)+ Xi,rbmi(ti, Ti)
Ti E [200, 300]°C
(1) Kinetics of solid transformation through torrefaction for the extracted fractions were described following the structure of the 2-succesive step kinetic mode! proposed by Di Blasi and Lanzetta (Eq.
(1 )).
V l V 2
k2/ k• /
/� k1 /� k, (2)
A(Sl - BIS) - C(S)
In this mode!, A, B and C represent solid species, while V1 and V2 corresponds to gaseous species. The kinetic constants of each chemical reaction are represented by k1, k2, k3 and �- It was sup
posed that ail reactions order is 1 and that the Arrhenius law governs the kinetics of the 4 reactions of the proposed scheme.
(3)
2.1.1. Kinetic parameter calculations
The kinetic parameters of the mode! were identified with Matlab® for each extracted fraction per biomass by least square fitting (Table 3). To do this, the function F representing the differ ence between the modelled and the experimental remaining solid mass (Eq. (4)) was minimized. The initialization was carried out with the values of the Nocquet's mode! parameters [29].
F = z]mmod(ti, Ti) - mexp(ti, Ti) 1 (4)
ti,Îi
Mean absolute (ea) and relative (er) errors, expressed as the average of the square of relative errors, were calculated (Eqs. (5) and (6)).
Mean ea= I:7=1 (mmod(ti, Ti) - mexp(ti, Ti) )n 2 (5)
L!'I-
(mm,d(t;,T;)-mexp(t;,T;)) 21-1 mexp(t,,T,)
Mean er =--�---� n (6)
Kinetic constants for the four reactions of the kinetic scheme of the torrefaction mode! were calculated for each extracted macro molecular component by considering a typical torrefaction tem perature range (200-300 °C) and a first order chemical reaction (ln k versus 1/T, presented in the Supplementary Material, Figures S1 to S4). The calculated kinetic constants for en fractions were more
impacted by the influence of temperature than those of H1 and L
fractions. This behavior was coherent with the enhanced degra dation of cellulose around 300 °C. Oppositely, the calculated kinetic constants for L fractions were not much affected by temperature, except in the case of pine. This behavior was in agreement with their low degradation at the torrefaction temperatures.
The obtained parameters remained generally the same order of magnitude to those proposed by Nocquet in the case ofbeech [29], except for lignin. The low mean absolute and relative errors ob tained when fitting the kinetic parameters indicated the correct fitting of the experimental data by the mode! (Table 3 ). However, in the case of en fractions, the mode! predicted a starting degradation
temperature of some degrees higher than that experimentally observed. Furthermore, the fitting of the mode! parameters was very sensitive to the initialization values. In the case ofH1 fractions,
the mode! was not able to accurately predict the slight solid mass Joss observed in the isothermal torrefaction step for miscanthus, pine and wheat straw. Anyhow the maximum relative error is of 0.3%, which is satisfactory.
In general, calculated activation energies were similar for ail reactions for en from ail species. This might imply that the mech
anism of cellulose decomposition did not depend on the biomass type. Activation energies for reaction 4 for ash-wood and pine en
fractions were higher than that of the other samples. This may suggest that a higher energy is required to break the chemical bonds involved in the transformations associated to this step for these species. This behavior seems coherent with the more resilient structure of woods compared to that of agricultural crops.
In the case ofH1 fractions, the obtained activation energies were
slightly lower for reaction 1 and similar for the other reactions. Furthermore, the highest variability was found for reaction 1. These results might indicate that hemicelluloses degradation would be governed by differences in sugar composition, which are depen dent on biomass type. Thus, this difference seemed to present a higher impact in the beginning of hemicelluloses transformation, which is in agreement with their degradation from low to inter mediate torrefaction temperatures.
Activation energies for L fractions appeared to be rather het erogeneous for ail reactions and samples. The low activation energy of reaction 2 for pine L fraction was remarkable but, according to the Arrhenius law, needs to be linked to the low k0 obtained and it
shows none dependence of temperature. A higher activation en ergy was obtained for reaction 4, which may be related to the low extent of the devolatilization of lignin in the torrefaction temper ature range.
The average activation energy per chemical reaction was calculated for ail extracted fractions (Fig. 1 ). For ail biomass species, this value was systematically higher for the en fraction, followed by
H1 fraction and L fraction. The intermediate steps (reactions 2 and
3) presented the highest difference in the activation energies. Globally, a low standard deviation was found for ail activation en ergies, except for en fractions in reaction 4 and for L fractions, as
Table 1
Review of the evolution of main pyrolysis models applicable to torrefaction. Name Kilzer, Broido Arseneau Shafizadeh, Chin Broido-Shafizadeh and Bradbury
rhumer and Mann (1981), then Kilzer-Broido (1988) Piskorz Modified Kilzer-Broido Mode! by Agrawal Koufopanos Broido-Shafizadeh (reviewed by Varhegyi) Di Blasi-Lanzetta Banyasz Year Scheme 1969 -1975 1971 1977 1979 1981 -1988 1988 1988 1989 1994 1997 2001 1volmilc. 1:1rs kl
ccllulo5;:c � clu,r + low molccular wcighl voJ:uilcs
k. �---> "C"+ .. --> "E"+ ... k,, �--->"V"+ ... Vol•tiles k
1,./
wCeUulo .. �"Active Ce1Jul01e" k• •
w..i WA Char + Glt(lf,
"'•
Wq Go� wg Cellulose Tor w. w, Cher w. '1 Active Cellulose � cellulose •� Hydroxyacetaldehyde Other LA�\IC Cellulose w ... ,..
� Char,gas.,.;z;:�
Levoglucosan 1"'ùJ Otiu:r sugan H20 Gas 1c' W' "Anhydrocollulose·••
••• w., 1c; Char w; 1c; Tors w· ...,_ �.----.. 1 _,t� kl k2Vir,gi n biomass lntc.rmedimo Gu$.C.S nnd volmifc.s
k• A
-
B/
Vl A____,..
B Il Active Cellulose \. <olluto"'..
� Char.sas, �,o Char k3 k,, k. k,, C+ ... D+ ... E+ ... volatile tar/
V2____,..
C✓
Hvdro,:vae-ebldehyde •� lntetme.diates � (l.MWCJ 11,1....,
fo�ldehyde .. CO � La,oglucos,n / Tor Ill-
,,;;:zl *' LcvoeJucos.:in / ar (&:} Char+ co2Process Cellulose pyrolysis Cellulose thermal decomposition T (°C) 370 200-270 Wood torrefaction/mild 300-400 pyrolysis Cellulose torrefaction/ 250-340 mild pyrolysis Cellulose torrefaction 300-400 Cellulose pyrolysis 300-800 Cellulose torrefaction 250-360 Biomass pyrolysis 100-440 Cellulose pyrolysis 220-370
Pyrolysis ( developed for 200-340 hemicelluloses) Cellulose pyrolysis 400-800 Ref. Used in [55,56] [57] [58] [59] [60] [61] [62] [33,7,28,63 -66] [67] [68,69] [27] [58] [23,65] [28] [70,29,65,71] [72]
Table 1 ( continued) Name Klinger Name Ranzi Nocquet Ranzi-Anca-Couce (RAC)
Year Scheme Process T (°C) Ref. Used in
2013 ku Unified mode! 260-425 [73,74] Year 2008 -2015 2014 2016
Biomoss -+ R1 +
L
ac,.;P1.1 torrefaction/pyrolysisScheme
Hemlcellulose � 0.4 HCA1 + 0.6HCA2
R�R7 "'RB
Vol. + Char XYL Vol. +Char
R9
LIG-C - Vol. +Char+ LIG-CC
L____. Vol. + Char R12
LIG•H � Vol. + LIG-OH R
�
14 FE2MACR
1- Vol. + Char+ LIG
R11 1 R13
LIG-0 - Vol.+ LIG-OH R15 Vol.+ Char
R1
Cellulose
Input data
Biornass macromolecularcomposition:
:.,. Cellulose
► Lignin
> Hemlcellulose: xylan + acetyl g:roups
Mode./ output
Yields versustime and temperature ► Torrefied solid
carbon dioxide, c:arbon monoxide, water, acetic acid, formaldehyde, formicacid, furfural, methanol
(1-x1) (Vol.+ Char),., + x1 (Vol. + Char)2, 1
R5 [(1 ·X5) (Vol. + Char),
5
1
Hemlcellulose - 0.4 + Xo (Vol.+ Charb· + 0.6 Hj CA2 R8
R9
LIG-C- Vol.+Char+ LIG-CC
'--R12
{1-Xa) (Vol.+ Char),,8 + X8 (Vol. + Char)2,8 (1 ·X12) (Vol.+ Char)1,12 + x,2 (Vol. + Char)v2
LIG-H� Vol.+ LIG-OH [(1·X13) [y,3•FE2MACR
+]
1---,. Vol.+ Char+ (1-fo)'(Vol. + Char )1,1Jl
R11 1 R13 + X13 (Vol. + Char}i 13
LIG-0- Vol.+ LIG-OH
• Adapted from pyrolysis mode/ proposed by Ranzi (2008)
Process Pyrolysis T(°C) Ref. 150 [125 -450 -127,129] Torrefaction 200 -300 [29] Torrefaction 150 -450 [75]
Table 1 ( continued )
Name Year Scheme Process T (°C) Ref.
Dussan 2017
2018
Detailed mode! for hexose-based and pentose-based sugars in hemicelluloses pyrolysis ( details Pyrolysis 150 [ 52]
in [521) -450
Dussan Detailed mode! for lignin pyrolysis based on P-0-4' linked dimers of lignin base units ( details in Pyrolysis 150 [ 53]
[531) -450
2.2. Second-level mode/
New assumptions were proposed in a second level of the tor refaction mode! to improve the representation ofbiomass behavior in torrefaction through a more accurate description of the macro molecular component behavior. This was achieved by:
• weighting the hemicelluloses contribution by taking into account « hemicelluloses 1» (H1) and «hemicelluloses 2» (H2)
in a new « total hemicelluloses » fraction (Hr).
Consequently, and according to the extraction procedure, the proportions of C1 and H
1 fractions in the «DMSO residue » fraction
(DMSOr) had to be estimated, as well as the ratio H1/H2 per biomass • replacing en fraction kinetics by « cellulose I» (C1) to preserve
the allomorphic structure I of native cellulose in biomass;
Table 2
Biomass main macromolecular composition as considered for the modelling of the behavior of the five raw biomasses in torrefaction.
Macromolecular component Cellulose Hemicelluloses Extracted fractions considered for the torrefaction mode!
1 st level mode! en H
1
2nd level mode! C1 HT
Raw biomass composition Ash-wood Beech Miscanthus Lignin L L 1000 100 0 � 10 1 ■ «cellulose II» ■ «hemicelluloses 1» ■«lignin»
-
-
rf ,.-
...
-r+d
..
rl r2 r3 r4 169 279 330 249 82 122 127 133 49 46 37 109 Pine Wheat straw %wmf 43.7 44.3 51.4 41.3 45.8 24.9 27.2 25.7 29.3 29.1 31.4 28.4 22.9 29.425.0 Fig. 1. Average activation energy (kJ/mol) per chemical reaction of en, H1 and L frac
tions in torrefaction. Table3
Kinetic parameters of 2-succesive step kinetic mode! calculated for extracted fractions. «cellulose II» (Cn)
ash-wood beech miscanthus pine wheat straw
ko(çl) E (kj/mol) ko (çl) E (kj/mol) ko (çl) E (kj/mol) ko(çl) E (kj/mol) ko(ç1) E (kj/mol)
r1 (A- B) 1.32-1012 167 1.32-1012 170 1.32-1012 170 1.32-1012 171 1.32-1012 167 r2 (A- V1) 9.10•1021 276 1.06·1020 290 1.06·1021 278 7.50·1021 278 1.06· 1021 274 r3 (B- C) 9.30-1030 331 2.10-1030 331 2.10-1030 327 9.30-1030 348 2.10-1030 312 r4 (B- V2) 3.09-1018 333 3.09-1018 197 3.09-1018 195 3.09-1018 333 3.09·1018 185 Mean Ba 8.s-10-4 1.0.10-4 5.4. 10-5 3.1 • 10-4 1.6, 10-4 Meane, 0.120% 0.015% 0.008% 0.038% 0.026% «hemicelluloses 1» (H1)
ash-wood beech miscanthus pine wheat straw
ko (çl) E (kj/mol) ko(çl) E (kj/mol) ko(çl) E (kj/mol) ko(çl) E (kj/mol) ko(ç1) E (kj/mol)
r1 (A- B) 7.02-105 91 7.09-105 88 1.15· 106 71 1.21 · 106 75 6.36-105 87 r2 (A- V1) 1.71•109 123 1.66·109 121 1.67•109 121 1.67•109 121 1.59· 109 124 r3 (B- C) 6.83·108 128 7.09·108 125 7.21 • 108 126 7.20·108 126 6.63·108 129 r4 (B- V2) 2.44•109 139 2.46•109 133 2.50·109 127 2.S0· 109 128 2.31 • 109 137 Mean Ba 3.1 .10-5 4.4. 10-5 2.1.10-4 1.5.10-4 2.8-10-5 Meaner 0.005% 0.025% 0.301% 0.123% 0.013% «lignin» (L)
ash-wood beech miscanthus pine wheat straw
ko(çl) E (kj/mol) ko (çl) E (kj/mol) ko (çl) E (kj/mol) ko (çl) E (kj/mol) ko(ç1) E (kj/mol)
r1 (A- B) 78 54 7.2 43 259 54 211 63 0.8 32 r2 (A- V1) 33 54 35.3 54 861 65 1.67•10-4 0.02 113 58 r3 (B- C) 21 36 5 36 2.2 38 32 36 0.1 37 r4 (B- V2) 3.38•104 111 3.06•104 131 3.42• 104 90 3.39•104 93 2.01•104 120 Mean Ba 1.1 • 10-5 <l.0-10-5 <l.0-10-5 1.1 • 10-• <l.0-10-5 Meane, 0.001% <0.001% <0.001% 0.019% 0.002%
-
---
-
---
--
---
-
-
-
---
-
-FMH:\lrl
Rawbîomass ' 1
1 « Cellulose Il}) Extractcd fraction , « DMSO residue »
ci
ci
H1ci
1 1 1 1 1 • DMso:/ Ugnin NaOH DMSOr L NaClo,_,...,,• H2 H1/
H2 H1---
Î
L.\
(< llemicelluloses 2 » \ ·---• DMSO residue Flemicelluloses 1 Hemicelluloses 2 Cellulose IlL
•
H2 Dioxari' Other macromolecular componentsAœlone/
H,O (ASE)
/
L
« Hemicelluloses 1 >l Cellulose 1Sxtmctives Ash C' E A
E
LigninA
•
E
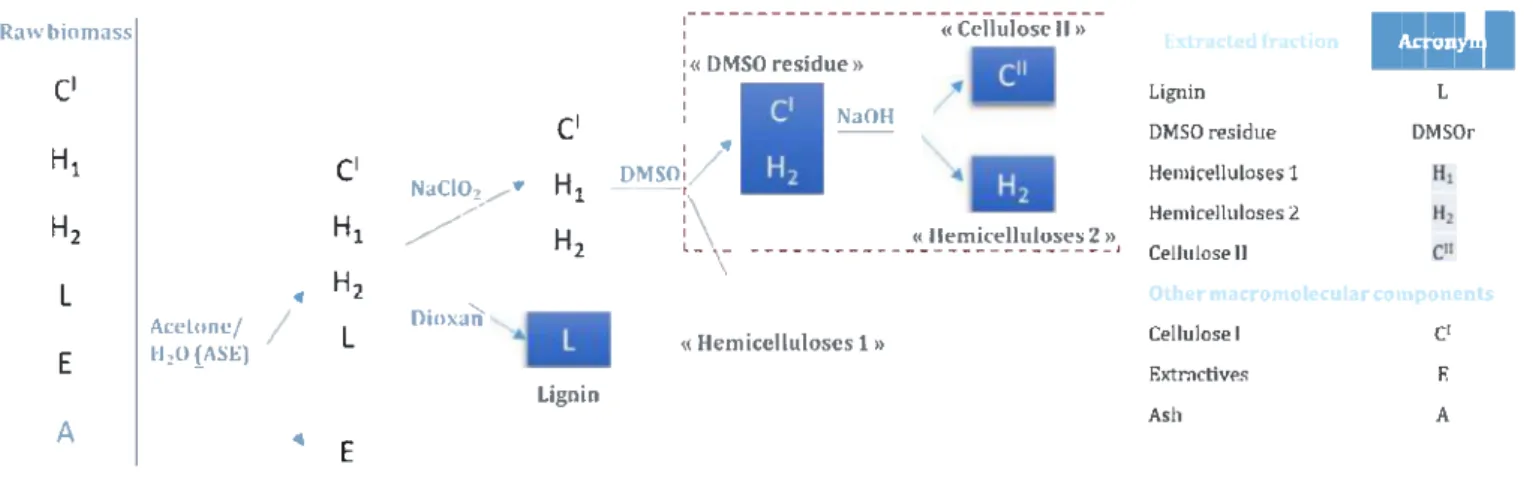
Fig. 2. Extraction procedure sub-system for the sugar mass balance of the DMSOr fraction ( dashed line ). (see Fig. 2 and part 1). This was performed thanks to sugar mass
balances carried out on the extracted fractions composed of polysaccharides.
2.2.1. Sugar mass balances
2.2.1.1. Composition of the DMSOr fraction. By considering the extraction procedure scheme, a sub-system including « DMSO
residue» (DMSOr), en and H
2 fractions was defined (Fig. 2). Sugar
mass balances were based on the composition of major sugars for each fraction, namely glucose and xylose [76]. The higher uncer tainty in the determination of minor sugars, namely mannose, arabinose and galactose, justified their discard. Furthermore, acetyl group content was not considered as they are partially destroyed due to the alkaline treatment.
In a mass-fraction basis, DMSOr fraction composition per biomass corresponded to:
1
=
Xcll ,DMSO,+
Xtt, ,DMSO, (7)Considering sugar composition of each fraction (Part 1, Table 1) and for an individual sugar (glucose, Glu, or xylose, Xyl) in DMSOr fraction, sugar mass balance of this fraction was:
Xc1u,DMSO, = Xc1u,CII XcI! ,DMSO,
+
Xc1u,H2 Xtt, ,DMSO, (8)Table 4
Composition of the DMSOr fraction in C1 and H
2 fractions calculated by glucose and
xylose sugar mass balances.
C1 mass fraction in DMSOr fraction (xc',DMSO, =Xc•,DMSo,)
Ash-wood Beech Miscanthus Pine Wheat straw
Monosugar %wmf
Glucose (Glu) 74,4 75.3 74.1 78.0 76.1
Xylose (Xyl) 80.3 79.7 86.2 79.8 88,4
Average 77.3 77.5 80.1 78.9 82.3
Absolute error (ea) 5.9 4,4 12.1 1.8 12.3
Relative error (e,) 8.1% 5.9% 16.4% 2.3% 16.1% H2 mass fraction in DMSOr fraction (xH,,DMso,)
Ash-wood Beech Miscanthus Pine Wheat straw
Monosugar %wmf
Glucose (Glu) 25.6 24.7 25.9 22.0 23.9
Xylose (Xyl) 19.7 20.3 13.8 20.2 11.6
Average 22.7 22.5 19.9 21.1 17.7
Absolute error (ea) 5,9 4,4 12,1 1.8 12.3
Relative error (e,) 23.3% 18.1% 46.9% 8.0% 51.4%
C1 and en fractions differed in structure arrangement, which
affected the allomorphic structure (1 or II). However, they are equivalent in terms of mass percentage in DMSOr and sugar composition:
Xc1 ,DMSO,
=
Xcll ,DMSO, (9)By combining Eqs. (7)-(9), Xc',DMso and xH,,DMso could be
calculated as:
X I C ,DMSO, -- X Il C ,DMSO, -- Xc1u,DMSO, - Xc1u,H2 X Glu,c'1 - Glu,H2 X Xtt2,DMSO, = 1 -Xc1,DMSO,
(10) (11) DMSOr fraction composition in C1 and H
2 fractions per biomass
was calculated through Eqs. (10) and (11 ), by considering the sugar content on glucose or xylose (Part 1, Table 1 ). The average of bath results per biomass was indicated and the relative error between them was calculated (Table 4). It is noteworthy that a considerable error rate was expected, due to the difficulties to obtain an accurate sugar composition determination.
The most significant difference in the DMSOr composition estimated from glucose and xylose was obtained for miscanthus and wheat straw. This behavior is in agreement with the higher heterogeneity of agricultural biomasses, which leads to a higher uncertainty in their sugar composition determination. Indeed, the measurement was carried out as follows: firstly, the total poly saccharide content was determined for each biomass; then, the distinction was made between cellulose composition, only based on glucose sugar, and hemicelluloses composition, composed of glucose and other sugars. The distribution of the glucose content between cellulose and hemicelluloses was based on typical ratios of mannose/glucose reported in the literature (typically, they corre spond to 1.6 for deciduous wood and to 1.0 for coniferous wood) [77,78]. As the sugar distribution of agricultural biomasses and herbaceous crop hemicelluloses is relatively poorly known, the 1.0 ratio was supposed. Furthermore, a higher error was associated to the determination of minor sugars. Despite these uncertainties, the composition of the DMSOr fraction was around 80% C1 and 20% H
2
for the five biomasses.
2.2.1.2. Composition of total hemicelluloses. The composition of H1 and H2 fractions in total hemicelluloses (Hr) in biomass needed to
be determined. To do this, the presence of glucose in ail poly saccharide fractions would suggest to make a global polysaccharide
balance, including ail cellulose- and hemicellulose-based fractions. However, the results of this global balance would be strongly impacted by the uncertainty in sugar composition determination. A second option is to follow a similar procedure to that previously presented for determining DMSOr composition because ail cellu lose from raw biomass was preserved in this fraction.
Cellulose and hemicelluloses mass fractions for each biomass were firstly estimated from raw biomass composition, reported in Ref. [76]. Then, DMSOr mass fraction in raw biomass was calculated:
XDMSO,,rb Xen,DMSO, Xe,rb
H2 mass fraction in raw biomass was estimated by difference:
xH,,rb =XDMSO,,rb -Xe,rb
H1 mass fraction could be derived as follows:
(12)
(13)
(14) The hemicelluloses composition in terms of H1 and H2 mass
fractions was then calculated (Table 5):
(15) (16) These results revealed that none of the hemicellulose fractions was negligible, which was coherent with their different sugar composition. Subsequently, it could be stated that H1 and H2 are
complementary fractions to describe hemicelluloses in biomass. The calculated proportions of H1 and H2 fractions in raw
biomass (Table 5) were checked by recalculating raw biomass glucose content (Eq. (17)) and by comparing the obtained values to those experimentally measured (Table 6). The relative error be tween measured and calculated values for glucose was around 15.0% wmf, with the higher values again for agricultural biomasses. The uncertainty in sugar content determination led to consider this relative error as low and thus to accept the estimated total hemi celluloses composition.
Xc1u, rb = Xc1u,H1 XH1 ,rb
+
Xc/u,H2 xH,,rb+
XcIu,e Xe,rb (17)To sum up, hemicelluloses composition determination was validated by the sugar mass balances, with the limitations of the uncertainty associated to the sugar content determination. By considering both H1 and H2 fractions per raw biomass, hemi
celluloses representation is expected to be completed. The obtained results justified that these two fractions need to be considered in the total hemicellulose description, at least in terms of solid kinetics.
Table 5
2.2.2. Reconstruction of the complementary fractions
2.2.2.1. «Cellulose I» (CI). «Cellulose I» (CI) behavior in torrefaction
was reconstructed by considering the composition of DMSOr fraction:
mDMSO, (ti, Ti) = Xe',DMSO, me, (ti, Ti)+ XH,,DMSO, mH, (ti, Ti) TiE[200,300]°C
(18) cI and en fractions behavior in torrefaction were compared
(Fig. 3. The reconstructed curves, including interactions, were directly implemented in the second-level mode!. The relative error between remaining solid mass estimated through cI fractions and
the experimental behavior of en fractions in TGA-GC/MS was
calculated and represented in the Supplementary Material (Figure SS).
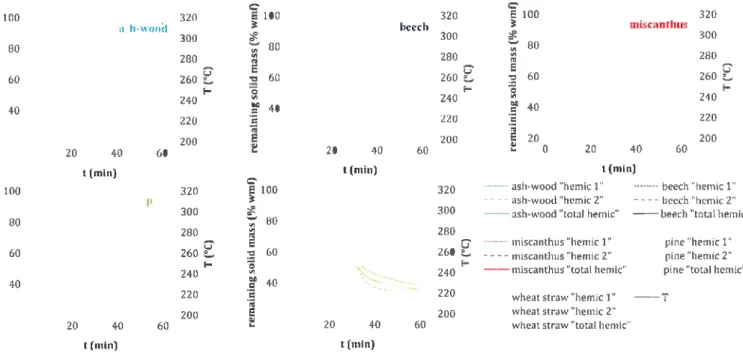
2.2.2.2. «Total hemicel/u/oses» (Hr). «Total hemicelluloses» (Hr) fraction behavior in torrefaction was reconstructed for each biomass through a weighted sum of the contributions of the kinetic behavior of H1 and H2 fractions according to their proportions per
biomass (Table 5). The Hr fraction remaining solid mass at a given time and temperature was:
mH,(ti, Ti)= XH,,Hr mH, (ti, Ti) +xH,,Hr mH,(ti, Ti)
TiE[200,300]°C (19)
The Hr fraction behavior in torrefaction was reconstructed for each raw biomass (Fig. 4).
The main difference in the behavior of both hemicellulose fractions was found in the dynamic step, which corresponds to the major degradation of this fraction and whose extent depended on sugar composition. Solid mass loss was faster for ail H1 fractions
except for that of pine. This can be explained by its higher composition in mannose, whose degradation is slower than that of xylose, which is the major sugar of the other H1 fractions. The
slower degradation of wheat straw H2 fractions compared to H1
fractions would be due to the considerable mannose content ofthis fraction. Then, the behavior of both hemicellulose fractions for ail biomasses was nearly equivalent in the isothermal step, except in the case of the wheat straw H2 fraction, also presumably due to its high mannose content.
2.2.3. Representation of the mode/
The reconstructed fractions cI and Hr were integrated in the
additive mode! so as to improve biomass behavior representation. The proportions of cellulose (CI), hemicelluloses (Hr) and lignin (L)
for this second-level of the mode! were indicated in Table 2. Accordingly, the mode! resulted in:
m'rb(ti, Ti) = Xe,rb me, (ti, Ti)+ xH,,rb mH,(ti, Ti)+ xL,rb mL(ti, Ti) TiE[200,300]°C
(20) As for the first-level mode!, the structure of the 2-successive step kinetic mode! of Di Blasi and Lanzetta was selected. Kinetic Composition of total hemicelluloses in raw biomass related to the two hemicellulose extracted fractions (H1 and H2).
total « hemicelluloses» (Hr) fraction composition
Ash-wood Beech Miscanthus Pine Wheat straw
%wmf
«hemicelluloses 1» (H1), x(H1,Hr) 47.4 34.9 53.5 33.9 47.4
Table 6
Total glucose in raw biomass estimated by the composition of the extracted fractions. Glucose, Xciu,rb
Ash-wood Beech Miscanthus Pine Wheat straw
%wmf
Calculated Sugar mass balances 39.7 44.7 40.4 47.4 41.0
Measured Reported in [76] 38.6 39.5 42.9 46.9 35.8
Absolute error (ea) 1.1 5.2 2.5 0.5 5.2
Relative error (e,) 2.7% 13.2% 5.7% 1.1% 14.3%
C' C' C
e
120 320 E 120 320 E 120 320� lL�h-\\OOd :t �
� 300 � 300 � 300
e... 100
"'
e.., 100 ., e...100 "'280 "' 280 "' 280
"'
..
Ë
..
e
80 260E
80 260E
E 80 260E
::! ::! :i ë ë 1-- 0 1--"' 60 240 "' 60 240 "' 60 240CAi a.o CAi
C C
"
:s
..
220 "ë 40 220 'ë 40 220 40...
..
E 200 E 200e
200 Cl !:: 0 20 40 60..
0 20 40 60..
0 20 40 60..
l (min) t (min) t (min)
C' C'
p20 Jlinr 320
e
� 120 320 ash•wood "cellulos I" --beech "cellulose I"� 300 � 300
e...100 e...100 ash-wood "cellulose li" --- -beech "cellulose Il"
� 280
"'
"'
..
2808 80
260
E
::! E 80 260E
-- ----miscanthus "cellulose I" miscanthus "cellulose Il" pine pine ""celcellulolulose l" se Il"0 1- 0
1-"' 60 240 "' 60 240
CAi
.s
=
=
wheat straw "cellulose I"220 'ë 40 220 wheat straw "cellulose 11"
·; 8 40
-�
200 200
0 20 40 60 Cl 0 20 40 60
..
..
--ît (min) t (min)
Fig. 3. Remaining solid mass in function of temperature and time of c" fractions and of the reconstructed C1 fraction in torrefaction in TGA-GC/MS.
C' C' C' � 100 320 � 100 320 � 100 320 a h-wood becch miscanl'lms
è:
300l
300l
300 80 80 BO "' "' "' 280 "'.,
280.,
..
280 8 260E
e
260E
E 260E
� 60-=
60 :':? 60 :::, 1- 0 1-0 "' 1- 0 240 ., 240.,
240...
a.o CAi 40 40"ê
40 .E Cl 220 220·a
220 C,a
..
,ii E 200 8 zoo E 20 200 !:: 20 40 60 !:: 20 40 60 !:: 0 20 40 60t (min) t (min) t(min)
C' C' ---ash-wood "hernie l" ---··· beech "hernie l"
� 100 320 � 100 320
I' - - - -ash-wood "hemic 2" - - - - beech "hernie 2"
l
300 � ,;; 300 --ash-wood "total hernie" --beech "total hernie""' 80 "' 80
; 280 � 280
e
260E
E260
E
·---· miseanthus "hernie l" pine "hernie 1""t:I 60 ::! 60 - - - -rniscanthus "hem le 2" pine "hernie 2"
:.::l !-- 0
1-0 --miseanthus "total hemic'" pine "total hernie"
"' 240 "'
� 240
40 bit 40
C
"
·;;; 220 ·2 220 wheat straw "hernie l" --T
-�
·; wheat straw "hemic 2"e
200 E 20020 40 60 Cl
..
20 40 60 wheat straw "total hernie"t (min) t (min)
Table 7
Kinetic parameters of the 2-succesive step kinetic mode! calculated for HT fractions. «Total hemicelluloses» (HT)
ash-wood beech miscanthus pine wheat straw
ko (ç1) E (kj/mol) ko (s-1) E (kj/mol) ko (s-1) E (kj/mol) ko (s-1) E (kj/mol) ko(ç1) E (kj/mol)
r, (A-> B) 1.15•106 69 5.41 • 105 72 6.98•105 82 6.29•105 73 6.43•105 87 r2 (A-> V1) 1.67-109 113 1.67-109 116 1. 17•109 123 1.67-109 118 1.59-109 125 r3 (B--> C) 7.21 • 108 124 6.40•108 125 6.83·108 127 6.63·108 124 6.63·108 128 r4 (B--> V2) 2.50·109 126 2.46•109 127 2.44•109 129 2.47•109 127 2.31 • 109 134 Mean Ea 3.5.10-4 5.8-10-4 1.8-10-4 2.8-10-4 2.6-10-5 Meaner 0.189% 0.294% 0.111% 0.157% 0.014% C' C' C' E 100 320 � 100 320
i
100 3203 nsh-wootl beech miscanthus
� 300 � 300 ,:.':: 300
e.,
e...
e.,� 80 280 "' "' 80 280 � 80 280 c,; c,; c,; E 260
E
E 260E
a
;, 260E
"C-=
-=
� ... ,. '§ � !- == '•':::� E-E- 0 "' 60 240 "' 60 240 .,, 60 240 0J) 0J) 0J)·--
�
C C C,;;
220 13 220·a
220 ';;)e
-�
·;a 40 200 40 200a
40 200...
0 20 40 60 � 0 20 40 60 ::! 0 20 40 60...
t (min) t (min) t(min)
C' C'
e
100 320e
100 320 ash-wood (exp) pine (exp)3 J!Îllf 3
� 300 ,:.':: 300 - - --ash-wood (mod 1) pine (mod l)
e...
"'e...
"' ···••· ash-wood (mod 2) pine (mod 2)80 280 "' 80 280
c,; c,;
e
260E
e
250E
--beech (exp) wheatstraw (exp):':!
-=
�
...
�..
... !- - - - -beech (mod 1) wheat straw (mod 1)60 240 "' 60 240 ·--beech (mod 2) wheat straw (mod 2)
0J) CIi .!: C C 220 'ë 220
l
,;; --miscanthus (exp) --T 200e
200 -- --miscanthus (mod 1)..
.... 20 40 60...
...
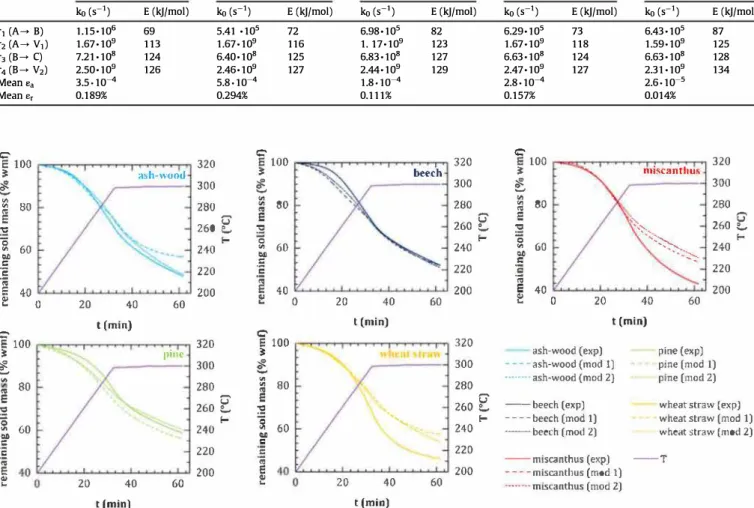
20 40 60 ·--·· miscanthus ( mod Z) t (min) t (min)Fig. 5. Comparison model-experiments: remaining solid mass in function of temperature and time for torrefaction of raw biomass in TGA-GC/MS (exp) and simulated values obtained through first-level mode! (mod 1) and second-level mode! (mod 2).
parameters were recalculated for Hr (Table 7), white they were kept unchanged for L and C1 fractions. The estimated behavior of C1
fraction could not be adjusted to the Di Blasi-Lanzetta mode! structure. As a result, the calculated parameters for cil fractions
were considered, due to the simitar behavior of both fractions and their limited degradation in torrefaction (Fig. 3).
The pre-exponential factor of the first reaction (A ... B, ko,1) was the main difference observed between the kinetic parameters calculated for the Hr and H1 fractions. The relative error in the
parameters determination was higher for Hr fractions from decid uous wood, white a lower error was found for miscanthus Hr fraction. The different sugar composition and kinetic behavior in torrefaction indicate that both hemicellulose fractions are com plementary to represent hemicellulose behavior in torrefaction.
3. Results and discussion 3.1. Madel performances
The modelled behaviors of each biomass with the first- and second-level mode! in torrefaction were compared to the experi mental results (Fig. 5). The relative error between remaining solid mass estimated through first- and second-level models was
compared to that experimentally obtained for raw biomass in TGA GC/MS in the Supplementary Material (Figure S6). This approach is based on the hypothesis that the initial macromolecular composi tion of biomass corresponds to the ratio between the extracted fractions, which allows to reconstruct raw biomass transformation through torrefaction. This implies that:
• Extraction procedure was supposed not to modify the macro components in the raw material and to give a good represen tation of the fractions from raw biomass.
• According to the first-level mode! assumptions, cil, H 1 and L
extracted fractions were identified to be representative of cel lulose, hemicelluloses and lignin in biomass, respectively. • According to the second-level mode! assumptions, C1, Hr and L
extracted fractions were supposed to be representative of cel lulose, hemicelluloses and lignin in biomass, respectively. Ki netics of hemicelluloses were changed by using Hr in this case, white cellulose kinetics were kept unchanged.
• Extractives were supposed to be released below 200 °C, so they did not participate in biomass torrefaction.
• Inorganic elements were supposed to be inert in the torrefaction temperature range.
Mode! prediction is obviously dependent on the operating conditions and on biomass type. First-level mode! showed an ac curate remaining solid mass prediction in the non-isothermal step untit 33.3 min for ash-wood, miscanthus and wheat straw. In the case of pine, a constant deviation of 5% of the modelled curve compared to the experimental results was found from intermediate temperatures to the end of the isothermal step. An overestimation of the remaining solid mass for miscanthus and wheat straw was observed along the isothermal step. The observed deviation in the mode! predictions was not identical for biomasses from the same famity, such as ash-wood and beech.
The second-level mode! lead to a more accurate description of the behavior of ail biomass samples in the non-isothermal torre faction. Thus, the underestimation of the remaining solid mass by the first-level mode! in this step was slightly improved for beech and significantly for pine. Furthermore, the prediction of the mode! in the isothermal step was also improved for ash-wood and pine. This better fitting of the second-level mode! may be explained by the fractions considered on its construction. As hemicelluloses are mostly degraded in the torrefaction temperature range, the consideration of Hr fractions may lead to a more accurate description of their behavior. The second-level mode! leads to ac curate predictions for woody biomass. However, only few changes in the prediction were observed for wheat straw and miscanthus in the two levels of the mode!. Deviations are mainly present in the isothermal region for these non-woody biomasses. This might correspond to the fact that their structure is poorly known, which leads to a higher uncertainty in their macromolecular and sugar characterization and, consequently, in their modelling [78,79]. Furthermore, the structure of agricultural biomasses may be more labile face to the thermal degradation, which may lead to an easier degradable structure at high torrefaction temperatures. Another hypothesis for explaining the deviation of the torrefaction mode! for agricultural biomasses and herbaceous crops at 300 °C could be that the extractives and ash content play a raie on this prediction, at least at 300 °C. In this sense, a simitar high extractives content was measured for ash-wood (10.0 %wmf), miscanthus (8.6 %wmf) and pine (8.4 %wmf) [76]; however, a different deviation of the mode! was observed for these species. The same observation was found for the ash content, as miscanthus presented a simitar ash content to that of ash-wood, around 2.8%wmf, white wheat straw ash content was much higher, 8.3%wmf. According to these results, the rela tionship between the consideration of extractives and ash content in the torrefaction mode! and the accuracy of its prediction would be non-trivial.
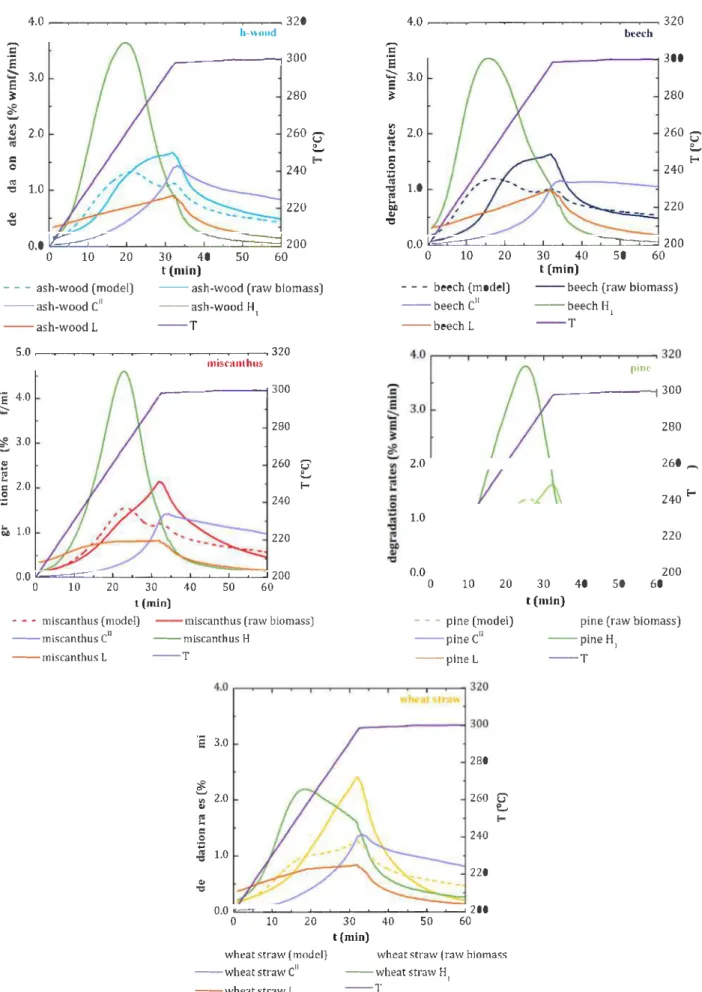
3.2. Analysis of the extracted fraction behaviour
The results of the torrefaction additive mode! were compared to the experimental data obtained with the raw biomass and the extracted fractions. The comparison of the degradation rate profiles was presented for a better identification of the differences between the solid kinetic profiles (Fig. 6).
The first maximum in the degradation rate profiles of the mix tures corresponded to the behavior of the H1 fractions, except for
pine. The temperature of this maximum of degradation rate was in agreement with those obtained for H1 fractions. The second
maximum, close to 300 °C, principally corresponded to the behavior of the en fraction. Cellulose is mostly degraded at tem
peratures close to and above 300 °C, so in this case its degradation was interrupted at 300 °c. The impact of lignin degradation on bath maxima was low, as it is only slightly and progressively degraded in this temperature range ( the maximum degradation rates measured for the extracted fraction were around 1.0 %wmf min-1). These maxima in the degradation rate profiles were reproduced in the
additive mode! behavior.
These results show that the first stage (non-isotherm) is domi nated by hemicellulose decomposition, white the second (isotherm) is dominated by cellulose decomposition. The bigger deviations are present in the second stage for non-woody biomass, with commonly a higher content of extractives or inorganics which could explain these differences. Extractives could be as well released in this temperature range [ 48 ], although their main release is commonly at lower temperatures or even higher temperatures. Regarding inorganics, they could mainly catalyze cellulose decomposition, which is not detected in the kinetics of en or C1
cellulose due the samples are previously leached. It was shown in literature that during pyrolysis, when the content of inorganics was decreased through leaching or increased through doping, the po sition of the shoulder peak related to hemicellulose decomposition is barely affected, white the peak related to cellulose and specially the tait related to lignin take place at lower temperatures with a higher inorganic content [80].
The kinetics derived for beech wood components were also employed to describe torrefaction of the other biomasses (ash wood, pine, miscanthus and wheat straw). The results, which were presented in the Supplementary Material, Figure S7, showed that the use of the kinetics derived from each component led to generally better results, especially in the first stage (non isothermal) of miscanthus and straw, and to a lower extent for pine. The differences for ash-wood predictions using beech kinetics are the lowest, which can be justified as bath are hardwood species. Differences between predictions and experiments are still present mainly in the second stage (isothermal) of miscanthus and wheat straw, and to a lower extent for pine during the whole conversion. 3.3. Comparison to other models in the literature
The prediction of biomass behavior in torrefaction by the pro posed additive mode! based on extracted fractions was compared to previous torrefaction models in the literature by Nocquet [29] and Ranzi-Anca-Couce [51] (Fig. 7). In the first case, Nocquet's mode! was applied for each raw biomass by taking into account its composition on cellulose, hemicelluloses and lignin. The difference between the Nocquet mode! and the proposed additive mode! in this work is that the one of Nocquet is based on commercial com pounds. In the second case, the Ranzi-Anca-Couce (RAC) mode! with the proposed biomass composition for softwood in Refs. [51] was applied to pine, white that for hardwood was considered for the other biomass samples, including agricultural and herbaceous crops. The adjustable parameter of this mode!, representing the amount of the initial fragmentation primary products, was considered to be of 0.2 as in Ref. [ 51] for representing TGA condi tions. This value supposes a limited charring, despite the low heating rates and temperatures, due to the low initial masses in TGA experiments.
The benefits of considering extracted macromolecular compo nents instead of commercial ones were revealed through the comparison to the Nocquet's mode!. In the proposed new mode! the specific composition of hemicelluloses, cellulose and lignin could be considered, white in the case of the Nocquet's mode! these components were described through commercial xylan, Avice! cellulose and dioxan lignin, respectively. The prediction of the Nocquet's mode! in the isothermal step was slightly better for miscanthus and wheat straw in terms of absolute value of the remaining solid mass. However, the modelled profile of remaining solid mass was different to that of the experimental results, white the proposed nove! torrefaction mode! appeared to better fit them. The predictions of Nocquet generally lead to a significantly slower conversion in the first stage (non-isothermal) and a faster
4.0 ----�-��---� 320 ê . Ë
î
3.0 3:è:
� 2.0 �=
0 � 1.0 <li ,:j h-nood ,---j300 280 260 Û :!.., E-240 220 o.o 1t;;;d:::::=.----1___._----1.��:::::::��:;j 2 oo 0 10 20 30 40 50 60 t(min)- - - ash-wood (mode!) --ash-wood (raw blomass)
--ash-wood
c"
--ash-wood H1 --ash-wood L --T 5.0 ---�---� 320 "ë 4.0 ;::-� 3.0 � f C 2.0 0 ·o Qi 1,0 miscanlbus ---1300 280 260 E E-240 220 0 .0 ====:;_---'-�-L__�--'--'---'-�= 200 0 10 20 30 40 50 60 t (min) --- miscanthus (mode!) --miscanthus c" --mîscanthus L--miscanthus (raw biomass)
--miscanthus H --T
'ë
3.0 -R e.., ., 2.0.,
!! § ·.:: � 1.0...
"Cl'.s
8 4.0 --�---�---�---�� beech :;:;. 3.0 � 320 300 280 "' � 2.0 260 ,..,1:.
'Il...
=
0 ·.:: 240 � 1.0 � 0.IJ 220 <li,,
0.0�
�::r::::
=-
_L_�_J,_�__J__
-=:::r:
::::i::
�
200 0 10 20 30 40 50 60 t(min)- - - beech (mode!) --beech (raw biomass)
--beechC11 --beech H1 --beechL --T pinc ,---1300 280 E-2.0 260 ,.., 1.0 0.0 0 10 20 - - - plne (mode!) --pinec" --ptneL 280 260 ûe.., E-240 220 240 E-220 200 30 40 50 60 t (min)
plne (raw biomass) --pineH,
--T
0.0 -==--'---'--'----'----'-�'---'--'---'-..__...J 2 00
0 10 20 30 40 50 60
wheat �traw (model)
--wheat straw
c"
--wheatstraw Lt (min)
wheat �traw (raw biomas�
--wheatstraw Hl --T
Fig. 6. Degradation rates in function of time and temperature obtained for torrefaction in TGA-GC/MS of raw biomasses, c", H1 and L fractions, compared to simulated values
100 320 100 320 100 320 C E � asb-wood 300
"
i
300 3: 300!
80!
80t
80,
,
280..
280 :::: 280 ::::-
,
..
"'"
"' 5 60 260 E 60 260E
E 60 260 '.!= � '.!= ] 1- ] 240 240 1-..
240 40..
40 40 220-=
=
220c
;;; 220 .;..
ë 200 5 200 f E 200 � 20 40 60 f 20 40 60 zo 40 60t (min} t (min) f (min)
100 320 100 320 a,b-wood [exp) plne ( Pl
t•int C r •:<h·wood (mod 1) pin (mod 1)
E �
3: 300 00 ash-wood (Nocquei) plne (Nocquet)
!
80!
BO -··-ash-wood (RAC) -·-·· plne (RAC):::: 280
::
280"
"
--beech(expJ whoat traw (oxp)E 60
-� ...
....
260 û E 60 260E
- - - oooch (mo<I 1) whear sir.iw (rnnd 1):::
�240 1-
a
240 1- • · · • • bcoch (Nocquet) wheat straw ( ocquct)� 40
..
40 -··- beech (RAC) -··-·· whea otnlw (RACJ220 e 220
i:
.; --mlsamthus (exp) --T
E 200 E 20 200 - - - ml=Inthus (mad 1)
f 20 40 60 � 0 20 40 60 • · · · mi5Cllnthus ( ocqu •tl
t (min) 1 (min) -··-· m scanthu (RAC)
Fig. 7. Comparison model-experiments: remaining solid mass in function of temperature and time for torrefaction of raw biomass in TGA-GC/MS (exp) and simulated values obtained through the proposed torrefaction mode! (mod 1), Nocquet's mode! and Ranzi-Anca-Couce's (RAC) mode!.
î
ê
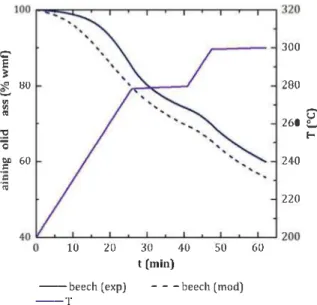
80 "'"' '" '.9 ë � 60 Ï: ·; 10 20 --beech (exp) --T 300 280 260E
1-240 220 30 40 50 60 t (min) - - -beech (mod)Fig. 8. Remaining solid mass Joss in function of temperature and time during torre faction by the first-level mode! (dotted line) and the experimental data (continuous line) for beech in TGA-GC/MS.
conversion in the second stage (isothermal), compared to the ex periments. Furthermore, the consideration of specific torrefaction models per biomass family contributed to better take into account the specific behavior of each biomass in torrefaction due to their biologie origin. This was manifested by the different shape of the degradation profiles in function of the biomass family for the pro posed mode!, which lead to a better fitting of the experimental data. The Nocquet's mode! presented a very similar shape for ail biomasses, due to the fact that only slight differences exist on cel lulose, hemicelluloses and lignin content for the biomasses of study.
The RAC mode! leads to similar predictions than the
second-level nove! mode! presented in this work. The bigger deviations were as well present in the second stage (isothermal) of non woody biomass. The RAC mode! was previously validated for tor refaction of woody biomass [51] and the present work showed again that torrefaction of hardwood and softwood species were well described. The predictions for pine were better than in the new mode! from this work during the first stage, which points out the complexity of hemicellulose in softwood. For other non-woody species, the deviations increased in the latter stage dominated by cellulose decomposition. As for the mode! presented in this work, the presence of inorganics or extractives could be an explanation of this discrepancy. Besides, the results from this work showed that in most of the cases mass Joss in biomass torrefaction can be described by the addition of mass losses of extracted fractions. Thus, this concept can be employed in the future to investigate the release of volatile species, eventually employing the data for further Table 8
Biomass main macromolecular composition as considered for the torrefaction mode! simulations.
Macromolecular component Cellulose Hemicelluloses Lignin Extracted fractions considered for the torrefaction mode!
1 st level mode! Cil H1 L
2nd level mode! c' HT L
Raw biomass composition %wmf Deciduous wood
Poplar 46.7 23.8 29.4
Willow 48.2 24.6 27.3
Coniferous wood
Pine forest residues 28.7 36.0 35.3
Scot pine bark 27.0 22.6 50.3
Herbaceous crops
Reed canary grass 43.9 28.6 27.5
Agricultural by-products
Corn cob 43.1 39.1 17.8
Grape seed cake 8.4 23.7 67.9
Sunflower seed shells 41.5 29.5 29.0
Table9
· � · dl
Prediction of remaining solid mass in function of time and temperature for raw b10masses by the torre act10n mo e .
Deciduous wood (ash-wood model)
c:;, 100 ... ��,-..��,,--��...,...,..., 320 c:;, 100 ,...:,:-,-�-,,�-.... ��...,...,..., 320 f ,---i 300 :
:::
0 � 60 'ë 280 � 80 ...,..
260t.; E-=
240 :il 60 220•a
,;;
280 � 80cë
260� -c E- � 240 "' 60 � 220 ï:! ·a"'
...
40 .:... ... '-'-... �� 200 0 20 40 60 5e
40 IL...0 ��-'-20 ��_._.40 '-'-��� 60 200e
t (min) --beech (exp) - - beech(ash-wood mode! vl)beech (ash-wood mode! v2)
--T
Deciduous wood (beech model)
:::
0 � 60 :§ ,..---, 300 � 280 � 80 ...,..
260t _; E- ::: 240 :il 60 01)=
220·a
·;; 40 IL.._..._�_L.,'-'-._._ ... ��� 200 5e
0 20 40 60 t (min) --ash-wood (exp)-- --ash-wood (beech mode! vl)
ash-wood (becch modcl v2)
--T
Coniferous wood (pine model)
t (min)
--poplar (exp)
----·poplar (ash-wood mode! vl]
---poplar (ash-wood mode] v2)
--T 320 c;;-100 300 � ::R � 280 "' 80 ...,
"'
260t _; t (min) --poplar ( exp)----· poplar (beech model vl)
-····----· poplar (beech mode! v2) --T 240 220 200 E- ::: "' 60 ï:!
·a
40 20 t (min) --willow (exp] 280 ..., u 260� E-240 220 --- -·willow (ash-wood mode! v1) -·-·---·willow (ash-wood mode! v2) --T 20 40 t (min) --willow(exp) 60----·willow (beech mode! vl)
-··---willow (beech mode! v2)
--T 320 300 280 260� E-240 220 200 ÎlOO c:;, 100 ���...,...��-r.-��--.-,-,-, 320 5 c- 100 ���...,...-�-r.-��...,...,-,-,
i
320 ::,'s ::., "' 80 "' 60 :§ 40 f 0 20 ---, 300 � 300 ::,<sl
�
40 t (min) 60 280 � 80 280 � 80 ,...,, ri:: ,:,.. � 260t
.;
·-:�
::
---....
260E
.;
240 E- SÏ 60�
-
-<::
:·
:
·
240 E-!
=
60 220 :� 220 :� 5 S � 40 IL....��._,_���'-'-��� 200e
0 20 4-0 60pine forest residues [exp] --Scot pine bark (exp) t (min)
pine forest residues (pine mode] vl)
pine forest residues ( pine mode] v2] - - - -· Scot pine bark (pine mode] vl)
--T ···-·-· Scot pine bark (pine mode! v2) --T 300 280 260� 20 40 t (min)
--grape seed cake (exp)
240
220
200 60
- - - -· grape seed cake (pine mode.l vl) ---grape seed cake (piJ1e model v2) --T