researchers and makes it freely available over the web where possible
Any correspondence concerning this service should be sent
to the repository administrator:
[email protected]
This is an author’s version published in:
http://oatao.univ-toulouse.fr/26617
To cite this version: Berger, Gilles
and Cathala, Annick
and
Fabre, Sébastien
and Borisova, Anastassia Y.
and Pages,
Alain
and Aigouy, Thierry
and Esvan, Jérôme
and Pinet,
Patrick
Experimental exploration of volcanic rocks-atmosphere
interaction under Venus surface conditions. (2019) Icarus, 329.
8-23. ISSN 0019-1035
Experimental exploration of volcanic rocks-atmosphere interaction under
Venus surface conditions
☆
Gilles Berger
a,⁎, Annick Cathala
a, Sébastien Fabre
a, Anastassia Y. Borisova
b,c, Alain Pages
a,
Thierry Aigouy
b, Jerôme Esvan
d, Patrick Pinet
a ab c
d
IRAP, Université Paul Sabatier, CNRS, 14 avenue E. Belin, 31400 Toulouse, France GET, Université Paul Sabatier, CNRS, 14 avenue E. Belin, 31400 Toulouse, France Geological Dept., Lomonosov Moscow State University, Vorobievy Gory, Moscow, Russia CIRIMAT, CNRS-UPS-INPT, ENSIACET, 4 allée Emile MONSO, 31030 Toulouse, France A R T I C L E I N F O Keywords: Venus surface Alteration Experimental Gas transfer A B S T R A C T
This study presents an inventory of possible chemical reactions affecting, or having affected, the Venus surface. Fluid rock reactions are simulated using experiments under conditions close to the present surface. Slabs or powder of several natural and synthetic silicate material (crystalline fresh basalt, altered basalt, obsidian, pu-mice and basalt glass) were reacted at 475 °C in CO2-H2O-H2S-SO2-CO gas mixture. Most of the runs were carried
out at roughly 90 bars with a duration of one week, some experiments having longer (one month) or shorter (one day) durations. The role of H2O content was explored through a wide range of water pressure: from dry gas for
the current Venus conditions up to 590 bars (86%H2O) for early Venus (or other early terrestrial planets). The
gas phase was sampled before the completion of the runs for chemical analysis of major gas components (CO, H2S, SO2) as well as trace elements possibly released by the rocks. The altered samples were examined by a suite
of mineralogical and chemical techniques (scanning and transmission electron microscopy, X-ray diffraction and spectroscopy).
In dry atmosphere, the redox potential of the gas was close to the Ni/NiO buffer (−21.3 to −27.3 log fO2),
thus close to the current Venus conditions. The sample alteration is tenuous and limited to surface oxidation of glasses and coating of olivine by iron oxides, as well as the general deposition of (Ca,Na)SO4at the sample
surface. The oxidation of glass is reflected in the formation of magnesioferrite under the surface and is ac-companied by the release of Ca, Mg and Na into the gas phase or mineralized as sulfate at the surface. In wet atmosphere, obsidian recrystallizes into a mixture of plagioclase and amphibole while basaltic glass produced non-expandable clays minerals: chlorite-type (2:1:1) at the surface and likely celadonite (2:1) below the surface. Olivine is preserved. Using obsidian (the most alterable material) as a proxy of aluminosilicates, we discuss the surface reactions operating under supercritical conditions, and we used a shrinking-core equation for modeling the long-term reactions.
These parametric exploration offer new insights into processes having affected the surface of Venus and contribute to the discussion of open questions such as the fate of water or the lifetime of vitreous dust or fine grain material if present in the current or past Venusian environment. Longer duration experiments will provide more kinetic parameters that can be extrapolated to the geologic history of Venus.
1. Introduction
Modern Venus is considered as a hot and dry planet with a dense carbon dioxide atmosphere. Its surface with an average atmosphere temperature of ~470 °C has been shaped within the geologically recent past by a volcanic activity resulting in the formation mostly of basaltic
rocks. The predominant basaltic composition of Venus' plains was de-termined by X-ray fluorescence and Gamma-ray spectrometry during the landing site of Venera 13–14 and Vega 2 space missions (Surkov et al., 1984, 1986), while Venera 8 sampled materials which resemble alkaline rocks (Surkov et al., 1987). In addition, near infrared windows explored by remote sensing suggest that the lower emissivity of tesserae
Declarations of interest: none. Corresponding author.
E-mail address: [email protected](G. Berger).
terrain may be interpreted as felsic composition (Hashimoto et al., 2008; Gilmore et al., 2017). Although the absence of plate tectonics suggests that the petrology of Venus's surface is basaltic, its detailed mineralogy is still a matter of debate. For Mars for example, another terrestrial planet without plate tectonics, differentiated rocks were discovered in the Gale crater (Sautter et al., 2015).
The deep atmosphere at contact with the surface contains small amounts of sulfur-bearing species and trace amounts of H2O contents.
The well-known low dielectric constant of CO2 and the low water
concentration, roughly 30 ppm, preclude a priori extensive alteration of the volcanic rocks, at least in the present day conditions. But several morphologic and chemical features of the Venusian soil, however, suggest that the volcanic material has undergone chemical interaction with the atmosphere. Among them, reflectance spectra measured at the Venera 9–10 landing sites (Ekonomov et al., 1980) match with hematite (Pieters et al., 1986), which is uncommon in unaltered basalts under dry conditions. Comparison with the bulk-rock analysis suggests an enrichment of the surface rocks in Fe3+-bearing material (Shkuratov
et al., 1987). The experimental study by Fegley Jr. et al. (1995) on pyrite decomposition supported this observation. Oxidation by SO2
content in the deep atmosphere is an alternative as demonstrated by Radoman-Shaw et al. (2017)based on wollastonite, used in their study as a proxy for silicates. It is interesting to note that the other Ca-bearing silicates tested in this study did not show an equivalent sul-furization of the surface even after 42 days of reaction.
Understanding the degree of rock-atmosphere interaction is crucial for both the composition of atmosphere and the Venus surface, in particular for the cycle of sulfur and water. For example, rock alteration products enriched in sulfates (anhydrite) are expected to control the complex sulfur cycle on Venus (Fegley and Prinn, 1989;Zolotov, 2007, 2008, 2018). However, thermodynamic predictions involving anhydrite underestimate the current SO2content of Venus atmosphere suggesting
that SO2 is not entirely buffered by atmosphere-surface chemistry
(Gilmore et al., 2017). The relative stability of sulfide and sulfate, under deep Venus atmosphere is also an issue and is reviewed by Zolotov (2018). The formation of sulfide is expected at highlands and may contribute to the low radar emissivity above 2–4 km, although atmo-spheric data does not clearly demonstrate this assumption. Similarly, the fate of water through the geological history of Venus is still unclear: how hydrated are (or may have been) the basaltic rocks exposed at the surface? What was the contribution of rock hydration versus atmo-spheric escape from the early atmosphere for the H2O budget? Venus,
although similar to Earth in many aspects, did not undergo a compar-able geodynamical evolution (no plate tectonics). This important question in comparative planetology may be related to water abun-dance in the Venus crust – as water is well known to modify the pet-rophysical properties - and more generally the Venus water cycle (Smrekar and Sotin, 2012;Taylor et al., 2018). From thermochemical calculations, all hydrated minerals and the majority of OH-bearing minerals are unstable today at the Venus surface (Zolotov et al., 1997), although oxyamphiboles may be metastable as suggested byStraub and Burns (1991). The recent review by Gilmore et al. (2017)discussed several scenarios of atmospheric H2O variation with time and their
relationships with formation of tesserae tectonic region. The hypotheses range from a rapid early decline to a more recent but sporadic decline, the latter being associated to sporadic influx from recent volcanism. Recent volcanism may have enabled gas-solid-type alteration reactions, admittedly in restricted area and time interval, under environmental conditions similar to those today. The surface rock-atmosphere reaction may be also important to understand the highlands radar anomalies that may be attributed to high-ε semi-conductor materials (Gilmore et al., 2017).
Improved knowledge of mechanisms and rates of rock-gas interac-tion in Venus's present or past atmospheric condiinterac-tions is required to better constrain the evolution of both the surface and atmosphere with time. Thermodynamic calculations in dry actual atmosphere (Zolotov
et al., 1997) predicted the formation of iron oxides and sulfate, even enstatite from olivine. In wet atmosphere, serpentinization of olivine or the green schist facies albite-epidote-chlorite for basalt is expected. However, the kinetic constraints of gas-rock systems are not trivial and are challenging in our case. Alteration kinetics of silicate minerals has been extensively investigated in the last decades in aqueous solution below the water critical point, i.e. a condensed polar liquid (dielectric constant > 20). Under the extreme conditions of deep Venus atmo-sphere, and in a CO2-dominated gas, theoretical and experimental
studies are rare. The study byZhang et al. (2011)explored the rate and stoichiometry of dissolution of actinolite and pyroxene in water above 300 °C, at conditions when the density and the dielectric constant of the fluid decrease causing the destruction of the water molecules' hydrogen bond network and so affecting the rates of ionic reactions and hydration of the silicate framework. The consequence is that the kinetics of sili-cate dissolution in the subcritical and supercritical region is not well described by an Arrhenius form, as it is the case at lower temperature. Zhang et al. (2011)proposed a kinetic expression integrating the effect of the dielectric constant where the logarithm of the rate decrease is inversely correlated to the inverse of the dielectric constant. In CO2
fluids, the dissolution of silicate phases is even less documented, at least in pure CO2, because the very low dielectric constant of such non-polar
fluids makes it quite unlikely to breakdown the silicate structure despite favorable Gibbs free energy of reaction. Few studies are available in the literature on the subject. A recent review of gas-rock interaction at high temperature byKing et al. (2018)presents an inventory of chemical reactions occurring between SO2and silicate minerals or glasses with
geologic examples. Under dry atmosphere, SO2is considered as an
al-ternative to H2O for silicate alteration. Details of the reactions are
discussed inRenggli and King (2018),Palm et al. (2018),King et al. (2018)andDelmelle et al. (2018). Applied to Venus, the expected re-action is surface oxidation and sulfate growth (Zolotov, 2018; King et al., 2018).
Most theoretical studies on Venus surface-atmosphere interaction focus on the modern dry conditions. The impact of atmospheric water during its early history, or during more possibly recent wet, volcanic events, are not documented although small content of water may sig-nificantly change the processes. At lower temperature for example, the rare studies devoted to the silicate alteration in CO2suggest that the
observed alterations were driven by few % H2O in the gas, either
be-cause the gas phase was equilibrated with an aqueous solution (Daval et al., 2009) or because the starting minerals were hydrated (Regnault et al., 2009). In order to address the role of H2O on these reactions, and
more generally to elucidate the chemical and mineralogical processes operating under the specific conditions of Venus, we conducted an experimental program covering the present day conditions. We have reacted a variety of crystallized and vitreous silicate rocks in a CO2
-dominated atmosphere, with variable amounts of H2O and sulfur
spe-cies, and under typical current conditions of Venus surface: 470 °C, ≈100 bars. Most of the experiments were conducted for roughly one week (~ 170 h) except some tests which ran from 1 day (24 h) to 1 month (~720 h). We have tested the consequence of the presence of sulfurized gaseous species by comparing runs of pure CO2with runs of
sulfurized CO2. The effect of H2O was investigated using dry to
water-dominated gas and up to 590 bars vapor pressure. Among the rock samples, glasses of several compositions were used. Even if vitreous materials are not the most representative materials of Venus surface, they may have been produced in pyroclastic flows as those recently described inCampbell et al. (2017). The mineralogical signatures of the experimental sample products were analyzed at the end of the runs by scanning and high resolution transmission electron microscopy (SEM, HR-TEM), X-ray diffraction (XRD) and X-ray photoelectron spectro-scopy (XPS), while aliquots of gaseous phase were sampled during the course of experiments and analyzed for their chemical composition. In addition to direct implications for the rock-atmosphere interaction on Venus, this study also discusses the mechanisms and rates of silicate
alteration at high temperature in a low-density supercritical fluid rich in CO2or CO2-H2O mixture.
2. Experimental procedure 2.1. Experimental design
The experiments were conducted at 475 °C in an Autoclave-France® bolt-closure reactor made of Hastelloy-C276. This Ni-based alloy (59% Ni, 17%Cr, 16%Mo, 5%Fe, 3%W) prevents corrosion of the reactor in aggressive media such as CO2-H2S/SO2-H2O mixture, although a
sulfi-dation of Hastelloy may occur at high temperature in presence of SO2
(Tu and Goto, 2005). The internal volume of the reactor is 320 mL and measures 48 × 190 mm. The vessel is equipped with several connec-tions (in HeC276) that enabled sampling of the fluid phase during the run and/or injection of gas or liquid. The tightness between the body and head of reactor is ensured by a metallic gasket sealed with an ad-ditional 0.2 or 0.5 mm thick graphite sheet. The temperature was held constant by a West@6100 PID controller attached to an electric collar-type heater within nominally 1 °C for a dense solution (aqueous liquid). A more complete description of the device can be found inSavary et al. (2012). The vessel was initially designed for aqueous solutions and was equipped with an impeller driven by an external magnetic driver to homogenize the temperature and fluid chemistry. With supercritical fluids at low density (typically 0.08–0.15 in the present case), the thermal regulation by the impeller was less efficient, with variations up to 3 °C, and we finally removed it to simply the design. The rock sam-ples were accommodated in a 25 mm high × 20 mm diameter Pt-cru-cible fixed at half-height of the reactor body adjacent to an internal J thermocouple.
2.2. Rock samples
The three rock samples and three synthetic vitreous materials that were used are briefly described below. They were selected to cover a large range of rock composition and geological context. The bulk che-mical compositions of the starting samples and minerals of interest of the crystallized rocks are reported inTable 1.
Millimeter-length beads of four rock samples were selected after grinding massive samples. These beads were dedicated to the in-vestigation of the altered surface by microscopic observations. The origin and description of the four starting rocks is listed thereafter:
–A picritic basalt from the 2007 eruption of Piton de la Fournaise, Réunion Island, western Indian Ocean, was selected for the in-vestigation of the behavior of individual mineral, in particular oli-vine. The basalt contains millimetric phenocrysts of olivine (80% Fo), sub-millimetric crystals of augite, labradorite and magnetite
embedded in a cryptocrystalline matrix.
–A basaltic pumice collected in 1990 in a fresh lava flow of the Pu'u'O'o volcano, Kilauea, Hawaï, represents a standard volcanic glass. It is vitreous, unaltered and contains mineral inclusions of augite and labradorite.
–A natural unaltered vitreous obsidian, collected at Vulcano Island, Italia, was selected to test the behavior of glasses having a chemical composition that differs from that of a standard basalt. The lava contains millimeter-length elongated vacuoles covered by spherical aggregates (lepidosphere) of opaline silica. The bulk composition is intermediate between trachyte and rhyolite.
–The natural vitreous materials were completed by a synthetic alka-line glass. It was prepared for a previous study and details are available inBerger et al. (1994).
In addition to the beads, some samples were conditioned in other forms for specific purpose:
–We prepared a powder from a tholeitic basalt from Pic d'Ysson, Massif Central, France. This sample is a fine grain basalt and was used in a previous study (Souchon et al., 2011). The 100–150 μm sized fraction was selected by sieving and was ultrasonically cleaned. Its specific surface area measured by nitrogen or krypton gas adsorption (BET method) is 1.2 m2g−1. It is very slightly altered
as shown by its 0.8% H2O content, a high specific surface area and
the presence of rare alteration features observed under SEM. The high surface area of this sample was supposed to enhance the che-mical transfer (if any) from the basalt towards the atmosphere. –We also prepared a fine powder of a natural altered basalt collected
at contact with the quartz-syenite intrusion constituting the Piton des Neiges, Réunion Island. An accurate description is given in Berger et al. (2018). It is composed of clinopyroxene (diopside), plagioclase (andesine) and monomineralic corrensite (1:1 regular intercalation of trioctaedral chlorite-smectite). This clay-rich sample was dedicated to the monitoring of the crystallographic changes of the clay fraction by XRD.
–Polished slides of the synthetic alkaline basaltic glass (10 × 10 × 1 mm) were dedicated to XPS analysis of the altered surface.
–Finally, the synthetic alkaline glass was conditioned in powder to increase the reactive surface area. We selected the 125–250 μm fraction. Its specific surface area measured by BET is 0.031 m2g−1
after ultrasonic cleaning. In one run we used a fine crushed powder (< 50 μm, 0.143 m2g−1) to even more increase the surface area
exposed to alteration.
Table 1
Composition of starting materials. The bulk compositions were analyzed by the Analytical Research Facility of the CRPG, Nancy, France. (*) The individual minerals were analyzed on polished section by energy dispersive spectroscopy (EDS) under SEM.
Sample SiO2 Al2O3 Fe2O3(t) CaO MgO Na2O K2O TiO2 MnO H2O
Obsidian 73.1 13.4 2.3 1.03 0.19 4.19 5.25 0.11 0.08 0.54
Alkaline basaltic glass 49.0 16.7 11.5 7.18 4.69 3.99 2.34 2.86 0.15 0.14 Tholeitic glass slide 40.2 11.1 13.1 10.4 13.1 3.5 1.5 2.5 0.3
Basaltic pumice 48.9 14.3 12.3 11.2 6.52 2.75 0.79 2.83 0.17 0.18 Altered basalt Bulk 44.1 12.4 12.8 8.90 9.56 2.73 0.11 2.10 0.18 3.16 Corrinsite (*) 35.1 13.7 15.2 0.90 22.4 12.2 – 0.1 – 12.2 Cpx (*) 50.4 3.8 5.2 21.1 15.7 0.2 – – 0.2 – Picritic basalt Olivine (*) 37.8 0 17.8 0.4 43.0 – – – – Pyroxene (*) 48.8 3.3 8.8 28.4 15.7 – – – – Tholeitic basalt 43.4 12.1 11.8 9.63 14.1 3.19 1.43 2.35 0.18 0.80
2.3. Gas loading
Three gas systems were tested: (i) pure CO2, (ii) Venus-like
atmo-sphere (CO2with 3.5%N2and traces of CO, H2S and SO2), and (iii) a
mixture of each gas with H2O. Before loading the reactor with the
de-sired gas, it was flushed with argon to remove any trace of oxygen. The amount of loaded gas was calculated at the temperature of loading using Equation of State (EOS) models (Duan et al., 1995;Bakker, 2009). (i) For pure CO2, we used commercially purified gas at grade 4.5, at
approximately 48 bar. After heating, the final pressure was ad-justed to 90 bar by decompressing the excess of pressure if neces-sary.
(ii) For the Venus-like gas we used a feed bottle of CO2-based gas
mixture at a pressure of 28 bars, the maximum pressure to avoid an incongruent condensation of a liquid phase at low temperature. The reactor was then adjusted to 50 bar using pure CO2, the feed
Venus gas bottle having concentrations in N2and SO2twice to the
nominal values (7% N2, 30 ppm CO, 6 ppm H2S, 260 ppm SO2).
Preliminary runs showed that the sulfurized species reacted with Hastelloy and decreased with time. To prevent this artefact we proceeded to a preventive sulfurization of the reactor consisting of heating elemental sulfur in a wet atmosphere. At high temperature the hydrolysis and disproportionation of sulfur provides sulfide and sulfur oxides that saturate the reactor surface. Thus, H2S and
SO2are released during the runs at a concentration level that is not
exactly the present-day concentration of Venus deep atmosphere but that allows us to evaluate the importance of these species in the surface-atmosphere interaction. The gas mixture containing H2S,
SO2and CO was monitored at the end of each run during the
de-compression stage with a Micro5 detector commercialized by BW-Technologies©. The typical concentration range was 11-68 ppm H2S, 25-688 ppm SO2and 17-500 ppm CO. The high content of CO
results from the reaction of CO2with graphite used for the gasket
sealing. In the last run using dry Venus-like gas we enriched the gas mixture with 2% CO in order to test a possible metal transportation as carbonyl species, as suggested bySimakin et al. (2016). (iii) For the wet gas experiments, variable amounts of pure water were
injected in the reactor by an HPLC pump once the temperature and pressure with the dry gas were stabilized. The pressure increased proportionally to the mass of injected water. However, the final pressure was systematically lower, down to 25%, than the ex-pected pressure as predicted with EOS models. This difference, not observed with dry gas, is likely the consequence of colder zones in the system where water may progressively condensate when fH2O
increases (the bottom of the reactor body and the head equipped with the connections are outside of the heating collar). We finally calculated the water fugacity in the gas mixture from EOS models (Duan et al., 1995;Bakker, 2009).
2.4. Procedure and analytical methods
Several rock samples were tested simultaneously in the Pt-crucible. Tables 2 and 3present the conditions of each experiment. The gas was left to react with the rock samples for one to two weeks in most cases. The gas pressure decreased sometimes with time due to leakage of the system, in particular in the first runs. For these runs, we reported in the table the minimal and maximal values of the pressure range. At the end of the runs the gas was sampled three consecutive times at the tem-perature of the run in a dedicated 15 mL closed cell made of Hastelloy-C276, after the purge of the sampling line. At each time the sampling cell was previously filled with 6 to 12 mL of 1 M NH4OH solution
(Su-prapur, Merck®) in order to dissolve the sampled (sour) gas in a basic solution. The sampling duration was short, on the order of a “fraction of” second, in order to avoid an oversampling by condensation of the gas at low temperature. The mass of ammoniac solution previously
introduced in the cell and the mass of sampled fluid (0.5 to 2 g) were weighed. After 1 h of reaction at room temperature the sampling cell was opened and the ammoniac solution is diluted in 2%HNO3solution
(bi-distilled from Suprapur, Merck®) for further analyses by high-re-solution mass spectrometry (HR-ICP-MS, Element XR, Thermo-Scientific®).
At the end of the experiment the reactor was decompressed and then flushed with argon before cooling to avoid the deposition of possible secondary phases during quenching. The temperature decreased below 300 °C in 10 to 15 min during this operation, and then the reactor was quenched at room temperature in air in 1 h. This procedure prevents any back reaction during the quench. During decompression, the gas was analyzed for CO, H2S and SO2by a GasAlertMicro5 gas controller
commercialized by BW-Technologies®. These measurements were re-stricted to dry gas because the condensation of water is incompatible with the electrochemical cell of the controller. We also sampled in one run an aliquot of gas in a Tedlar bag for analysis of the species OCS (predicted by thermodynamics) by micro-chromatography coupled with mass spectrometry (MicroGC Agilent QUADH). SO3(g), which is
unlikely under these reduced conditions, was not analyzed.
The reacted samples were examined by several mineralogical techniques. The experimented material was systematically observed under SEM, as-is or on a polished cross-section. SEM observations were performed with Geol-6360LV microscope equipped with a Brucker® EDS, in both secondary electron imaging mode (SEI) and/or back-scattered electron mode (BSE) on carbon-coated samples or polished cross-section sections. The analytical conditions for punctual chemical analysis were 20 kV, 106counts and a working distance of 14 mm. The
standards used for quantitative chemical analysis consisted of jadeite (Na), corundum (Al), wollastonite (Si, Ca), MgO (Mg), orthoclase (K) and metals for Fe, Mn and Ti. The matrix corrections were performed using integrated programs (PhiRhoZ correction).
When secondary products were identified in significant amounts, they were recovered by sonification/decantation in alcohol and char-acterized by XRD on oriented preparation (decantation on glass slides and analyzed as-is or after glycolation). XRD analyses were performed on a Bruker® D8 XRD diffractometer (CuKα1+2 radiation) over the
2–60° 2Θ angular range with 0.02° 2Θ steps and 2 s per step. The altered surface of the polished basalt glass slide was analyzed by XPS and HR-TEM. XPS analyses were performed on a ThermoScientific® spectrometer (Kalpha) using a monochromatized Al Kα (1486.6 eV) source. The Pass energy was fixed at 40 eV with a step of 0.1 eV for core levels. Ionic Sputtering of the surfaces was made by Ar+ion beam accelerated under 1 keV. XPS Spectra were recorded in
direct N(Ec). The analyzed surface area is 400 μm in diameter and < 10 nm in depth. The photoelectrons spectra are calibrated with respect to the C1s at 285.0 eV ( ± 0.1 eV) energy. The HR-TEM analyses were performed on ultrathin sections using a JEOL JEM-ARM200F Cold FEG microscope coupled to CENTURIO-X, an energy-dispersive X-ray spec-trometer and an electron energy loss specspec-trometer. The sample has been prepared by using focused ion beam (FIB) technique using electronic Table 2
Experimental conditions for CO2-H2O systems. In each run, beads of picritic
basalt, altered basalt and obsidian were reacted together. The gas was not sampled. X H2O and f H2O were calculated by processing the monitored P,T
data through EOS models (Bakker, 2009).
Run T (°C) duration X(H2O) initial density P f H2O
± 3 °C (day) (g.cm−3) (bar) (MPa)
V1 466 5 0 0.079 108–100 0
V3 470 6 0.50 0.135 218–115 8.44 V4 464 6 0.11 0.128 180–110 1.82 V6 456 5 0.75 0.157 253–215 12.5
microscope HELIOS 600i (FEI). 3. Results
3.1. Redox conditions
Redox conditions of the Venus-like experiments were assessed from the carbon speciation as measured at the end of the dry-gas runs. Oxygen fugacity was calculated from the CO/CO2concentration ratio
and Eq. (27) reported inFegley Jr. and Zolotov (1997). The values are reported inTable 3and fall in the 10−21–10−27range, with an average
value at 10–23.4consistent with the Ni-NiO mineral buffer at 470 °C.
This is consistent with the composition of the reactor, a Ni-based alloy. This redox range is significantly below the hematite-magnetite buffer and over the magnetite-wustite buffer meaning that the most stable form of iron oxide is magnetite, in agreement with that which is gen-erally admitted for the Venus surface, at least at low elevation (Fegley Jr. and Zolotov, 1997).
The sulfur chemistry is more complex with several species of in-termediate degree of oxidation and several possible redox reactions involving S° and H2O. For example, the reaction
SO2+ 3H2= H2S + 2H2O has to be considered. But in absence of
ac-curate measurements of elemental sulfur and molecular water in the “dry” gas, the sole concentrations of H2S and SO2are not sufficient to
determine the redox state of the sulfur system and to check if the sulfur speciation is in redox equilibrium with the carbon speciation. However, the concentration of OCS measured in run V11 indicated a value of 18ppmv, in the order of magnitude of the current composition of the Venus lower atmosphere (Marcq et al., 2008). In addition, basic ther-modynamic calculations show that possible H-species like H2or CH4are
unlikely in our relatively oxidizing conditions.
Although our experiments are not designed for an accurate de-termination of sulfur speciation, we believe that the gas composition in our Venus-like experiments is likely not so far from present-day Venus deep atmosphere.
3.2. Reaction products
A constant observation in all of the runs is the deposition of fine metal-rich particles on the samples. The composition of these particles
depends on the run conditions: Ni, Mn, Mo oxides in pure CO2or
me-tallic sulfides in Venus-like atmosphere. These particles may be related to a metal dusting-like process, a corrosive disintegration of alloys into fine particles in carbon-saturated atmosphere occurring typically be-tween 400 and 800 °C (Aguero et al., 2011, a review).
Another constant observation is the higher reactivity of olivine and glasses over plagioclase and pyroxene, as it is frequently the case in aqueous silicate alteration. There is only one exception (discussed at the end of the paper) where olivine appeared inert, under 590 bar H2O.
Consequently, we mainly focus here to the behavior of olivine and glasses. We also distinguish the observed reactions in the simplified CO2-H2O system from those in the Venus-like system.
3.2.1. Pure CO2-H2O system
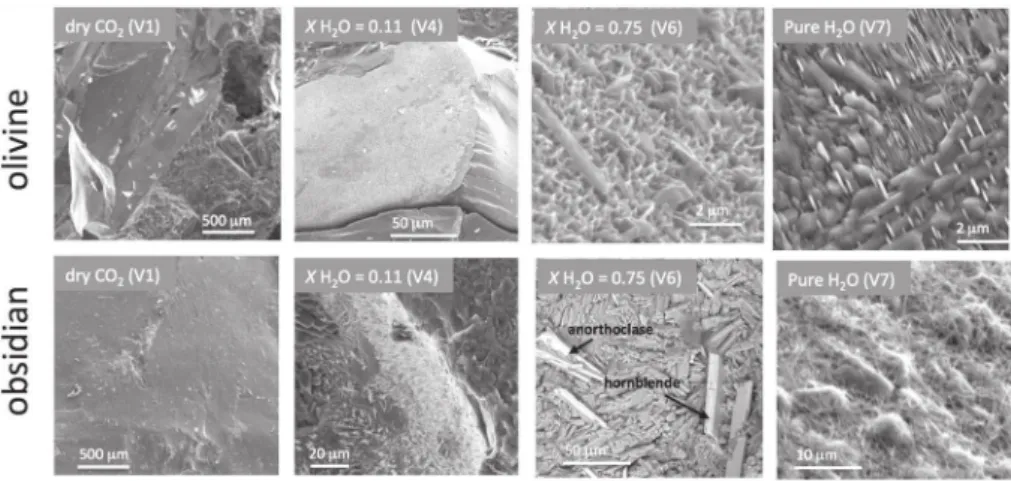
The first run conducted in dry CO2did not show any sign of
al-teration when observed under SEM. By contrast, the increase of H2O
content in the gas led to progressive morphological changes of olivine and obsidian surfaces (Fig. 1). For olivine, the surface shows signs of recrystallization that depends on H2O:CO2ratio. At lowest tested ratio
(XH2O = 0.11) some exposed faces seem unmodified while others
ex-hibit a very thin altered film. At the highest H2O:CO2ratio, or in pure
water, three morphologies of crystals were observed: fibrous, lamellar or massive crystals. The volume of newly formed crystals did not allow a chemical or crystallographic characterization by SEM or XRD methods. For obsidian, the alteration is more pronounced and alteration layers are thick enough to be observed on polished cross-section. In Fig. 2 we show the SEM observations of altered obsidian at XH2O = 0.50 and 0.75. Polished cross-sections reveal under SEM the
development of crystallized silicates within a surface layer of several tens of micrometers. For XH2O = 0.75, quantitative EDS analyses
evi-dence a mixture of few iron oxides, anorthoclase (> 90%) and a Fe-bearing amphibole of the hornblende group. To improve the mineral determination of the alteration layer we carried out in-situ XRD on the polished section for several days. Despite this long accumulation time, the diffractograms were poor in reflections with a pronounced baseline. This may be due to the small surface area exposed to the X-ray beam (0.1cm2), a possible preferential crystal orientation and likely a low
crystallinity of the material. In addition, we masked undesired zones of the section by a Pb-film so some intervals of the pattern have been removed corresponding to Pb and its oxides. The two diffraction Table 3
Experimental conditions for the Venus-like systems. PB = picritic basalt, Obs = obsidian, AB = altered basalt, Pum = basaltic pumice, BG = basalt glass, YB = crystallized basalt, BS = basalt slide, fBG = grinded basalt glass. When mass is not indicated means sample as bead. * V10 underwent two accidental cooling during the run, down to 178 °C and then down to 25 °C.†
V8 and V10 were not sulfurized sufficiently to exceed the reaction with the vessel walls. X H2O and f H2O
were calculated by processing the monitored P,T data through EOS models (Bakker, 2009). fO2was calculated from the CO/CO2ratio and Eq. (27) inFegley Jr. and
Zolotov (1997). The pressure range corresponds to the decrease of pressure by leakage.
Run T (°C) ± 5 °C
Duration (day)
Samples Mole loaded Calculated Measured Calculated
“Venus” mixture CO2 H2O P (bar) XN2 XH2O f H2O (MPa) CO H2S SO2 log (fO2) ppmv (final) V8 466 7 Obs, PB, 0.011 g AB 0.345 0.452 0 169–136 0.03 0 0 0.05% 0† 0† −24.3 V10 488* 3 Pum, 0.21 g BG, Obs, PB 0.192 0.483 0 127–117 0.02 0 0 112 0† 0† −21.3 V11 471 6 Pum, 0.17 g BG, Obs, PB 0.177 0.435 0 98–94 0.02 0 0 176 48 688 −23.2 V13 473 14 8.0 g YB 0.163 0.45 0 118–78 0.019 0 0 64 36 46 −23.5 V15 472 8 6.17 g BG, BS 0.134 0.439 0 111–90 0.016 0 0 88 28 320 −22.5 V18 471 7 2.1 g YB, 1.04 g fBG 0.107 0.402 0 98–96 0.015 0 0 17 19 140 −21.5
V18bis 473 7 V18 continued 2% CO added 85–82 0 0 – – – −27.3
V12 470 2 Pum, 0.08 g BG, Obs, PB 0.206 0.395 0.06 119–99 0.022 0.13 1.28 – – – V14 471 16 7.3 g YB 0.165 0.211 0.22 102–87 0.019 0.38 3.16 – – – V19 471 7 Pum, Obs, BG 0.113 0 0.36 90–87 0.017 0.78 5.57 – – – V17 468 9 Pum, 2.0 g BG, Obs 0.123 0.29 0.36 138–127 0.011 0.49 6.03 – – – V22 472 30 Pum, Obs, BG, PB 0.099 0 0.406 90 0.014 0.82 6.67 – – – V21 470 1.5 Pum, Obs, BG 0.096 0 0.424 90–85 0.013 0.83 6.92 – – – V20 472 7 Pum, Obs, BG 0.142 0 3.18 360–355 0.003 0.96 23.0 – – – V23 473 7 Pum, Obs, BG, PB 0.229 0 4.95 590 0.003 0.86 29.5 – – –
patterns showed inFig. 2are accumulations of several diffractograms and show two kinds of pattern: weak reflections consistent with horn-blende and two small diffuse bands at the position of the main plagi-oclase pattern (anorthplagi-oclase from SEM). The low intensity of anortho-clase pattern, while it is the dominant constituent of the altered layer, indicates a low degree of crystallinity or more likely a small crystallite size, probably < 50–100 nm. The low number of lines, when compared to a powder reference spectrum, may be attributed to a preferential orientation of the crystallites. At XH2O = 0.50 the alteration layer is
not well organized and it is depleted in silica and enriched in alkali. At the lower H2O content (XH2O = 0.11) we did not observe any
altera-tion layer suggesting that a threshold concentraaltera-tion may be necessary for glass crystallization.
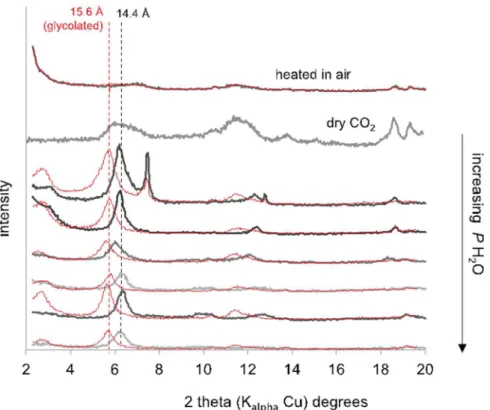
The clay fraction (corrensite) of the reacted altered basalts con-served its crystallinity and its swelling properties in wet gas (Fig. 3). When reacted in dry CO2, the collapse of the pattern reflects a loss of
crystallinity but the 2:1:1 structure, evidenced by a band at 14 Å, is conserved. By contrast, when heated in air at 470 °C for one week the 2:1:1 structure is lost and the pattern is flat.
3.2.2. Venus-like system
In this suite of experiments we tested the consequence of adding sulfur-bearing species on the above process. We also tested different materials. In particular, we reacted a natural basaltic pumice, a crys-tallized basalt and the basalt glass as powder, in addition to the pre-vious tested materials. The main observation is the formation of sulfur-bearing species at the surface of the samples, mainly the glassy mate-rials. Some examples are shown onFig. 4.
In dry gas, surface of glasses was covered by S-bearing crystals of several microns in size, likely sulfates. In the run using glass beads with XH2O = 0.36 (V17) we were able to recover the secondary minerals by
sonication in alcohol and their XRD pattern indicated the presence of anhydrite, confirming that these salts are sulfates. In a given run, the sulfate composition seems to be dependent on the nature of the support: anhydrite on basaltic glass and obsidian, anhydrite + (meta)thenardite (Na2SO4) + glauberite (Na2Ca(SO4)2) on pumice, for example. This
suggests a local source of cations for the sulfate nucleation and growth. However, this can differ from one run to another: Na2SO4rather than
CaSO4recovered the basaltic glass slide in V15. By contrast to glass,
olivine in dry gas does not produce detectable sulfate but rather an iron oxide coating (V11). It is also interesting to note that iron sulfide, likely Fig. 1. Morphology under SEM of altered olivine and obsidian glass in the pure CO2-H2O system.
hornblende
X H
2O = 0.75 (V6)
glass
X H
2O = 0.50 (V3)
glass
(wt.%) Na2O Al2O3 SiO2 K2O CaO FeO TiO2 MoO altered 5.43 17.34 64.43 7.44 0.54 1.45 0.09 1.63 raw 2.84 13.45 71.83 5.27 0.55 1.71 0.15pyrite, forms on the picritic basalt during an accidental cooling (V10). We did not observe sulfide in the other runs. This is consistent with thermodynamic findings of the pyrite-magnetite buffer predicting the stability of pyrite at high elevations, i.e. low temperature (Fegley Jr. and Zolotov, 1997).
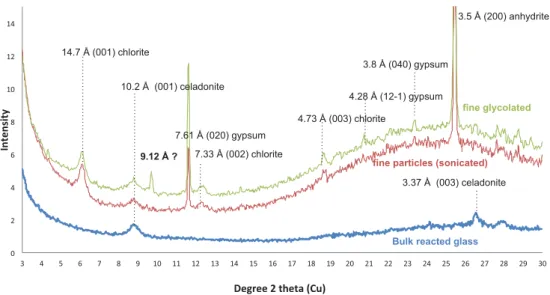
In wet sulfurized gas, (meta)thenardite, sometimes enriched in Fe, dominates over the other sulfates. Olivine of the crystallized basalt reacted in wet sulfurized gas (V14) exhibits fibrous material at the surface that we were not able to identify. By contrast, the glass beads tested in run V17 produced enough secondary phases to be isolated by sonication/decantation in methanol and characterized by XRD (Fig. 5). Beside anhydrite we clearly identify a non-swelling clay mineral of the chlorite group and a 10 Å phylosilicate mineral, likely celadonite. This last one, a common alteration phase of basalts, is also detectable in the bulk reacted fraction suggesting that it is not limited to the surface.
In order to better understand the formation of sulfate crystals on the glassy surface in dry gas, the basaltic slide was analyzed by XPS. This surface sensitive analytical method provides the chemical composition of a centimeter surface area for a thickness that does not exceed few nanometers. Variation of composition with depth is measured after successive sputtering of the surface with an argon ion gun. We carried out analyses on three reacted slides. The first reacted slide was dedi-cated to a depth profile through the sulfate layer (approximately 1 μm) by a progressive sputtering with the ion gun and a total etch time of 1500 s. The two other altered slides were pickled before the XPS ana-lysis, either mechanically with a cutter blade or chemically by a brief water rinse in order to better assess the glass composition below the sulfate layer. The following elements (electron energy level) were quantified: Al(2p), Si(2p), S(2p), K(2p), Ca(2p3/2), O(1 s), Fe(2p3/2), Na
(1 s) and Mg(1 s). The sulfur concentration decreased through the Fig. 3. XRD patterns of the oriented clay fraction from the altered basalt exposed to increasing H2O content in the H2O-CO2system. The red curves are for
glycol-saturated preparations. (For interpretation of the references to color in this figure legend, the reader is referred to the web version of this article.)
sulfate layer from 10 to 4% atm, from 7 to 0.9% atm in the scraped sample and from 0.6 to 0% atm in the washed sample. This succession of the three samples mimics a wide depth profile from the sulfate-rich surface to the interior of the glass. Unfortunately there is no obvious equivalence between the etch time and a quantified thickness. However, it is likely that we did not probe deeper than 100 nm inside the glass. The results are presented inFig. 6after the following data processing. The concentrations in atom % are normalized to 100 after removing the contribution of S and its associated O and Na based on the thenardite stoichiometry. This approach provides focus on the glass composition itself. In a second step, the concentrations are normalized to the composition of the pristine glass (Table 1) in order to quantify the gain or loss of each element as a function of the etch time (depth). The first analyses before the 50 s etch time are ignored to discard any sur-face contamination, typically C and O. The results show a strong ac-cumulation of Na at the surface, a gain of Mg and a loss of Ca beneath the interface with the sulfate layer. Fe shows a deficit in the sulfate layer, less pronounced but possible in the interior of the glass. Si and K do not show significant variations, at least in the accuracy of the XPS quantification (20–30% relative).
The XPS analyses were complemented by HR-TEM microanalyses. An ultrathin section of the altered glass slide (V15) with the
precipitated (Ca,Na2)SO4 salt coating was been prepared by the FIB
technique. The HR-TEM/EDS analysis showed the distribution of prin-cipal major elements in the alkaline basaltic glass at the interface with the salt coating (Fig. 7). Below the interface with the salt coating, we observed dendrites in the glass matrix of the sample. The dendrites are enriched in Fe, Mg and Ti crystals (Table 4, point a). The crystal dif-fraction images and the characteristic d (Angstrom) and d-spacing in-dicate the dendrite mineral has a spinel structure, magnesioferrite (MgFe23+O4). The investigated glass around the dendritic zone is
de-pleted in Fe, Mg and Ti, as well as in Ca and Na compared to the starting glass composition (Table 4points b and c). Moreover, the investigated glass around the dendritic zone is enriched in Si and Al compared to the initial composition of the glassy sample (Fig. 7).
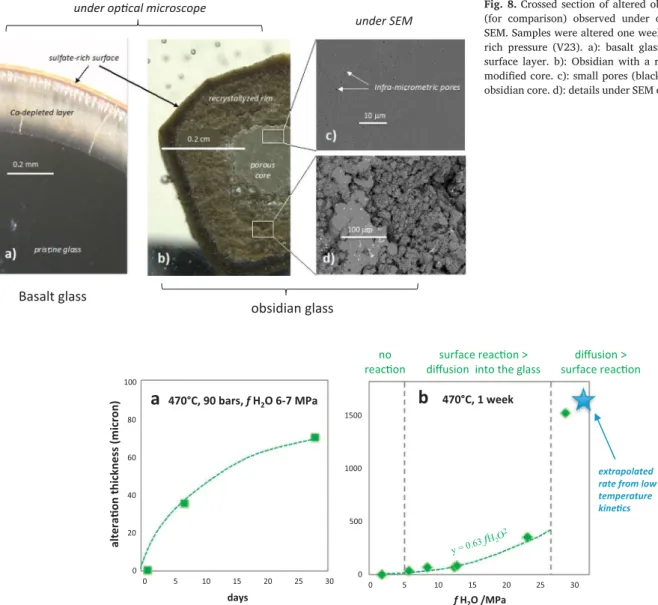
3.2.3. High water pressure test
In order to better assess the role of vapor pressure, a few runs were conducted under up to 590 bars of H2O-rich gas, well above the usual
range. These runs lasted one week and focused on glassy materials. Pumice, synthetic basalt glass and obsidian altered through different pathways: pumice and basalt glasses developed a chemically modified layer, depleted in Ca for basalt glass or hydrated for pumice, without true recrystallization (Fig. 8a). For the higher tested vapor pressure, the Fig. 5. XRD patterns of the alteration phases produced on basalt glass in wet Venus-like gas (V17).
Fig. 6. Relative chemical gain and loss at the sub-surface of the basaltic slide altered in the dry Venus-like gas (V15), as measured by XPS. The stronger variations are the accumulation of Na in the sulfate layer and the loss of Ca deeper in the glass. A general gain of Mg and loss of Fe is also observed.
core of the obsidian grain, beneath the recrystallized rim, was slightly modified (Fig. 8b): its color turned from black to green and it appeared porous (black infra-micrometric holes in Fig. 8c) or hydrated. The chemical composition of the core was not significantly modified, while the recrystallized rim is depleted in silica.Fig. 8shows the most spec-tacular observations on polished cross-section under optical microscope and SEM. In all the cases, sulfate minerals were observed at the surface of the altered samples.
The reaction rates are reflected in the thickness of the alteration
layer developed as a function of time.Fig. 9a reports the dependence of the recrystallized rim thickness on elapsed time for a constant water fugacity of 6–7 bars. The first-level observation shows that reaction rates also depend on the water pressure all of the other parameters being constant. In order to quantify the role of water pressure on al-teration kinetics, we compare in Fig. 9b the thickness of the re-crystallized rim after one week of reaction to the water fugacity that varied over one order of magnitude in six selected runs. We choose obsidian as a reference material because it reacted fast enough at la-boratory time scale to make measurements easily even at low vapor pressure. In this figure we also reported a predicted alteration thickness extrapolated from the rate constants reported in the literature for condensate water below 300 °C. The “long term” rate constant in Si-rich solution reported inBerger et al. (1994)was extrapolated to 470 °C. It corresponds to the steady state dissolution rate when the solution is enriched in silica by the glass dissolution. Considering that this situa-tion is comparable to the rate observed here after one week of reacsitua-tion, we first calculated the rate constant measured at 470 °C from the data measured at lower temperature and assuming an activation energy of 60 kJ·mol−1. The extrapolated value (7 × 10⁻⁵ mol Si·m−2·s−1) was
then converted in altered thickness for 7 days of reaction using a glass density of 3 kg·dm3 and a Si concentration of 0.025 mol·cm−3. We
found a recrystallized thickness of 1.7 mm assuming that the dissolution rate of the pristine glass controls the progression of the recrystallized rim. This value is reported inFig. 9b assuming that the density of a
b
c
surface
glass
1 2 3 4 5 6 7 8 9 10Spot#
d-Spacing
Rec. Pos.
Degrees
Degrees
(nm)
(1/nm)
to Spot 1
to x-axis
1
0.2970
3.367
0.00
85.10
2
0.1460
6.847
1.85
83.24
3
0.2554
3.915
34.64
50.46
4
0.1574
6.355
36.81
48.29
5
0.2549
3.924
69.07
16.03
6
0.1654
6.047
74.41
10.68
7
0.2557
3.910
116.44
-31.35
8
0.1677
5.963
109.08
-23.99
9
0.2626
3.809
148.64
-63.54
10
0.1542
6.484
147.72
-62.63
Fig. 7. Bright field transmission electron micrograph of an ultrathin section of the altered glass slide surface (V15, dry gas). Salt, (Ca,Na2)SO4, is visible in the upper
part of the sample and dendrites in the glass below the surface. The location of the analyzed zone by EDS is indicated by squares. An example of a diffraction image with d-spacing is reported in the lower cases.
Table 4
HR-TEM/EDS standardless quantitative analysis of the alkaline basaltic glass slide (V15). Phase Point position/ Atom% Dendrite a Glass b Glass c Pristine glass O 54.0 58.1 54.9 52.5 Na 0.7 0.2 1.8 2.4 Mg 10.8 6.1 8.2 11.9 Al 3.8 5.9 5.1 3.8 Si 11.8 24.3 20.4 16.6 K 0.4 0.5 0.5 0.2 Ca 1.8 2.2 4.8 8.2 Ti 1.0 0.2 0.5 0.8 Fe 15.7 2.6 3.4 3.8 Total 100.0 100.1 96.6 100.2
liquid aqueous system heated at 470 °C decreases down to 0.3 and the pressure increases to 60 MPa, the corresponding water fugacity being 31 Mpa. It is worth noting that the value extrapolated from lower temperature inFig. 9b is consistent with our measurement at high fH2O
suggesting an equivalent rate at water equivalent density. However, the assumption of an unchanged activation energy above the critical tem-perature is not expected as mentioned in the introduction and the predicted value (blue star) is perhaps overestimated. In addition, the basalt glass reacts much more slowly than obsidian. The uncertainties are not reported in the figure: they can reach 25% for the experimental observations (high fluctuation along the surface) and for the predicted value (blue star) it is dependent on the assumption used for the water density and basalt dissolution rate constant. So this conclusion is an interesting kinetic insight but should be taken with caution. It is also worth noting the rate dependence on water fugacity takes a non-ex-pected form with a strong increase of the rates under high pressure. By contrast, the rate dependence with time suggests an expected control by diffusion (linear relationship with t1/2), likely diffusion of water
through the recrystallized layer. 3.3. Gas chemistry
The concentrations of the usual samples components in the
sampling ammonia solutions are significantly higher than the ICP-MS detection limit, the blank of chemicals or the contamination of the sampling cell. They reflect undoubtedly the gas composition inside the reactor. They were converted into gas concentrations using the am-monia/sampled gas mass ratio. The data is chronologically reported in Fig. 10as it was measured run after run. The figure also includes blank experiments (run without sample) carried out before V15 and V18 (see Table 3). Before V13 the sampling method was not optimized (use of NaOH instead of NH4OH), the results are thus less reliable and are not
reported in the figure. Whatever the samples tested (glassy, crystallized, blank) the measured concentrations decreased with time, sampling after sampling, suggesting that we measured a decreasing contamina-tion. An outstanding exception is the run using a fine powder of basalt glass (V18), with a higher sample surface area than the remaining runs. In this run, the three fluid samples were significantly enriched in Na, Mg and Ca, the same elements forming secondary sulfates and showing content variations at the glass slide surface. However, these unusual high concentrations dropped in the successive repeated sampling sug-gesting that we more likely measured an accumulation of these ele-ments in the sampling line rather than a true concentration in the gas. We did not measured a Fe enrichment even though this element is detected in some secondary sulfates (and hornblende) and showed a concentration loss to the glass surface.
Basalt glass
obsidian glass
under op cal microscope
under SEM
Fig. 8. Crossed section of altered obsidian and basalt glass (for comparison) observed under optical microscope and SEM. Samples were altered one week under 590 bars vapor-rich pressure (V23). a): basalt glass with a sharp leached surface layer. b): Obsidian with a recrystallized rim and a modified core. c): small pores (black holes) in the modified obsidian core. d): details under SEM of the recrystallized rim.
0 500 1000 1500 0 5 10 15 20 25 30 a lt e ra o n th ic k n e ss (m ic ro n ) f H2O /MPa
b
470°C, 1 week 0 20 40 60 80 100 0 5 10 15 20 25 30 daysa
470°C, 90 bars, f H2O 6-7 MPa y =0.63 fH2O2 surface reac on > diffusion into the glassdiffusion > surface reac on no
reac on
extrapolated rate from low temperature kine cs
Fig. 9. Dependence of the recrystallized rim thickness of obsidian glass on water fugacity (a) and on elapsed time for fH2O = 6–7 bars (b). Refer to the discussion for
The high concentration of Na in the first reported runs (V13) likely reflects a contamination due to the use of NaOH is the sampling method before V13. This shows how difficult the decontamination of the reactor and sampling device may be. Another example is silica, the initial contamination of which being likely related of previous experiments conducted in this reactor.
4. Discussion 4.1. Transfer in gas
The concentrations of the rock constituents measured in the gas phase (roughly 0.1 to 100 ppm) decreased run after run. This decrease does not seem related to the samples exposed to alteration (blank ex-periments do not distinguish from exex-periments with rock samples) or the conditions of alteration (dry or wet gas), excepted run V18 where we measured a significant increase of Mg, Ca and Na concentration in the gas related to the high surface area of the sample. For the other runs, the regular decrease of gas concentration with time rather sug-gests a contamination from the reactor that decreases with time. Our results nevertheless show that a significant mass transfer occurred. Firstly, the contamination is a mass transfer itself. The measured con-centrations (> 1 ppm Fe, Ca and Na; 0.1 ppm Al and Mg) are also much higher than the sulfates or oxides solubilities in gas as expected from thermodynamic databases (not developed in this paper) with the ex-ception of silica. For silica, the measured concentrations decreased down to values in the order of magnitude of Si(OH)4in H2O-CO2gas
mixture equilibrated with solid silicon oxide (Plyasunov, 2011). We indeed observed the formation of silica spherules in the colder part of the magnetic driver in preliminary runs (Berger and Aigouy, 2011). These lepidospheres are common in volcanic gas and can even be ob-served in the vacuoles of the obsidian sample used in this study. They could be the source of Si contamination. However, we did not observe lower values in dry gas suggesting than the gas composition in our experiments is likely not controlled by equilibrium thermodynamics, or at least not by the solubility products of usual mineral or gas species.
Another evidence of gas transfer is the observation of chemical changes in the reacted samples. The behavior of iron is a typical ex-ample. The formation of iron oxide coating at the surface of olivine in dry gas indicates diffusion of Fe to the olivine surface. This coating may
result from iron accumulation on the surface after release of Si and Mg into the gas (we also observed a loss of silica in the altered obsidian glass at low H2O:CO2ratio,Fig. 2). Alternatively, the Fe-coating at the
olivine surface may also have a contribution from the gas, as well as the crystallization of Fe-hornblende at the surface of reacted obsidian or the formation of iron sulfide during an accidental cooling (V10).
Another evidence of elemental mobility concerns Mg, Ca and Na. These elements showed evidence of migration in the basalt glass at nanometric scale (Fig. 6), likely correlated with the high concentration measured when using glass sample with high surface area. The analysis of the results suggests that these elements were likely deposited in the colder part of the sampled line (after a gas transfer) and were leached during the successive sampling.
The factor promoting the elemental transfer in the gas phase is an open question. The absence of positive effect of CO-enriched gas (run V18bis) discards the assumption of carbonyl complexes as vector of transfer as suggested in Simakin et al. (2016). The most likely ex-planation for the observed transfers is that they are controlled by thermal gradients, with deposition in the colder zones. Even at low concentration, the diffusion and the precipitation kinetics at high temperature are high enough for a significant transfer at the time scale of the week and the space scale of tens of cm.
4.2. Process in dry gas
Alteration in the absence of water might be unlikely given the low dielectric constant of CO2. However, the presence of dipolar molecules
such as SO2or H2S may promote the silicate network depolymerisation.
Furthermore, some alteration phases are present in the basalt samples. Similar toKing et al. (2018), we observed an iron oxide coating on olivine surface, although they detected Mg-sulfate as well. For the glasses in our experiments, the deposition of sulfate minerals and Fe-oxide is observed, likeRenggli and King (2018). Our HR-TEM and XPS observations are consistent with oxidation experiments conducted at high temperature in the 90's.Cook and Cooper (1990)showed from Rutherford backscattering spectroscopy (RBS) and HR-TEM that oxi-dation of iron in a basaltic glass is accompanied by the migration of Ca, Mg and Na and crystalline nucleation of magnesioferrite.Cooper et al. (1996)proposed that CaO and MgO may precipitate at the surface of oxidized glass. Our XPS and HR-TEM observations are fully consistent Fig. 10. Major components of the samples measured in the gas sampling after sampling.
with the chemical process proposed by these studies with the difference that sulfates, rather oxides, form at the surface. The precipitation of CaSO4, MgSO4and Na2SO4by reaction of glasses with SO2gas has been
recognized (see reviews byPalm et al., 2018;Renggli and King (2018); Delmelle et al., 2018). The experimental studies used 1 bar SO2and a
temperature range above the present study. However, the same pro-cesses seem to govern the glass alteration, such as the composition of sulfate salts. The variability of sulfate composition (glauberite, anhy-drite, metathenardite) observed here from one sample to another may be explained by the iron content and Fe2+/Fe3+ratio in the source
material. As pointed byRenggli and King (2018), iron oxidation leads to Fe3+ transfer into tetrahedral coordination with Na+ migration
away from the surface (charge compensation), impeding Na2SO4
for-mation.
The above processes require redox reactions, at least for iron and sulfur. The redox conditions imposed by Ni/NiO buffer are consistent with oxidation of ferric iron although the fO2is too low in our
ex-periment to reflect a direct reaction with di‑oxygen as electron ac-ceptor. Sulfur is present in the gas phase as sulfur dioxide SO2and in
the solid phases as sulfate SO4−−. The conversion of Ca,Mg-silicate to
enstatite + quartz as suggested by Eq. 6 inGilmore et al. (2017)cannot be the cause of SO2oxidation, the reported equations being not
equi-librated in oxygen. The disproportionation of SO2into SO4−−(sulfate)
and Sx(polysulfur) is invoked in SO2-basalt reactions (Zolotov, 2018;
Renggli and King, 2018;Palm et al., 2018). The conversion of CO2into
CO + ½ O2is also a likely candidate for electron transfer and is
ther-modynamically favorable (Zolotov, 2018). Unfortunately we were not able to check whether SO2/Sxor CO2/CO couple controlled the sulfate
formation in our experiments. However,Aveline et al. (2011)reacted basalt glass with pure SO2at 4.4 bar and 460 °C for 3 years. They did
not observe the formation of sulfate suggesting that glass oxidation and the concomitant elemental migrations require another electron ac-ceptor than the sulfur disproportionation. CO2seems to play a role in
these reactions. By contrast,Renggli and King (2018)experimented a variety of minerals and glasses in pure SO2gas under low pressure and
temperatures above 600 °C and observed the formation of sulfate in a CO2free system. Temperature may be critical for the redox reactions
which control the bulk process. In our case, which is close to the tem-perature conditions ofRenggli and King (2018), the reduction of CO2to
CO may be the required electron acceptor reaction. Similarly, in the CO-enriched run (V18bis) iron sulfide is observed rather than oxide or sulfate in response to the more reducing conditions of this run. This is another indication of the role of carbon in these systems. However, the assumption of CO2reduction into CO at the glass surface as electron
acceptor for sulfur dioxide oxidation (as well as iron oxidation within the glass) implies that the sulfur system was not initially in equilibrium with the carbon system. Whatever the explanation, electron transfer is the key process for glass alteration in dry gas. A synthetic view of the chemical reaction occurring at the glass surface is presented inFig. 11. For glasses in dry gas the reported transfers in the glass are similar to Fig. 9inRenggli and King (2018). For olivine, the formation of a re-sidual iron oxide coating supposes the release of silica susceptible to react with the Mg-component of olivine to form enstatite as modeled by Fegley Jr. and Treiman (1992). As King et al. (2018)in similar in-vestigations, we did not observed enstatite suggesting that the excess of silica was rather released into the gas phase (or sequestrated at depth in the crystal) and was not consequently available for a local reaction, or it could be a matter of kinetics.
4.3. Process and kinetics in wet gas
Addition of water to CO2 or Venus-like gas drives spectacular
changes. The olivine surface is covered by secondary or residual fibrous and massive material, the thickness of which being too small for a more detailed characterization. The most important changes were observed for the basalt glass and obsidian where a deeper alteration layer
developed in few days, composed of anorthoclase + hornblende + iron oxides for obsidian and Ca,Na,Mg-sulfate + Fe,Mg-chlor-ites + celadonite for basalt glass (Fig. 11). In the latter case, celadonite, characterized by its 10 Å reflection, is also clearly visible in the crushed bulk sample suggesting its presence below the surface. This zonation of alteration products is typical of hydrothermal alteration (Berger et al., 2014). It is worth noting that under only few bars of water vapor the glass and olivine hydrolysis proceed to a similar manner than in con-densed aqueous fluid, but obviously at a lower rate. The formation of OH-bearing phase in wet gas, clays and amphibole, also raises the question of metastability of these phases in the present-day atmosphere regarding the general question of H2O inventory of Venus. For
amphi-bole,Straub and Burns (1991)proposed that Fe-poor oxyamphibole like hornblende should be stable under dry Venus conditions, unlike the thermodynamic prediction (Fegley Jr. and Treiman, 1992). Here, we tested the metastability of hydrous phase by reacting chlorite-type minerals in dry CO2(Fig. 3). We observed the dehydration of the clays
(collapse of the interlayer equidistance) but not a true desorganisation (persistence of the reflections), hydroxyl groups being likely conserved. By contrast, an equivalent heating in oxidizing terrestrial conditions promotes the destruction of the structure, likely by oxidation of iron. This suggests that phyllosilicates may persist under present-day dry conditions provided the conditions are reducing enough to preserve the redox status of iron in the clay structure.
The most accurate observations were acquired on obsidian glass, that is likelynot a representative material of Venus's surface but is used hereas a proxy of alumino-silicates for a kinetic data processing. The high water pressure tested is out of range for the current Venus con-ditions but may be informative of early Venus or any early terrestrial planets such as Mars or the Earth. For Mars, the question of clay for-mation in its early history is addressed inCannon et al. (2016).
The alteration kinetics of silicates depends on many factors influ-encing the chemistry or accessibility of the reaction interface. For glasses, the development of deep alteration layers is likely the first order parameter for long-time reaction (Berger et al., 1994) even if metal rich nanometric surface layer also plays a significant role (Leturcq et al., 1999). This last process may explain the higher altera-tion rate of obsidian (Fe-poor) when compared to basalt glass (Fe-rich). In the present study, the alteration in wet gas presents similar features with alteration in water at lower temperatures: non-linear dependence on time, rateglasses> rateolivine> rateCpx,plagioclase, hydrolysis of the
silicate network by water (demonstrated by fH2O dependence). The
reaction kinetics in water is generally expressed through the framework of the Transition State Theory (TST) that postulates that the bulk rate is controlled by the decomposition of an activated complex at the mineral-solution interface. The dismineral-solution rate, theoretically proportional to the Gibbs free energy change, may be more sophisticated when one con-siders the catalytic or inhibitor effect of electrolytes (Oelkers et al., 1994), or several activated complexes (Berger et al., 2002). However, the empirical application of TST to overall reaction is questioned by other approaches (Luttge, 2006;Pollet-Villard et al., 2016). Whatever the formalism, the observed rate law dependence on temperature generally follows an Arrhenius law, at least in the commonly applied 20–300 °C temperature range. At higher temperatures, namely super-critical conditions, we postulate that the silicate alteration is still the result of a nucleophilic attack by the polarized water molecule. Thus, the overall rate is likely dependent on water density, as observed in our experiments. In other words, it is a function of the surface concentration of an activated complex formed by the network-forming oxides and the water molecules, according to Eq.(1) for the case of silica. In this equation we assume that one H2O molecule generates two Si-OH group.
^SieOeSi^ + H2O = 2^SieOH (1)
Considering rather a bulk dissolution reaction (still for silica), the balanced equation requires two water molecules for the entire
dissolution according Eq. (2), and a complex order of reaction with respect to fH2O is expected.
SiO2+ 2 H2O = H4SiO4 (2)
Although our experiments were not designed in order to investigate detailed surface reactions, the empirical fit of the data presented in Fig. 9b is consistent with a two-order reaction in most of fH2O range.
We distinguished three domains. At very low fH2O, a threshold H2O
concentration seems required to initiate the reaction (no alteration in V12 and V14). Above this value and up to fH2O ≈ 25 MPa (i.e. 590 bar
H2O pressure), the data are well fitted by Eq.(3)which formalizes a
two-order reaction.
y = 0.63 fH2O2R2= 0.96 where y is the altered layer thickness in mm
(3) Under extreme water pressure, Eq.(3)underestimates the measured thickness. We attribute this discrepancy to the modification of the glass prior the recrystallization (Fig. 8) suggesting another kinetic control. Note that in this kinetic approach we neglected a possible effect of the chemical affinity of reaction that we considered as being in a steady-state.
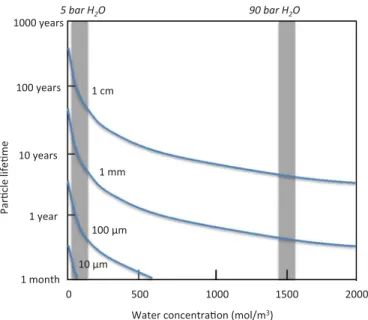
Alternatively to the previous TST-like model, we focused on the time-dependence of the shell thickness. The parabolic relationship be-tween the obsidian alteration depth and the elapsed time (Fig. 9b) suggests a diffusion controlling process, likely through the altered layer. This effect may be taken into account with a shrinking-core formalism. A mathematical approach for describing coupled surface reaction and passivation is contained in the shrinking-core model developed in the catalysis literature (e.g.Wen, 1968). This model, initially developed for gas-solid interactions, combines the reaction rates at the reaction in-terface and the gas diffusion rates through the altered products. In-itially, the reaction takes place at the outside surface of the particle, but as the reaction proceeds, the reacting surface will move inside, leaving beneath the product layer. It has been successfully used byWhite et al.
(1994)to describe the topotactic transformation of magnetite to ma-ghemite, for example. A more comprehensive review is available in King et al. (2018). In our case, assuming a classic first order of reaction and a high diffusion rate in gas outside the alteration layer, the altered layer thickness is related to time through an original expression given in Eq.(4). Derivation of this expression is given in the Appendix. y = −DAM/3 kSρ+ DACH2OM/3 ρ√(1/(kSCH2O)2+ 6 ρt/DACH2OM)
(4) where y is the altered layer thickness in m, DAthe diffusion constant
through the altered layer in m2/s, t the elapsed time in s, C H2Othe
concentration of gaseous reactant (here H2O in mol/m3), ρ is the
den-sity in kg/m3, M the molar weight in mole SiO
2/m3and kSthe rate
constant in m/s/(molH2O/m3(g)).
DA and kS were estimated to be 1.1 × 10⁻¹³m2·s−1 and
5.2 × 10⁻¹⁴m·s−1 (mol
H2O·m(g)−3), respectively, by regressing the
data reported inFig. 9b. The diffusion coefficient obtained here in the recrystallized rim is four orders of magnitude over than the diffusion coefficient of cations (8.7 × 10⁻¹³cm2·s−1 for Ca++) in a rhyolitic
glass at 800 °C reported byAyris et al. (2013). That means that in wet atmosphere the recrystallized rim progresses much faster than the ion diffusion and obliterates the chemical transfer in the glass (right box in Fig. 11). Note that ksin the shrinking-core formalism, expressed in m/s/
(molH2O·m(g)−3), cannot be compared to the rate constant in the TST,
expressed in mol·m−2·s−1, because these constants are not based on the
same definition. This is also reflected in their respective units. In a second step, the increase of altered layer thickness with CH2Ois
mod-eled using the previous constants. The values of CH2Oand y for the 7
selected runs are reported inTable 5with the parameters of the ex-periments.
The calculated values are in the order of the observed rim thickness except at low and high fH2O. The low dielectric constant of the gas at
low water pressure may explain the absence of network hydrolysis. At high pressure, the differences between the observed and calculated Magnesioferrite (MgFe3+ 2O4)