OATAO is an open access repository that collects the work of Toulouse
researchers and makes it freely available over the web where possible
Any correspondence concerning this service should be sent
to the repository administrator:
[email protected]
This is a Publisher’s version published in:
http://oatao.univ-toulouse.fr/25219
To cite this version:
Kouidri, Amel and Meribai, Amel and Nouani, Abdelouaheb and Mohand
Bellal, Mouloud and Zebib, Bachar and Merah, Othmane
Effect of feed
supply on milk yield and lipid composition in Algerian dairy cows. (2019)
Bulgarian Journal of Agricultural Science, 25 (1). 134-140. ISSN 1310-0351
Bulgarian Journal of Agricultural Science, 25 (No 1) 2019, 134–140
Effect of feed supply on milk yield and lipid composition in Algerian
dairy cows
Amel Kouidri
1, Amel Meribai
2, Abdelouaheb Nouani
2,3, Mouloud Mohand Bellal
2, Bachar Zebib
4,
Othmane Merah
5,6*1Département d’Agroalimentaire, Université Saad Dahleb de Blida, Blida 09000, Algeria
2 Laboratoire de Technologie alimentaire et Nutrition humaine, Ecole Nationale Supérieure Agronomique, Algiers, Algeria
3Laboratoire de Technologie alimentaire, Université M‘hamed Bougara, Boumerdès, Algeria 4Laboratoires Agronutrition SAS, 3 allée de l’Orchidée, 31390 Carbonne, France
5Laboratoire de Chimie Agro-industrielle (LCA), Université de Toulouse, INRA, INPT, Toulouse, France 6Université Paul Sabatier, IUT A, Département Génie Biologique, 24 rue d’Embaquès 32000 Auch, France
*Corresponding author: [email protected]
Abstract
Kouidri, A., Meribai, A., Nouani, A., Bellal, M. M., Zebib, B. & Merah, O. (2019). Effect of feed supply on milk yield and lipid composition in Algerian dairy cows. Bulgarian Journal of Agricultural Science, 25(1), 134–140
This study aims to compare the yield and lipid composition of milk in dairy cows depending on the nature of distributed feed supply as concentrate. The Impact of feed supply was evaluated by introduction of maize and soya meal (C1), brewer’s spent grains (C2) and distiller’s dried grains with solubles (C3) into feed regime of Holstein and Montbeliarde dairy cows. Seventy-two Holstein and Montbeliarde dairy cows were followed, in real farming conditions, for a period of 14 weeks. The introduction of cereals stimu-lated milk production and induced a signifi cant change in its fatty acid composition. C2 and C3 diets showed a rise in unsaturated fatty acids in milk regardless of the cow breed, while diet C1 had no signifi cant effect on milk fat composition. The incorporation of concentrate with higher lipid content in the diet of dairy cows increases milk production and modifi es milk fat quality.
Keywords: dairy cows; feed supply; concentrate feed; milk production; fatty acids
Abbreviations: BC: Butyric content; BSG: brewer’s spent grain; C1: concentrate 1 (maize and soya meal); C2:
concentrate 2 (brewer’s spent grains); C3: concentrate 3 (distiller’s dried grains with solubles); DDGS: distiller’s dried grains with solubles; DDE: degreased dry extract; FAs: fatty acids; SFAs: soluble fatty acids; MUFAs: monounsaturated fatty acids; PUFAs: polyunsaturated fatty acids; UFAs: unsaturated fatty acids; H: Holstein; M: Montbeliarde; PC: protein content, TDE: total dried extract; TF: total fat
Introduction
In order to improve the quality and quantity of milk, ani-mal feeds have become an unavoidable factor in the inten-sifi cation of animal production. This feeding of dairy cattle has a predominant infl uence on the quantitative as well as
qualitative production of milk intended for industrial uses. To date, concerns about productivity and biological effec-tiveness of the processing of raw materials into marketed animal products have become important. Also, interest in the quality of the products is of considerable importance today.
of the rations of dairy cows concentrate feed based on cereal or oil crop seeds on milk yield (Petit and Alary, 1999; An-drade and Schmidely, 2006; Dos Santos et al., 2011, Bernard et al., 2016). Other studies have focused on the effect of lipid feed in ruminant feeding and its impact on the quality of the cheese produced from the milk obtained (Sanz-Sampelayo et al., 2002; Inglingstad et al., 2016). Recently, distiller’s dried grains with solubles (DDGS), by-products from the alcohol industries (beer and bioethanol), have been usually sold as a high protein livestock feed and are used to feed ruminants. The rapid adoption of these raw materials is a challenge for the animal feed industry (Cozannet et al., 2010). However, the use of residues from the processing of raw plant materi-als for animal feed and its effect on milk quality are poorly documented in the literature.
Algeria has large amounts of crop and agro-industrial residues whose optimal use could reduce dairy cow feed costs. These include brewer’s spent grain (BSG), a most im-portant by-product of the brewing industry which represents 85% of the total by-products.
In this context, barely spent grain was used in this work as a feed supplement in the feed concentrate of two cow breeds, Holstein (H) and Montbeliarde (M). The effect of the nature of the concentrate was investigated with intensive farming conditions in a famed Algerian cow farm. The experimental period was 14 weeks. This study aims to compare the pro-duction and lipid composition of milk from different dairy cow feed diets containing corn and soybean grain meal (C1), brewer’s grain (C2) or corn distiller’s grains with solubles (C3) at a concentration of 30% in the feed concentrate.
Materials and Methods
Choice of livestock
In the absence of an experimental farm, the incorpora-tion of concentrated feed C1, C2 and C3 in the diet was considered under actual farming conditions prevailing in the selected farm in Beni Mapuche (36° 30′ North and 4° 47′ East), located near Bejaia (200 km east of Algiers, Algeria). A suffi cient number of Holstein (H) and Montbeliarde (M) dairy cows (72 cows) were selected for this study: 36 cows of each breed distributed in three batches corresponding to the three diets.
Distribution and composition of feed concentrate The three batches of cows received the same basic diet consisting of hay and straw (Tables 1 and 2). A quantity of 10 kg hay/day/cow was distributed in two doses (5 kg in the morning, 5 kg in the evening) while 6 kg straw/day/cow was distributed in one in the evening. This basal diet was
supple-mented by 12 kg/day/cow of feed concentrate (C1, C2 or C3), distributed twice a day (5 kg in the morning, 7 kg in the evening). The distribution level of concentrated feed (12 kg/day/cow) seems acceptable, given the profi le of animal experimentation set (age and weight).
The corn distiller’s grains used in the test were provided by the U.S. Grains Council and were stored in a suitable han-gar at the farm level. They were kept in the open air in the warehouse for ventilation and to avoid fermentation to keep their characteristics.
The brewer’s grains used in our experiments were pro-vided by the Star Brewery of Algeria (B.S.A.), located in the industrial area of El-Kseur Wilaya in Bejaia (east Algeria). Grain was supplied each week to prevent deterioration by the phenomenon of fermentation due to the high instability of this food. The livestock was watered three to four times a day.
Monitoring of milk production
The work included tracking the overall and daily milk production for 14 weeks, from the morning and evening milking (morning at 7 am and evening at 5 pm) for all cows.
Sampling and analysis
Samples were taken each week from individual milks of the three batches (C1, C2 and C3), from the morning milking. The samples were collected in clean 1 L contain-ers and stored directly at 4°C. They were labeled for their identifi cation (sampling date, cow number) and transported to the laboratory where they were the subject of a series of analyzes.
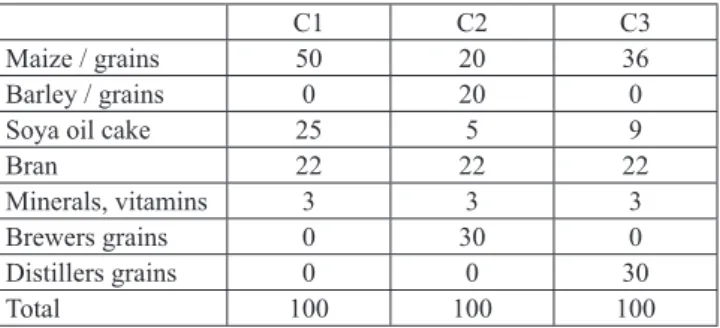
Table 1. Feed concentrates composition (%)
C1 C2 C3
Maize / grains 50 20 36
Barley / grains 0 20 0
Soya oil cake 25 5 9
Bran 22 22 22
Minerals, vitamins 3 3 3
Brewers grains 0 30 0
Distillers grains 0 0 30
Total 100 100 100
Table 2. Results of overall analysis of the feed concen-trate composition (%)
Sam-ples
Humidity Proteins Fat Starch Calcium Phos-phorus C1 11.68 20.50 5.04 36.82 0.72 0.78 C2 11.45 20.16 5.31 28.91 0.70 0.76 C3 11.95 20.87 6.76 29.32 0.73 0.78
The total dry extract (TDE) was determined by desicca-tion in the presence of an infrared humidity analyzer. Total protein (TP) was obtained after measuring the total amount of nitrogen following Kjeldahl digestion (AFNOR, 1986), while total fat (TF) was measured using the Gerber method (AFNOR, 1986). The conversion factor (0.945) allowed us to deduct the proportion of fatty acids (FAs) in milk fatty material (Paul and Southgate, 1978).
The lipids of different samples were extracted according to the method developed by Luna et al. (2005). These extracts were used for determination of FA composition using GC. This deter-mination was based on the solubility of FAs in tertbutylmethyl ether (TBME; ME0552, Scharlau) and their transformation into fatty acid methyl esters (FAME; norm ISO 5509, 1990). A GHP fi lter of 0.45 μm diameter was used to fi lter samples of 2 mL each. Fifty microliters of 0.2 M trimethylsulfonium hydroxide in methanol (Macherey-Nagel) was added to 100 μL of the fi l-trate (Merah et al., 2012; Roche et al., 2016). From this mix, 1 μL was used for injection into a GC-3800 chromatograph (Varian) with an FID detector. The GC was equipped with a CP Select CB 50 m capillary column (0.25 mm diameter). The initial temperature was held at 185°C for 40 min, augmented at a rate of 15°C/min to reach 250°C and then held there for 10 min. The injector and detector temperatures were maintained at 250°C and 300°C, respectively. The FAME concentrations were determined by comparison with the retention times of a known standard FAME mixture (FAME rapeseed oil reference mix, Supelco, USA), used as an external standard.
Statistical analysis
All data were statistically analyzed. The standard vari-ance was obtained with an ANOVA I criterion, using Statis-tica® version 6.1 (StatSoft, France). If ANOVA results were
signifi cant, Duncan’s test was utilized to compare average means. For this comparison, only one signifi cant fi gure of 5% was retained.
Results and Discussion
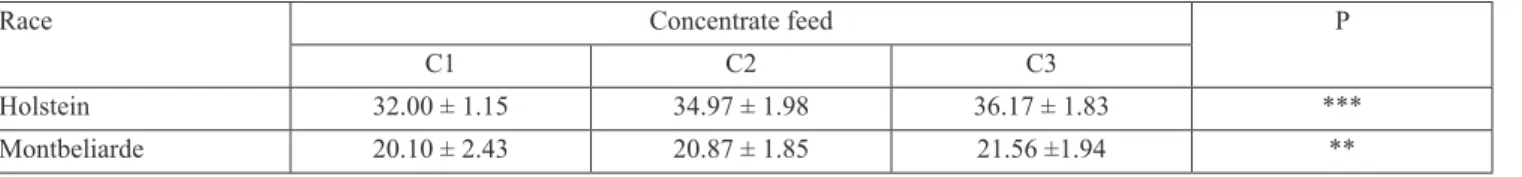
Changing the feed concentrate appears to infl uence the milk production level (Table 3). Consequently, through the
14 week experiment, the introduction of DDGS (distiller’s and brewer’s) induced an improved milk production, higher in batches C3 and C2 than in batch C1, whatever the cow breed (Table 3). Otherwise, as expected, Holsteins produced more milk than Montbeliarde cows (Table 3).
Moreover, the evolution of milk production curves in the 14 week experiment was plotted for each experimental group (Figure 1). There was a difference in the level of produc-tion between the two cow breeds (Figure 1). This output gap between the two breeds seems to have greater potential for initial production for Holstein cows. The same increasing trend was found for the three batches (C1, C2 and C3) but at different levels of production. This result can be explained by the growth performance of the cows (age, weight) with time. According to Fournier (2008), distiller’s grains can re-place a signifi cant portion of corn and protein supplement used in the diet of cows, which reduces the level of starch and non-structural sugars. These two factors, in addition to the high fi ber content of DDGS, help to reduce the incidence of rumen acidosis.
In addition, it is interesting to note that throughout the experimental period, the C3 concentrate was more effective in terms of milk production compared to the other two con-centrates (C1 and C2) for both cow breeds studied. This ef-fi ciency increased with the production potential of cows.
However, a previous study compared the milk production in dairy cows fed a diet containing corn distiller’s grains with
Table 3. Average of milk production in dairy cows (liter per day) at the end of the experimental period, depending on the nature of the concentrate
Race Concentrate feed P
C1 C2 C3
Holstein 32.00 ± 1.15 34.97 ± 1.98 36.17 ± 1.83 ***
Montbeliarde 20.10 ± 2.43 20.87 ± 1.85 21.56 ±1.94 **
P: Statistic probability; ***: P < 0,001 ; **: P < 0,01; C: Concentrate
Fig. 1. Evolution of the average milk production per cow depending on the nature of the concentrate for Holstein
solubles or triticale distiller’s grains with solubles at a con-centration of 21% of the dietary dry product (Greter et al., 2008). No signifi cant differences between sources of distill-er’s grains with solubles in terms of milk production or milk composition were observed, although the concentrations of blood, urea, nitrogen and some amino acids were higher with corn distiller’s grains with solubles. Triticale distiller’s grains with solubles can, unlike brewer’s grains, replace corn distiller’s grains with solubles in the diet of lactating cows, without any negative impact on milk production.
The intake of grains (C2 and C3) did not signifi cantly vary the pH and degreased dry extract (DDE) of milk from the two breeds, Holstein and Montbeliarde (Table 4). The pH is always compliant with values ranging from 6.6 to 6.8, as already reported (Alais, 1984). Conversely, the results presented in Table 3 indicate that there was a highly signifi -cant difference of TDE only in the Holstein breed between batches C1, C2 and C3 (Table 5). It increased with the addi-tion of DDGS. It appears that only the TDE of batch C1 was signifi cantly different from the other batches (Table 5). Ac-cording to Croguennec et al. (2008), the increase or decrease of TDE is directly related to the particular variation of total protein and fat.
The effect of the concentrate on the protein content was not signifi cant. Despite this, there was a difference between the three batches C1, C2 and C3 (Table 4). The nature of the energy effect on the protein content is the subject of confl ict-ing results, even if we admit that diets high in starch gener-ally lead to an increase in protein content, at least in extreme cases (Sutton, 1989). Furthermore, the concentrated feeds C2 and C3 led to a signifi cantly higher butterfat rate than that obtained by C1 concentrate (Table 4) whatever the cow breed.
The fat content is a relatively variable standard from one
day to another, because it is strongly linked to trade. Its level ranges from 1% to 10% between the beginning and end of the trade. However, it is one of the milk solid elements that is most strongly and quickly changed by nutrition (Holden and Coulon, 1980). According to Rulquin et al. (2007), responses of the fat content to a glucose supplement (digestible starch similar to glucose) are always negative and fat percentage decreases signifi cantly. The role of glucose when the cereal is maize concentrate is more important (Sutton et al., 1980), then, it could explain a drop in fat content (Rulquin et al., 2007). The proportion of rich corn starch was much higher in food concentrate C1 compared to C2 and C3, which could be responsible for the signifi cant drop in fat content in the batch (C1). However, previous studies found very interesting vari-ations in the concentration of certain compounds synthesized by the animal, depending on its power (Bugaud et al., 2001), which could also help to explain some of the differences ob-served, particularly the composition of the milk fat in FAs (length of the carbon chain and degree of unsaturation), highly dependent on the feed (Joy et al., 2014; Bernard et al., 2016; Inglingstad et al., 2016). These results have directed us to analyze the milk fats by GC in order to explain the rise in fat and FA content recorded after the introduction of grains. On the other hand, milk FAs, which are highly variable with livestock feed in the short term, are an important component of its nutritional quality for humans (Maltz et al., 2013).
The FA profi le of the milk fat was strongly modifi ed by concentrated feed (Table 5). Compared to batch C1, the milk of batches C2 and C3 had reduced saturated FA content of 1.35% and 1.78%, respectively. This reduction occurred at the expense of increased, albeit statistically insignifi cant, unsaturated FA content. In contrast, a signifi cant increase of linoleic acid was observed for both C2 and C3 batches, whatever the cow breed (Table 5). Moreover, batches C2 and Table 4. Results of various milk parameters, depending on the nature of the concentrate for Holstein and Montbeliarde breeds
Race Holstein Montbeliarde
Feed concentrate C1 C2 C3 C1 C2 C3 pH 6.68±0.08 6.65±0.07 6.83±0.40 6.68±0.07 6.63±0,05 6.63±0.05 Acidity (°D) 16.10±0.55 16.93±0.99 16.67±0.58 15.50±0.94 16.50±0.84 16.33±0.58 Density 1.031±0.000a,b 1.032±0.001a 1.030±0.000b 1.030±0.001 1.031±0.001 1.031±0.000 TDE (g/l) 116.05±5.02b 124.54±2.81a 121.93±3.90a 121.63±9.30 129.46±2.73 128.23±1.14 DDE (g/l) 83.47±4.21 85.80±3.29 80.72±3,99 86.42±6.21 90.65±2.97 87.80±0.98 PC (g/l) 31.20±0.62 31.76±1.78 32.17±0.30 32.80±1.22 31.92±0.51 31.12±2.47 BC (g/l) 32.58±1.14c 38.74±1.70b 41.22±0.51a 35.21±3.46b 38.82±0.57a 40.43±0.15a FAs (g/l) 30.79±1.08c 36.61±1.61b 38.95±0.48a 33.27±3.27b 36.66±0.52a 38.21±0.14a
On each line, and each race, the values (mean ± standard deviation) affected by different letters are signifi cantly different (P <0.05), Duncan test. No letter a, b and c on the same line indicates no signifi cant difference (P> 0.05). The letter a corresponding to the highest average adjusted.
C3 had higher ω6/ω3 and C18:1/C18 ratios (Table 5), due to an increase in the secretion of unsaturated FAs, offset by a decrease in the secretion of saturated FAs.
Food used to vary widely, in particular milk FAs; it should be noted here that saturated FAs, representing 66% of total milk fats, are generally recognized as atherosclerotic risk factors, including increased total cholesterol and LDL cholesterol (Plamquist et al., 1993; Chilliard et al., 2001). MUFAs (oleic acid) and PUFAs may help reduce the risk of atherosclerosis, including increasing the HDL levels (Merah et al., 2012).
Furthermore, milk FAs have two sources: the blood-stream and de novo synthesis in the udder. The FAs taken in or synthesized can be saturated at udder level, including FAs in the blood such as triglycerides or non-esterifi ed FAs. FAs taken from the blood include a portion of C14:0 and C16:0 and all of the milk FAs with 18 carbons. The FA sampling rate of triglycerides by the mammary gland of cows increases with their concentration in the plasma (Akraim, 2005).
Short- and medium-chain FAs (C4 to C12) and some C14 and C16 FAs are synthesized by mammalian cells from
ac-etate which is produced by ruminal fermentation (Sauvant et al., 2006; Rulquin et al., 2007). In addition, PUFAs are not synthesized by ruminants; their concentration in milk de-pends essentially on input from the diet (Gulati et al., 1999). One of these PUFAs is linoleic acid (C18:2) which is the most represented. Its concentration was higher in the milk of batches C2 and C3 than in the milk of batch C1 (Table 5). This is probably a result of the high content of fat grains rich in PUFAs (almost 15% of dry matter) which is in line with results observed previously (Andrade and Schmidely, 2006; Bernard et al., 2016; Inglingstad et al., 2016). Further research is needed to confi rm these trends.
Furthermore, the grains increased the linoleic acid con-tent of the milk (p < 0.01) more strongly than that of ac-ids C18:1 and C18:3. The linoleic acid content in milk FAs is generally between 2% and 3%. While rations are enriched with seeds or oils rich in linoleic acid, this percentage does not exceed 3-4%; increases compared to the control diet are rarely greater than 1.5%. It is therefore clear that increased hydrogenation of linoleic acid in the rumen strongly limits its incorporation into FAs in milk (Chilliard et al., 2001; In-Table 5. Change in fatty acid composition of milk fat according to the nature of the concentrate (%)
Fatty acids Holstein Montbeliarde P
C1 C2 C3 C1 C2 C3 C4:0 2.86 ± 0.04 2.44 ± 0.01 3.13 ± 0.03 2.79 ± 0.02 2.35 ± 0.04 2.54 ± 0.06 ** C6:0 1.93 ± 0.02 1.52 ± 0.01 2.23 ± 0.02 1.92 ± 0.01 1.49 ± 0.01 1.86 ± 0.01 * C8:0 1.13 ± 0.01 1.20 ± 0.01 1.42 ± 0.01 1.13 ± 0.00 1.22 ± 0.01 1.45 ± 0.01 NS C10:0 2.34 ± 0.00 2.98 ± 0.05 3.10 ± 0.06 2.29 ± 0.01 3.02 ± 0.05 3.28 ± 0.03 * C12:0 2.73 ± 0.01 3.95 ± 0.05 3.29 ± 0.02 2.65 ± 0.08 4.05 ± 0.06 4.03 ± 0.04 * C14:0 9.59± 0.09 10.60 ± 0.06 11.33 ± 0.06 9.58 ± 0.04 10.45 ± 0.03 10.64 ± 0.03 NS C16:0 29.62 ± 0.21 27.60 ± 0.48 24.91 ± 0.07 29.60 ± 0.37 27.65 ± 0.54 26.06 ± 0.44 * C18:0 11.86 ± 0.41 10.75 ± 0.90 11.33 ± 0.38 11.96 ± 0.65 10.72 ± 0.67 10.55 ± 0.40 NS Others 4.84 4.41 4.26 5.07 4.75 4.93 -SFAs 66.89 ± 0.78 65.47 ± 0.47 65.00 ± 0.37 67.00 ± 0.16 65.71 ± 0.21 65.33 ± 0.14 NS C16:1 1.54 ± 0.07 1.60 ± 0.04 1.58 ± 0.06 1.57 ± 0.07 1.63 ± 0.05 1.59 ± 0.06 NS C18:1 25.85 ± 0.42 26.25 ± 0.61 26.65 ± 0.31 25.83 ± 0.38 25.89 ± 0.24 25.95 ±0.43 NS Others 2.10 2.29 2.28 1.96 2.34 2.42 -MUFAs 29.49 ± 0.32 30.14 ± 0.48 30.51 ± 0.44 29.35 ± 0.22 29.75 ± 0.10 29.96 ± 0.40 NS C18:2 2.65 ± 0.28 3.25 ± 0.06 3.31 ± 0.11 2.68 ± 0.61 3.31 ± 0.17 3.58 ± 0.34 NS C18:3 0.96 ± 0.09 1.14 ± 0.05 1.15 ± 0.06 0.98 ± 0.13 1.12 ± 0.11 1.13 ± 0.08 * PUFAs 3.61 ± 0.46 4.39 ± 0.02 4.46 ± 0.06 3.65 ± 0.93 4.43 ± 0.40 4.70 ± 0.52 NS UFAs 33.10 ± 0.78 34.53 ± 0.47 34.97 ± 0.38 33.01 ± 1.15 34.18 ± 0.37 34.67 ± 0.13 NS ω6/ω3 2.76 2.85 2.88 2.73 2.95 3.17 C18:1/C18 2.18 2.44 2.35 2.16 2.42 2.46 * ***: P < 0.001; **: P < 0.01; *: P < 0.05; NS: P > 0.05
glingstad et al., 2016). In addition, an increased proportion of linoleic acid in dairy products is not in itself an objective, insofar as improving the nutritional value of these products requires an increase in the linoleic/linolenic ratio (Chilliard et al., 2001; Bernard et al., 2016). The ω6/ω3 ratio (C18:2/ C18:3) was modifi ed by the intake of grains, and there was an increase in the C2 and C3 batches compared to batch C1 (Table 5).
It is also desirable to increase the C18:1/C18 ratio to reduce the hardness of butter, and to improve its nutritional quality, in particular to limit atherogenic risk in humans. This report is regulated by both the respective availability of these two FAs, for the activity of mammary desaturase, and the factors that modulate the activity (availability of PUFAs) (Chilliard et al., 2001; Andrade and Schmidely, 2006; Bernard et al., 2016).
Meanwhile, the C18:1/C18 ratio was increased in batches C2 and C3 compared to batch C1, 2.43 and 2.40, respective-ly, suggesting increased activity of delta-9 desaturase which converts stearic acid to oleic acid (Baumgard e al., 2001).
BSG and DDGS are potential sources of energy and pro-tein for dairy cows. Their use would reduce the large amounts of grain and oilseed meal that some countries are forced to import to meet the needs of their livestock. To this end, and in comparison with concentrated feed containing corn and soybean meal, the introduction of grains (brewery and dis-tillery) does not infl uence the normal production trends over time but rather infl uences the amount produced by driving a greater improvement with distiller’s grains. This favorable effect on milk production was more pronounced in the early part of the experimentation period, the highest production levels achieved by cows of the Holstein breed.
Moreover, the introduction of DDGS into the diet of dairy cows was also accompanied by very signifi cant changes in the total solids, fat and FA content.
The FA profi le of milk was strongly infl uenced by diet. Compared to batch C1, batches C2 and C3 had reduced lev-els of saturated FAs, known as atherosclerosis risk factors for humans, and higher levels of unsaturated FAs, especially linoleic acid which improves the nutritional quality of milk. These are not synthesized by ruminant tissues, so that their concentration in the milk is highly dependent on food in-take, primarily related to the proportion of fat provided by the grains. These PUFAs at high concentrations inhibit the de novo lipogenesis of saturated FAs in the mammary cells.
Conclusions
Concentrates are potential sources of energy and protein for dairy cows. They have infl uenced positively both milk
production and fatty acid composition regardless of the cow breed.
Moreover, the introduction of concentrates in the diet of dairy cows was accompanied also by very signifi cant chang-es in the total solids content, the fat content and the fatty acid, which improves nutritional quality of milk.
References
Andrade, P. V. D., & Schmidely, P. (2006). Infl uence of
percent-age of concentrate in combination with rolled canola seeds on performance, rumen fermentation and milk fatty acid composi-tion in dairy goats. Livestock Science, 104(1-2), 77-90.
Akraim, F. (2005). Effet du traitement thermique des graines de lin
sur la biohydrogénation ruminale des acides gras polyinsaturés et la qualite de la matière grasse du lait de vache (Doctoral
dis-sertation, Institut National Polytechnique de Toulouse).
Alais, C. (1984). Science du lait et principe des techniques laitières.
4th ed, Sepaic, Paris, 814 p.
Baumgard, L. H., Sangster, J. K., & Bauman, D. E. (2001). Milk
fat synthesis in dairy cows is progressively reduced by increas-ing supplemental amounts of trans-10, cis-12 conjugated lin-oleic acid (CLA). The Journal of Nutrition, 131(6), 1764-1769.
Bernard, L., Toral, P., Rouel, J., & Chilliard, Y. (2016). Effects
of extruded linseed and level and type of starchy concentrate in a diet containing fi sh oil on dairy goat performance and milk fatty acid composition. Animal Feed Science and Technology,
222, 31-42.
Bugaud, C., Buchin, S., Coulon, J. B., Hauwuy, A., & Dupont, D. (2001). Infl uence of the nature of alpine pastures on plasmin
activity, fatty acid and volatile compound composition of milk.
Le Lait, 81(3), 401-414.
Chilliard, Y., Ferlay, A., & Doreau, M. (2001). Contrôle de
la qualité nutritionnelle des matières grasses du lait par l’alimentation des vaches laitières: acides gras trans, polyinsat-urés, acide linoléique conjugué. INRA Productions Animales,
5(14), 323-335.
Cozannet, P., Lessire, M., Métayer, J. P., Gady, C., Primot, Y., Geraert, P. A., Le Tutour, L., Skiba, F. & Noblet, J. (2010).
Valeur nutritive des drêches de blé et de maïs pour les volailles.
Productions Animales, 23(5), 405-414.
Croguennec, T., Jeantet, R., & Brulé, G. (2008). Fondements
physicochimiques de la technologie laitière. Techniques &
Documentation – Lavoisier, 2nd ed., Paris, 160 p.
Dos Santos, W. B. R., Santos, G. T. D., da Silva-Kazama, D. C., Cecato, U., De Marchi, F. E., Visentainer, J. V., & Petit, H. V. (2011). Production performance and milk composition of
grazing dairy cows fed pelleted or non-pelleted concentrates treated with or without lignosulfonate and containing ground sunfl ower seeds. Animal Feed Science and Technology, 169(3-4), 167-175.
Fournier, A. (2008). Drêches pour vaches: Il est intéressant
d’adopter cet aliment dans la ration de son troupeau laitier. Mais pas n’importe comment. Le Bulletin des Agriculteurs, Avril 2008, 15-20.
Greter, A. M., Penner, G. B. & Davis, E. C. (2008). Incidence
du remplacement des drêches de distillerie de maïs sèches par des drêches de distillerie de triticale sèches sur la production laitière et la concentration des métabolites plasmatiques des vaches laitières. Rev. Can. Sci. Anim., 88, 129-132.
Gulati, S. K., Ashes, J. R. & Ascott, T. W. (1999).
Hydrogena-tion of eicosapentaenoic and docosahexaenoic acids and their incorporation into milk fat. Anim. Feed Sci. Technol., 79, 57-64.
Gulati, S. K., Ashes, J. R., & Scott, T. W. (1999). Hydrogenation
of eicosapentaenoic and docosahexaenoic acids and their incor-poration into milk fat. Animal Feed Science and Technology,
79(1-2), 57-64.
Hoden, A., & Coulon, J. B. (1991). Maîtrise de la composition du
lait: infl uence des facteurs nutritionnels sur la quantité et les taux de matières grasses et protéiques (1). INRA Productions
animales, 4(5), 361-367.
Inglingstad, R. A., Eknæs, M., Brunborg, L., Mestawet, T., De-vold, T. G., Vegarud, G. E., & Skeie, S. B. (2016). Norwegian
goat milk composition and cheese quality: The infl uence of lip-id supplemented concentrate and lactation stage. International
Dairy Journal, 56, 13-21.
Joy, M., Ripoll-Bosch, R., Sanz, A., Molino, F., Blasco, I., &
Ál-varez-Rodríguez, J. (2014). Effects of concentrate supplemen-tation on forage intake, metabolic profi le and milk fatty acid composition of unselected ewes raising lambs. Animal Feed
Science and Technology, 187, 19-29.
Luna, P., Juárez, M., & De la Fuente, M. A. (2005). Validation
of a rapid milk fat separation method to determine the fatty acid profi le by gas chromatography. Journal of Dairy Science,
88(10), 3377-3381.
Maltz, E., Barbosa, L. F., Bueno, P., Scagion, L., Kaniyamat-tam, K., Greco, L. F., De Vries, A. & Santos, J. E. P. (2013).
Effect of feeding according to energy balance on performance, nutrient excretion, and feeding behavior of early lactation dairy cows. Journal of Dairy Science, 96(8), 5249-5266.
Merah, O., Langlade, N., Alignan, M., Roche, J., Pouilly, N., Lippi, Y., Vear, F., Cerny, M., Bouniols, A., Mouloungui, Z.
& Vincourt, P. (2012). Genetic analysis of phytosterol content
in sunfl ower seeds. Theoretical and Applied Genetics, 125(8), 1589-1601.
Palmquist, D. L., Beaulieu, A. D., & Barbano, D. M. (1993).
Feed and animal factors infl uencing milk fat composition1.
Journal of Dairy Science, 76(6), 1753-1771.
Paul, A. A. & Southgate, D. A. T. (1978). The composition of
foods. H.M. Stationery Offi ce, 4th ed., London, 417 p.
Petit, H. V., & Alary, S. (1999). Milk Yield and Composition of
Dairy Cows Fed Concentrate Based on Naked Oats1. Journal
of Dairy Science, 82(5), 1004-1007.
Roche, J., Mouloungui, Z., Cerny, M., & Merah, O. (2016).
Fat-ty acid and phytosterol accumulation during seed development in three oilseed species. International Journal of Food Science
& Technology, 51(8), 1820-1826.
Rulquin, H., Hurtaud, C., Lemosquet, S., & Peyraud, J. (2007).
Effet des nutriments énergétiques sur la production et la teneur en matière grasse du lait de vache. INRA Productions animales,
20(2), 163-176.
Sanz-Sampelayo, M. S., Pérez, L., Alonso, J. M., Amigo, L., & Boza, J. (2002). Effects of concentrates with different contents
of protected fat rich in PUFAs on the performance lactating Granadina goats: Part II. Milk production and composition.
Small Ruminant Research, 43(2), 141-148.
Sauvant, D., Giger-Reverdin, S., & Meschy, F. (2006). Le
con-trôle de l’acidose ruminale latente. INRA Productions animales,
19(2), 69.
Sutton, J. D. (1989). Altering milk composition by feeding.
Jour-nal of Dairy Science, 72(10), 2801-2814.
Sutton, J. D., Oldham, J. D., & Hart, I. C. (1980). Products of
digestion, hormones and energy utilization in milking cows given concentrates containing varying proportions of barley or maize. In: L.E. Mount (Ed.), Energy Metabolism. Butterworths, London, pp. 303–306.
AFNOR, (1986). Association Française des Normes. Contrôle de la qualité des produits laitiers: analyses physico-chimiques. ITSV
AFNOR, 3d ed. Paris, France.