First-principles electronic structure calculations for the whole spinel oxide solid solution range MnxCo3−xO4(0 ≤ x ≤ 3) and their comparison with experimental data
23
0
0
Texte intégral
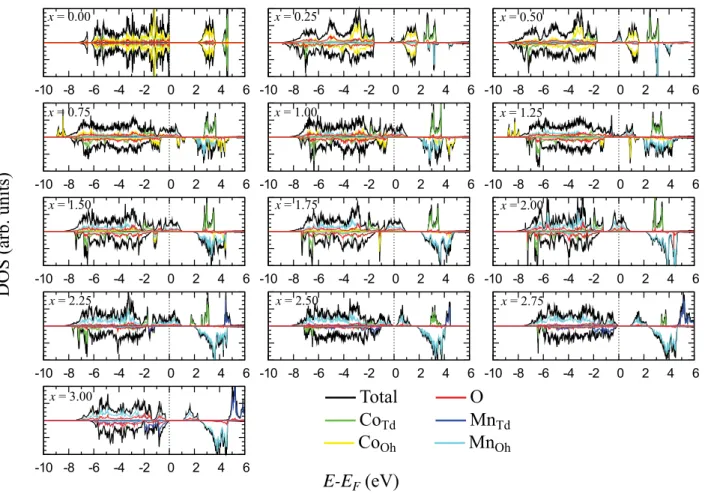
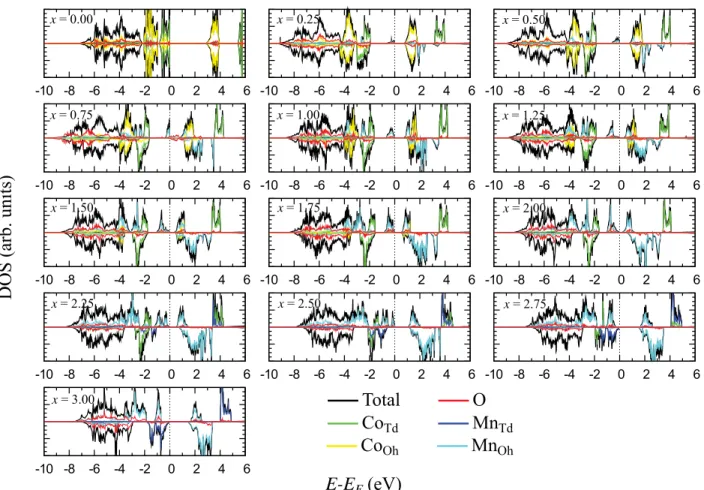
Figure
+7
Documents relatifs
