DOCTORAT DE L'UNIVERSITÉ DE TOULOUSE
Délivré par :Institut National Polytechnique de Toulouse (Toulouse INP) Discipline ou spécialité :
Sciences des Agroressources
Présentée et soutenue par :
M. TUAN KIET LY le jeudi 27 août 2020
Titre :
Unité de recherche : Ecole doctorale :
Development of analytical methods of multi-pesticide residues for
controlling the tea quality, from tea plantation to consumer
Sciences de la Matière (SDM)
Laboratoire de Chimie Agro-Industrielle ( LCA) Directeur(s) de Thèse :
M. PHILIPPE BEHRA M. NHU-TRANG TRAN-THI
Rapporteurs :
M. GAUD DERVILLY, ECOLE NLE VETERINAIRE DE NANTES - ONIRIS Mme EMMANUELLE VULLIET, Institut des Sciences Analytiques
Membre(s) du jury :
M. ERIC PINELLI, TOULOUSE INP, Président
Mme LESLIE MONDAMERT, UNIVERSITE DE POITIERS, Membre M. NHU-TRANG TRAN-THI, NGUYEN TAT THANH UNIVERSITY, Membre
M. PHILIPPE BEHRA, TOULOUSE INP, Membre
I
RESUME EN FRANÇAIS
Le thé est la deuxième boisson la plus consommée dans le monde en raison de ses bienfaits pour la santé, dépassé uniquement par l‘eau. Cependant, en raison des pratiques culturales de type monoculture, l‘utilisation de pesticides dans la culture du thé est très courante. Au fil du temps, le nombre de pesticides utilisés ayant fortement augmenté, de nombreux pays et régions ont établi des limites maximales de résidus de pesticides pour une variété d‘aliments et de boissons, y compris le thé, pour protéger la santé des consommateurs. Ainsi, l‘Union européenne (UE) a fixé les limites maximales de résidus (LMR) pour plus de 480 pesticides et leurs métabolites dans les produits à base de thé. Aussi, est-il nécessaire de pouvoir contrôler ces résidus par des analyses régulières des échantillons afin d‘évaluer si ces limites sont bien respectées. Le développement de méthodes pour l‘analyser ces résidus de multi-pesticides dans le thé constitue donc un défi de taille, car le thé est un produit complexe possédant de nombreux composés qui peuvent interférer avec les résultats, comme les polyphénols, les pigments et la caféine.
L‘objectif de cette thèse est de développer des méthodes fiables et robustes avec une sensibilité, une exactitude et une précision élevées pour répondre aux réglementations de l‘UE pour déterminer simultanément 400 résidus de pesticides dans les produits de thé. Pour cela, les méthodes d‘analyse par chromatographies liquides et gazeuses ultra performantes couplées à la spectroscopie de masse en tandem (UPLC-MS/MS et GC-MS/MS, respectivement) ont été mises en œuvre. La première partie de la thèse a porté sur l‘élimination des effets de matrice dans les feuilles de thé vertes en combinant l‘extraction QuEChERS (rapide, facile, bon marché, efficace, robuste et sûre) et le nettoyage en mode mixte SPE (extraction en phase solide). Une cartouche SPE C18 couplée à SPE GCB/PSA (noir graphite-carbone/éthylène diamine-n-propyl) s‘est avérée être la méthode de nettoyage la plus efficace et a permis de quantifier 225 résidus de pesticides, sur la base de courbes d‘étalonnage réalisées dans les solvants (154 résidus utilisant UPLC-MS/MS et 71 résidus utilisant GC-MS/MS). Les
II
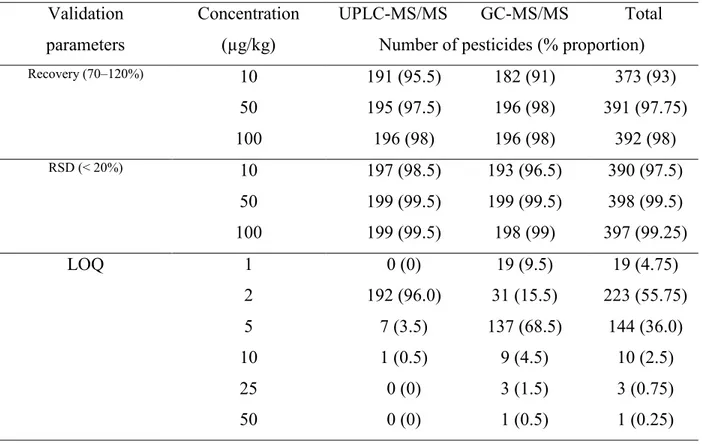
méthodes analytiques ont été entièrement validées conformément aux recommandations du document SANTE/11945/2015 (UE). Les limites de quantification (LOQ) pour la plupart des pesticides (386/400 ou 96,5 %) sont inférieures à 10 μg/kg, c‘est-à-dire inférieures à la LMR de l‘UE (5-70 mg/kg). Dans la deuxième partie, les effets de matrice de 400 résidus de pesticides ont été étudiés et améliorés pour l‘analyse de différents types de thés (blancs, verts, oolongs et noirs). Les résultats ont montré que la combinaison de l‘extraction QuEChERS et de la purification SPE en mode mixte et après réduction du volume d‘injection s‘est avérée être la procédure la plus efficace pour surmonter les effets de matrice. Pour plus de 190 pesticides (> 95 % des 200), l‘effet de matrice est compris dans une fourchette de ± 20% pour les analyses par UPLC-MS/MS. De ce fait, ils peuvent être quantifiés à l‘aide de courbes d‘étalonnage de solvant. Dans le cas des analyses par GC-MS/MS, les courbes d‘étalonnage doivent être adaptées à la matrice pour surmonter ces effets de matrice. De plus, nous avons observé que les effets de matrice en GC-MS/MS pouvaient se traduire soit par une augmentation du signal soit par une réduction. Dans la troisième partie de ces travaux, la méthode a été utilisée avec succès à la détermination de résidus de multi-pesticides dans 106 échantillons de thé. Au total, 26 échantillons de thé (24,5 %) dépassaient les limites autorisées en pesticides, jusqu‘à 43 résidus de pesticides. Les pesticides les plus fréquemment détectés ont été les néonicotinoïdes, les pyréthrinoïdes synthétiques et les fongicides triazolés. Par rapport aux origines des thés analysés, les échantillons les plus contaminés par les pesticides avec 83,3 % sont ceux provenant de Taïwan, suivi de ceux de la Chine (73,7 %), du Vietnam (64,7 %) et enfin de l‘Inde (Darjeeling) (55,0 %).
Ces travaux ont permis de montrer que les échantillons dépassant les réglementations de l‘UE en matière de LMR restent toujours élevés (24,6 %) et qu‘il est nécessaire de poursuivre le développement de méthodes pour évaluer de manière fiable les nombreux résidus de pesticides dans le thé.
III
SUMMARY IN ENGLISH
Tea is the second most-consumed beverage in the world due to its health benefits, surpassed only by water. However, because of monoculture cultivation practices, the use of pesticides during tea cultivation is common. Over time, the number of pesticides used has increased, and, to protect consumers‘ health, many countries and regions have established maximum residue limits of pesticides for a variety of foods and beverages, including tea. For instance, the European Union (EU) has set the maximum residue limits (MRLs) for more than 480 pesticides and their metabolites in tea products. Therefore, the development of analytical methods for multi-pesticide residues in tea is a challenge, because tea is a complex commodity with many compounds that can interfere with results, such as polyphenols, pigments, and caffeine.
The aim of this thesis is to develop rugged and robust methods with high sensitivity, accuracy, and precision to meet the EU regulations for simultaneous determination of 400 pesticide residues in tea products using ultra performance liquid and gas chromatographies coupled to tandem mass spectroscopy (UPLC-MS/MS and GC-MS/MS, respectively). The first part of thesis focused on elimination of matrix effects in green tealeaves by combining QuEChERS (quick, easy, cheap, effective, rugged, and safe) extraction and mixed-mode SPE (solid phase extraction) clean-up. A C18 SPE cartridge paired with SPE GCB/PSA proved to be the most effective clean-up method and enabled 225 pesticide residues to be quantified, based on solvent calibration curves (154 residues using UPLC-MS/MS and 71 residues using GC-MS/MS). The analytical methods were validated fully in accordance with the SANTE/11945/2015 (EU). LOQs for most pesticides (386/400 or 96.5%) were below 10 μg/kg, i.e., less than the EU MRL (5-70 mg/kg). In the second part, matrix effects for 400 pesticide residues were investigated and improved for the analysis of different types of teas (white, green, oolong and black ones). Results showed that combining QuEChERS extraction and mixed-mode SPE clean-up, and following the reduction of
IV
the injection volume were found to be the most effective procedure to overcome matrix effects. More than 190 pesticides (> 95% of the 200 ones) had the matrix effect within the range of ± 20% for UPLC-MS/MS. Therefore, they can be quantified using solvent calibration curves. On the other hand, matrix-matched calibration curves should be used to overcome matrix effects for GC-MS/MS. Moreover, we recognized that matrix effects in GC-MS/MS were not only signal enhancement but also suppression.
Finally, in the third part of this work, the established method was successfully applied to the determination of multi-pesticide residues in 106 tea samples. In total, 26 tea samples (24.5%) were containing at least one pesticide noncompliance, with 43 pesticide residue noncompliances. The most frequently detected pesticides were neonicotinoids, synthetic pyrethroids, and triazole fungicides. In terms of origin in this study, Taiwan had the most pesticide-contaminated samples with 83.3%, following by China (73.7%), Vietnam (64.7%), and India (Darjeeling) (55.0%). The results showed that samples exceeding EU MRLs regulations were still high with 24.6%. Therefore, assessments of multi-pesticide residues in tea need to be continued.
V
Acknowledgements
First of all, I would like to thank Dr. Chu Van Hai, the director of the Center of Analytical Services and Experimentation (CASE), for providing me with a scholarship to complete this thesis. She also supported the best conditions for me to conduct experiments at CASE.
Secondly, I would like to express my sincere gratitude to Dr. Tran-Thi Nhu-Trang for her valuable guidance, tremendous support, and kindness throughout my study. Also, she taught me how to present a scientific paper that could not be more specific.
I am also grateful to Prof. Philippe Behra, who has supported me the best conditions to complete this dissertation during my time at Laboratoire de Chimie Agro-Industrielle (LCA), ENSIACET, Toulouse INP. He instructed me the primary tasks of a scientific researcher and gave me constructive advice to complete my thesis.
I would like to thank Dr. Céline Mathieu, who greatly assisted me with my experiments on LC/MS equipment. Besides, I am very thankful to other colleagues in LCA as Romain, Dao, and Christina. They have supported me a lot whenever I need more chemicals or equipment to do experiments as well as other supports.
It is also my pleasure to thank other Ph.D. students in LCA who have shared with me not only their work experience but also the experience of living in Toulouse: Minh Huy, Sidrine, Alice, and Christopher.
I would like to thank Diem, Duy, Dat, Nghiep, Bao, Nhan, Tam, and other colleagues at CASE for sharing my work while I was studying in Toulouse. I was very fortunate to work with them in the chromatographic analysis department.
I also thank the Mariage Frères company and more particularly Mr Kitti Cha Sangmanee for providing us with tea samples from different origins.
Last but not least, I would like to acknowledge the sacrifice made by my beloved wife, Ngoc Uyen, for her support, words of encouragement, and for taking good care of our lovely boy. I also appreciate the love and support of my parents, younger sisters, and my parent‘s in-laws. I dedicate this work to them.
Toulouse, 13 June 2020 Ly Tuan Kiet
VII
Table of contents
Table of contents ... VII List of figures ... XI List of tables ... XV List of equations ... XIX List of abbreviations ... XXI
INTRODUCTION ... 1
Chapter 1. State of the art ... 5
1.1. Introduction ... 5
1.2. Pesticides use in tea cultivation ... 8
1.3. Pesticide residues in tea ... 10
1.4. Analytical methods for determination of multi-pesiticide residues in tea ... 11
1.4.1. Sample preparation ... 18
1.4.1.1. Solvent extraction (SE) ... 18
1.4.1.2. Liquid-liquid extraction (LLE) ... 19
1.4.1.3. Supercritical fluid extraction (SFE) ... 19
1.4.1.4. Solid-phase extraction (SPE), dispersed solid-phase extraction (d-SPE) ... 20
1.4.1.5. QuEChERS ... 22
1.4.2. Separation and determination ... 27
1.4.2.1. GC-MS/MS ... 28
1.4.2.2. LC-MS/MS... 29
1.5. Matrix effect ... 31
VIII
Chapter 2. Material and methods ... 35
2.1. Materials ... 35
2.2. Equipment ... 36
2.3. Tea samples ... 38
2.4. Sample preparation ... 38
2.5. Experiment procedures ... 39
2.5.1. SPE sorbent optimization (chapter 3) ... 39
2.5.2. Elution volume of the SPE process (chapter 3) ... 39
2.5.3. Evaporation optimization (chapter 3) ... 40
2.5.4. Method validation for green tea (chapter 3) ... 40
2.5.5. Matrix effect evaluation (chapter 4) ... 40
2.5.6. Preparation of calibration curves (chapter 5) ... 41
2.5.7. Method validation for different types of tea (chapter 5) ... 41
2.5.8. Pesticide residues in teas (chapter 5) ... 42
Chapter 3. Determination of 400 pesticide residues in green tea leaves by UPLC-MS/MS and GC-UPLC-MS/MS combined with QuEChERS extraction and mixed-mode SPE clean-up method ... 43
3.1. Introduction ... 44
3.2. Experimental ... 47
3.2.1. Reagents and chemicals ... 47
3.2.2. UPLC-MS/MS and GC-MS/MS analysis... 48
3.2.3. SPE sorbent optimization ... 49
3.2.4. Sample preparation ... 50
IX
3.3. Results and Discussion ... 51
3.3.1. Extraction and optimization of clean-up ... 51
3.3.1.1. SPE sorbents ... 51
3.3.1.2. Elution volume of the SPE process ... 54
3.3.1.3. Evaporation optimization ... 55
3.3.2. Method validation ... 58
3.3.2.1. Matrix effect ... 58
3.3.2.2. Linearity ... 60
3.3.2.3. Recovery and reproducibility ... 61
3.3.2.4. LOQ determination ... 62
3.4. Conclusions ... 63
Chapter 4. Evaluating and overcome matrix effects in several types of tea ... 65
4.1. Eliminating matrix effects by mixed-mode SPE clean-up ... 66
4.2. Overcoming MEs by reducing the injection volume ... 71
4.3. Overcoming MEs by dilution ... 74
4.4. Comparison of matrix effects in white, green, oolong, and black tea ... 78
4.5. Comparison of MEs in the UPLC-MS/MS and GC-MS/MS methods ... 81
4.6. Conclusions ... 82
Chapter 5. Method validation and assessment of 397 pesticide residues in several types of tea from different countries ... 85
5.1. Method validation for several types of teas ... 86
5.1.1. Matrix effects ... 86
5.1.2. Linearity ... 88
X
5.1.4. LOQ ... 90
5.2. Pesticides residues in tea ... 92
5.2.1. Residues assessing by the type of teas ... 94
5.2.2. Number of pesticides detected in tea ... 96
5.2.3. Residues assessing by origins ... 98
5.3. Conclusion ... 99
Chapter 6. Conclusions and perspectives ... 101
6.1. Conclusions ... 101 6.2. Perspectives ... 104 Appendix figure ... 107 Appendix table ... 111 References ... 195 Résumé de la thèse ... 207
XI
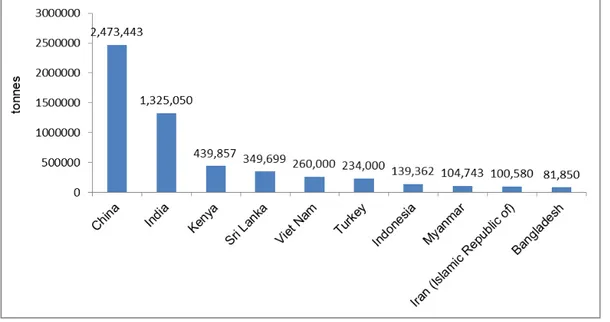
List of figures
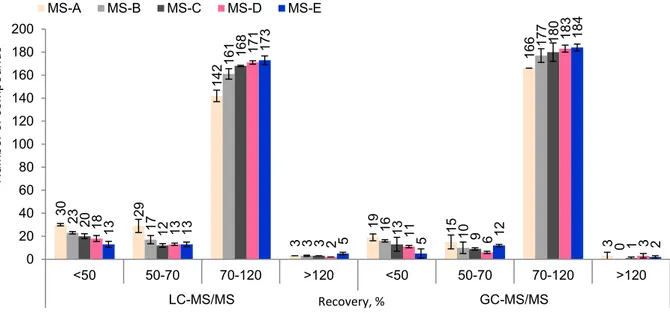
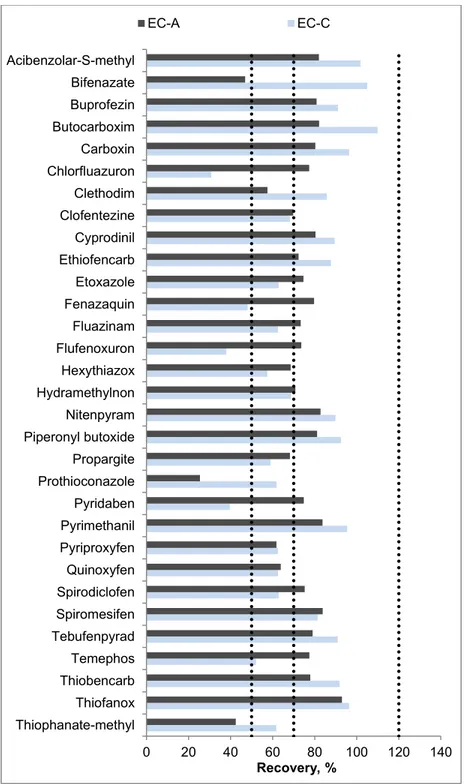
Fig. 1-1. The top 10 tea producing countries in 2017 (FAO, 2017) ... 5 Fig. 1-2. Manufacturing processes of six types of teas ... 7 Fig. 1-3. Schematic presentation of the common procedure of QuEChERS ... 23 Fig. 1-4. Comparing the slop (left) and the signal (right) of a compound in solvent (cyan) with enhancement (blue), and suppression (orange) ... 32 Fig. 3-1. Comparison of the recoveries obtained by the analysis of pesticide residues using different mixed-mode SPE sorbents (LC-MS/MS: 204 compounds; GC-MS/MS: 203 compounds; n = 3). MS-A: GCB (500 mg); MS-B: PSA/GCB (500 mg/500 mg); MS-C: d-SPE (250 mg C18) + PSA/GCB (500 mg/500 mg); MS-D: d-SPE (500 mg C18) + PSA/GCB (500 mg/500 mg); MS-E: C18 (500 mg/6 mL) connected to PSA/GCB (500 mg/500 mg/6 mL) ... 53 Fig. 3-2. Comparison of the recoveries obtained by analysis of pesticide residues using different elution volumes (LC-MS/MS: 204 compounds; GC-MS/MS: 203 compounds; n = 3). EV-A: 10 mL; EV-B: 15 mL; EV-C: 20 mL; EV-D: 25 mL ... 55 Fig. 3-3. The number of pesticides in each recovery range (according to SANTE/11945/2015) obtained from LC-MS/MS and GC-MS/MS methods under different evaporation conditions (n=3). EC-A: 1 mL remaining volume without sample matrix; EC-B: evaporation to dry; EC-C: 1 mL remaining volume with sample matrix ... 56 Fig. 3-4. Comparison of recovery of degradable pesticides under two evaporation conditions (EC-A and EC-C: 1 mL remaining volume without and with sample matrix, respectively) ... 57
XII
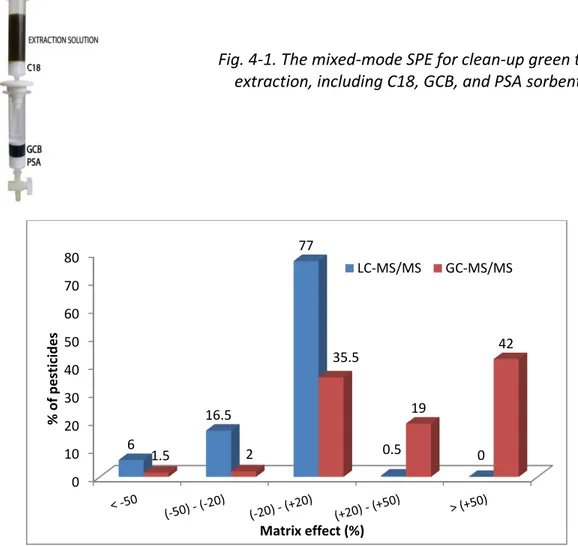
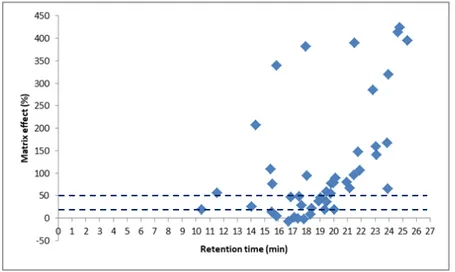
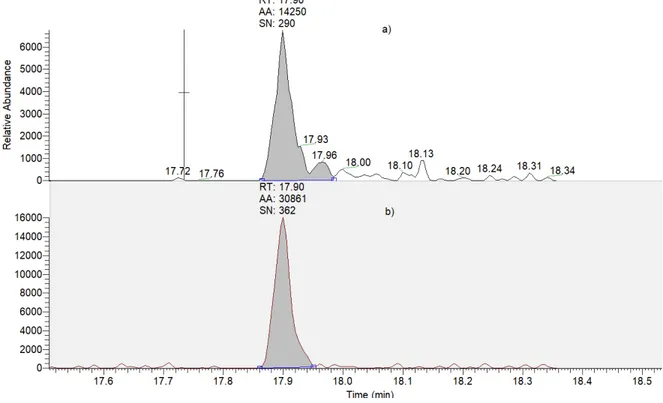
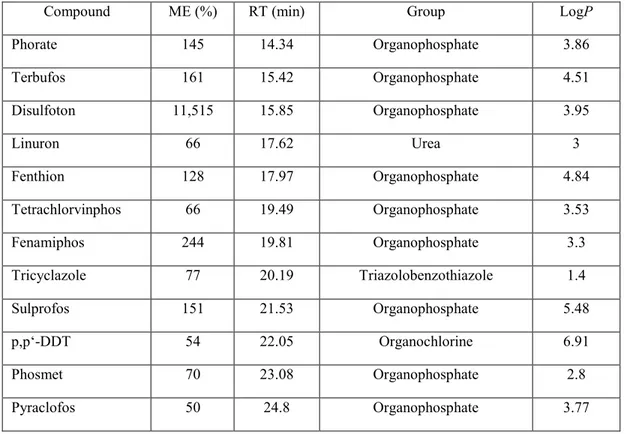
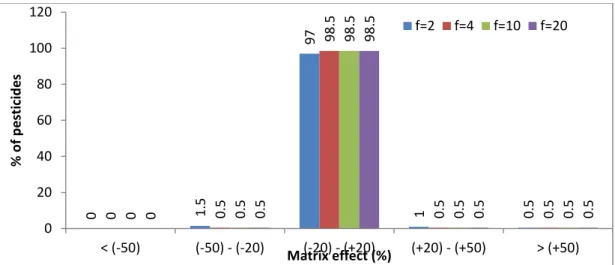
Fig. 4-1. The mixed-mode SPE for clean-up green tea extraction, including C18, GCB, and PSA sorbent ... 66 Fig. 4-2. Percentage of pesticides in each ME range (according to SANTE/11945/2015) obtained by UPLC-MS/MS and GC-MS/MS of green tea; QuEChERS extraction and mixed-mode SPE cleanup; and 3 and 2 µL injection for UPLC-MS/MS and GC-MS/MS, respectively ... 66 Fig. 4-3. MEs of 200 pesticides according to retention time in the UPLC-MS/MS method; 3 µL injection volume; a and b: elution regions of the polar and nonpolar compounds, respectively ... 68 Fig. 4-4. Matrix effect distribution according to the retention time of the organophosphate group in the GC-MS/MS method ... 69 Fig. 4-5. Comparison of the peak shape and area (AA) of tricyclazole in 10 µg/L solvent with (a) and without (b) analyte protectants ... 70 Fig. 4-6. Comparison of the number of pesticides according to ME range (SANTE/11945/2015) in green tea with two injection volumes, that is, 3 and 1 µL for UPLC-MS/MS and 2 and 1 µL for GC-MS/MS ... 72 Fig. 4-7. Percentage of pesticides in each ME range (according to SANTE/11945/2015) obtained by UPLC-MS/MS of green tea with dilution factors (f) of 2, 4, 10, and 20 ... 75 Fig. 4-8. MEs of carbendazim, fuberidazole, and prothioconazole in green tea with dilution factors of 2, 4, 10, and 20 obtained by UPLC-MS/MS; 1 µL injection volume .. 75 Fig. 4-9. Percentage of pesticides in each ME range (according to SANTE/11945/2015) obtained by GC-MS/MS of green tea with dilution factors of 2, 4, 10, and 20 ... 76
XIII
Fig. 4-10. MEs of acrinathrin (pyrethroid), p,p′-DDT (organochlorine), and phorate (organophosphate) in green tea with different dilution factors obtained by GC-MS/MS; 1 µL injection volume ... 77 Fig. 4-11. Simulating the matrix effect of p, p‘-DDT according to the dilution factor in GC-MS/MS method; matrix effects in GC-MS/MS could be sum of ion suppression and ion enhancement ... 78 Fig. 4-12. Comparison of MEs in different types of tea, namely, black tea (BT), white tea (WT), green tea (GT), and oolong tea (OT), obtained by UPLC-MS/MS and GC-MS/MS; 1 µL injection volume ... 79 Fig. 4-13. Comparison of the MEs of 27 compounds in black tea (BT), green tea (GT), white tea (WT), and oolong tea (OT) obtained by both UPLC-MS/MS and GC-MS/MS ... 81 Fig. 5-1. Distribution of matrix effect in GC-MS/MS and UPLC-MS/MS method for black tea (BT), white tea (WT), green tea (GT), and oolong tea (OT) ... 87 Fig. 5-2. Distribution of LOQs in the GC-MS/MS and UPLC-MS/MS method ... 91 Fig. 5-3. Distribution of tea samples with residues not detected, compliant residues detected, and residues in noncompliance (number of samples and percentage) ... 93 Fig. 5-4. Distribution of samples by the number of detected residues per sample ... 94
Appendix figures
Fig. A-1. Recoveries of strong interacting pesticides (spiked at 50 µg/L) with GCB sorbent (chapter 3) ... 107
XIV
Fig. A-2. Example of total ion chromatogram (TIC) of blank green tea samples obtained from three extraction methods (HE-A: study method; HE-B: AOAC 2007.01 method; HE-C: EN 15662 method) (Chapter 3). ... 108 Fig. A-3. The UPLC-MS/MS TIC chromatogram of 200 pesticide standards at 10 µg/L. ... 109 Fig. A-4. The GC-MS/MS TIC chromatogram of 203 pesticide standards at 10 µg/L (including 2 surrogates and 1 internal standard). ... 110
XV
List of tables
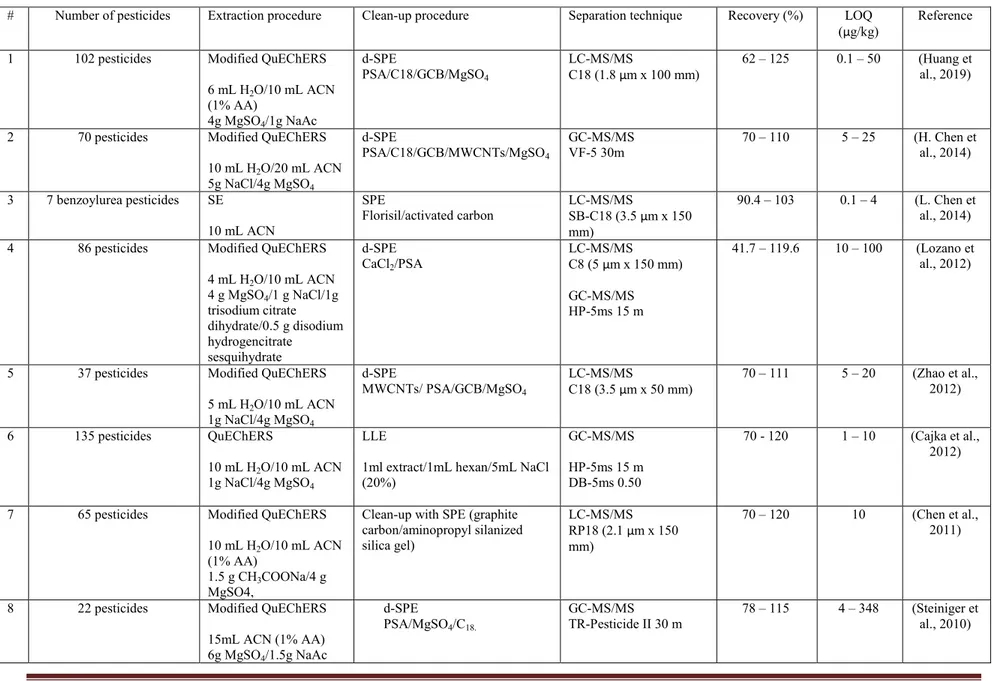
Table 1-1. Summary analytical methods for multipesticide residues analysis in tea ... 15 Table 3-1. Evalutating matrix effect on two analytical methods ... 59 Table 3-2. The number of pesticides that meets the SANTE/11945/2015 standard for recovery (ranging from 70 to 120%), RSD (≤ 20%) and LOQ (recovery in the range of 70 - 120% and RSD ≤ 20%) at different levels ... 62
Table 4-1. Pesticide groups that exhibited strong ion enhancement in GC-MS/MS of green tea; 1 µL injection volume ... 73
Table 4-2. Compounds that exhibited enhancement or suppression in UPLC-MS/MS of black tea (BT), white tea (WT), green tea (GT), and oolong tea (OT) ... 80
Table 5-1. Compounds with linearity range of 1 – 100 µg/kg in LC-MS/MS (a) and GC-MS/MS (b) method ... 88
Table 5-2. The number of pesticides meets the SANTE/11945/2015 regulation for recovery (70 to 120%) and RSD (≤ 20%) at different levels for the UPLC-MS/MS (a), and GC-MS/MS method (b) ... 89 Table 5-3. Comparison of LOQs and MEs for 27 compounds analyzed by the UPLC-MS/MS (a) and GC-UPLC-MS/MS (b) methods ... 92 Table 5-4. Summary of pesticide residue detections and noncompliances by tea type .... 95 Table 5-5. Summary of pesticides frequently found in tea (n ≥ 10) ... 97 Table 5-6. Summary of pesticide residue detections by origin ... 98
XVI
Appendix Tables
Table A-1. The Codex MRLs for pesticides in tea (Codex MRLs). ... 111 Table A-2. The EU MRLs for pesticides in tea (EU MRL, 2019). ... 112 Table A-3. LC and GC multi-residue pesticide kits ... 125 Table A-4. List of pesticides, method parameters and data validation of UPLC-MS/MS method for green tea (chapter 3) ... 126 Table A-5. List of pesticides, method parameters and data validation of GC-MS/MS method for green tea (chapter 3) ... 132 Table A-6. Different types of sorbents for investigation (chapter 3). ... 137 Table A-7. Compounds with low recoveries when using SPE GCB/PSA (MS-B) compare with SPE GCB (MS-A) in chapter 3. ... 137 Table A- 8. List of pesticides, method parameters and matrix effects of UPLC-MS/MS method for 4 types of teas (chapter 4). ... 138 Table A-9. List of pesticides, method parameters, and matrix effects of GC-MS/MS method for 4 types of teas with different dilution factor at 2, 4, 10, and 20; injection volume 1 µL (chapter 4). ... 148 Table A-10. Pesticide groups suffered strong ion enhancement in GC-MS/MS method for green tea; 3uL injection (chapter 4) ... 158 Table A-11. Matrix effects summary according to the dilution factors (2, 4, 10, and 20) obtained by LC-MS / MS and GC-MS/MS method of white (WT), green (GT), oolong (OT), and black tea (BT); 1 µL injection (chapter 4). ... 159
XVII
Table A-12. Matrix effects of 27 compounds obtained by LC-MS/MS and GC-MS/MS in green (GT), black (BT), white (WT), and oolong tea (OT) (chapter 4). ... 160 Table A- 13. List of pesticides, method parameters and data validation of UPLC-MS/MS method for 4 types of teas (chapter 5) ... 161 Table A-14. List of pesticides, method parameters, and data validation of GC-MS/MS method for 4 types of teas (chapter 5) ... 171 Table A-15. Summary information of tea samples (chapter 5). ... 181 Table A-16. Sumary of pesticides detected by samples (chapter 5). ... 186
XIX
List of equations
XXI
List of abbreviations
Abbreviation Definition
AA Acetic acid
ACN Acetonitrile
ADI Acceptable daily intake
APCI Atmospheric-pressure chemical ionization
APPI Atmospheric pressure photoionization
APs Analyte protectants
ARfD Acute reference dose
ASE Accelerated solvent extraction
C18 Octadecyl
CBs Carbamate pesticides
DLLME Dispersive liquid-liquid micro-extraction
d-SPE Dispersive solid-phase extraction
ECD Electron capture detector
ESI Electrospray ionization
EtOAc Ethylacetate
EU European Union
FA Formic acid
FAO Food and Agriculture Organization
FPD Flame photometric detector
GC Gas chromatography
GCB Graphitized carbon black
GPC Gel permeation chromatography
HPLC High performance liquid chromatography
IS Internal standard
IT Ion trap mass spectrometry
IUPAC The International Union of Pure and Applied Chemistry
LC Liquid chromatography
LLE Liquid-liquid extraction
LOD/LODs Limit(s) of detection
LOQ/LOQs Limit(s) of quantification
MeOH Methanol
ME/MEs Matrix effect(s)
MNPs Magnetic nanoparticles
MRL/MRLs Maximum residue limit(s)
XXII Abbreviation Definition
MS/MS Tandem mass spectrometry
MSPD Matrix solid-phase dispersion
MWCNTs Multi-walled carbon nanotubes
NPD Nitrogen phosphorus detector
OCPs Organochlorin pesticides
OPPs Organophosphorus pesticides
PSA Primary secondary amines
PYRs Pyrethroid pesticides
QQQ Triple quadrupole mass spectrometer
Q-TOF Quadrupole time-of-flight mass spectrometry
QuEChERS Quick, easy, cheap, effective, rugged, and safe method
RSD Relative standard deviation
SE Solvent extraction
SFE Supercritical fluid extraction
SIM Selected ion monitoring
SPE Solid-phase extraction
SPME Head-space solid-phase micro-extraction
TRZs Triazine herbicides
TRVs Toxicological reference values
1
INTRODUCTION
Tea is the second most-consumed beverage in the world due to its health benefits, surpassed only by water. However, because of monoculture cultivation practices, the use of pesticides during tea cultivation is common. Over time, the number of pesticides used has increased, and, to protect consumers‘ health, many countries and regions have established maximum residue limits of pesticides for a variety of foods and beverages, including tea. For instance, the European Union (EU) has set the maximum residue limits (MRLs) for more than 480 pesticides and their metabolites in tea products, which range from 0.005 (fipronil) to 70 mg/kg (bromide ion). Therefore, the development of analytical methods that can detect several hundred pesticide residues in tea is a challenge, because tea is a complex commodity with many compounds that can interfere with results, such as polyphenols, pigments, fatty acids, organic acids and caffeine.
For quantitative purpose, the analysis of pesticide residues in tea usually requires extraction, clean-up, and/or enrichment/dilution. Many researchers have focused on QuEChERS (quick, easy, cheap, effective, rugged, and safe method) for sample preparation in combination with dispersive solid-phase extraction (d-SPE) (AOAC 2007.01; Cajka et al., 2012; Chen et al., 2011; Hou et al., 2016; Hou et al., 2014; Lehotay et al., 2010; Lozano et al., 2012; Rajski et al., 2013; Steiniger et al., 2010; J. Wang et al., 2011; Zhao et al., 2012), but QuEChERS extraction and d-SPE clean-up have disadvantages in analysis of tea, including matrix effects and low sensitivity, depending on detection system too (Kittlaus et al., 2011; Rahman, El-Aty, et al., 2013; Rajski et al., 2013). Previous studies have shown that it is challenging to eliminate interference using only d-SPE, and this problem is more evident when analyzing residues of several hundred pesticides with very different physical-chemical properties, such as polarization, functional groups, molecular mass, and vapor pressure. So, the thesis focused on elimination of interferences by combining QuEChERS extraction and mixed-mode solid-phase extraction (SPE) clean-up using
2
different sorbents, such as octadecyl (C18), graphitized carbon black (GCB), and primary secondary amines (PSA), in sample preparation, which allowed for analysis of several hundred pesticides with high sensitivity, accuracy and precision. Subsequently, gas chromatography (GC) or liquid chromatography (LC) coupled with tandem mass spectrometry (GC-MS/MS and LC-MS/MS) are used most to analyse multi-pesticide residues in tea simultaneously
Besides, matrix effect is a common phenomenon in LC-MS/MS and GC-MS/MS, which can cause false-positive and false-negative results. These error problems become more serious if the matrix effects (MEs) are not carefully considered during the development and validation of analytical methods (Rahman, El-Aty, et al., 2013; SANTE/11945/2015; Smeraglia et al., 2002; Taylor, 2005). Removal or reduction of matrix effect is usually conducted by the different ways: (i) improving sample extraction, (ii) changing analyte retention times, (iii) changing ionization source, (iv) using isotope internal standards, (v) adding analyte protectants (for GC only), (vi) dilution, (vii) matrix-matched calibration, and (viii) use of standard addition (Kittlaus et al., 2011; Rahman, El-Aty, et al., 2013; Rutkowska et al., 2019; Taylor, 2005). The choice of the appropriate method depends on the amount of analyte, sample matrix, and analytical instrument (GC or LC); for example, adding analyte protectants is only applied for GC but not for LC.
This thesis is organized in 6 chapters, as follow.
Chapter 1 is a state of the art that summaries knowledge related to tea and analytical methods for determination of pesticide residues in tea. It describes in detail about tea, tea processing, pesticide used in tea, pesticides residue in tea, analytical methods and matrix effect.
Chapter 2 introduces the material and methods used in all experiments. It focuses on method development experiments, matrix effects studies, and analytical method validation.
3
Chapter 3 emphasizes developing analytical methods for 400 pesticide residues in green tea. It involves studies of various sorbents used during the clean-up step, elution volume of the SPE process, as well as evaporation optimization. Subsequently, these methods were validation according to SANTE/11945/2015 requirement. This chapter
has published in the journal of Food Chemistry
(https://doi.org/10.1016/j.foodchem.2020.126928).
Chapter 4 shows the complexity of matrix effect in multi-pesticide analysis for tea. Then, several methods were investigated to overcome matrix effects such as SPE clean-up, using analyte protectant (for GC only), reduction of injection volume, and dilution. In addition, the comparison of matrix effects in different types of tea was presented.
Chapter 5 presents the result of method validation for both method UPLC-MS/MS and GC-MS/MS in several types of teas. Subsequently, these methods were employed to assess pesticide residue in 106 teas from source (tea gardens) and tea brands.
5
Chapter 1. State of the art
1.1. Introduction
Tea is the second most-consumed drink in the world, surpassed only by water (Banerjee et al., 2010; Biswas et al., 2007). Different tea styles are produced by altering leaf shape and chemistry, called ‗processing‘ or ‗manufacture‘, such as black, green, oolong, white, and pu‘erh tea. Nevertheless, they originate from the same plant, Camellia sinensis. It is a sub-tropical, evergreen plant native to Asia but is now grown around the world. The top 10 tea producing countries in 2017 are presented in Fig. 1-1. Most countries are in Asia, except Kenya, in Africa. The tea plant grows best in loose, deep soil, at high altitudes, and in sub-tropical climates. Therefore, ‗tea‘ is anything derived from the Camellia sinensis plant. Other beverages that are sometimes called ‗tea‘ are more accurately called herbal tea or tisane. Tisanes include chamomile, rooibos and fruit teas (Li et al., 2012).
6
Tea has become one of the most popular drinks as some health benefits such as weight control, reducing blood pressure, diabetes, osteoporosis, and risks of cardiovascular disease (Chang et al., 2017; de Amorim et al., 2018). Tea has unique biological activities and consumer health benefits due to its substantial amounts of polyphenols, caffeine (3–5%), and aroma-forming substances (Abd El-Aty et al., 2014). Especially catechins compounds, a form of polyphenols, have potent antioxidant activity that also exists in tea. Catechins in tea include catechin, gallocatechin, catechin gallate, epigallocatechin gallate and gallocatechin gallate (Lee et al., 2010). Depending on oxidation and heat treatment during processing, the content of catechins in teas varies greatly. A review reported the content of six types of catechins in five types of tea, in which the highest and lowest levels were found in green (180 mg/g) and pu-erh tea (4.9 mg/g), respectively (Yashin et al., 2015). In addition to polyphenols, there are other ingredients in tea that have high nutritional value as proteins (15-23% of the dry weight), carbohydrates, lipids, vitamins, and minerals (Stagg & Millin, 1975).
Fresh tea leaves are picked by hand or machine. Usually, only tea buds and from one to two tea leaves are used for processing. The younger tea leaves are used, the more valuable the final product is. Tea‘s quality is mainly reflected in its smell and taste, which are generated by volatile and non-volatile organic compounds present in the tea. Two main factors are affecting the quality of tea: (1) the growing period of the tea plant as well as tea origin and variety; (2) the process stage. The tea processing can be monitored by industrial quality control procedures. However, the biochemical properties of the fresh tea leaves in the growing stage are more difficult to control, though equally important. The concentration of foliar chemical compounds has an essential impact on tea infusion‘s flavor, smell, and other factors that make up the tea‘s quality (Bian).
Until now, teas are classified into five categories comprising six types, namely, non-oxidized (white tea and green tea), lightly non-oxidized (yellow tea), semi-non-oxidized (oolong tea), fully oxidized (black tea), and post-oxidized (dark or Pu‘Erh tea)
7
(Kosińska & Andlauer, 2014; Xu et al., 2018). Tea processing is five main steps; some teas do not utilize all of these steps, while other teas repeat them several times. Primary processing is plucking, withering (allowing the leaves to wilt and soften), rolling (to shape the leaves and wring out the juices), oxidation, and firing (drying). The processing of teas is summarized in Fig. 1-2.
Fig. 1-2. Manufacturing processes of six types of teas
Ideal conditions for proper growth of tea plants are cold temperatures (15-25 °C), high humidity (80-90%), and high annual rainfall. The high humidity helps ensure that leaves grow at a slow rate and remain tender (Fung et al., 1999). Nonetheless, due to monoculture practice and often monoclonal varieties in areas with high moisture and temperature, the tea plant is easily attacked by insects, mites, fungi, viruses, and diseases (Beneta et al., 2018). Over time, the number of pesticides used in agriculture has generally increased. Until now, more than 800 pesticides have been used in agriculture to combat pests, insects, fungi, diseases, and weeds (Zhang et al., 2012). To protect consumers‘ health, many countries and several international
8
organizations have established maximum residue limits (MRLs) for pesticides in tea. Regulations differ between countries, not only for the number of pesticides but also the MRLs. For instance, while the European Union (EU) has set the list of MRLs for over 480 pesticides and their metabolites in tea products, ranging from 0.005 (fipronil) to 350 mg/kg (fluoride ion) (EU MRLs), Codex only controls 23 compounds, ranging from 0.2 (paraquat) to 70 mg/kg (spiromesifen) (CODEX, 2020). (Table A-1 and Table A-2 in Appendix Table). Therefore, reliable, robust, sensitive analytical methods are needed to determine multi-pesticide residues in tea to meet the strict EU requirements, as well as those of other countries.
1.2. Pesticides use in tea cultivation
Today, there are 5 groups of pesticides commonly used in agriculture, including organochlorine pesticides (OCPs), organophosphorus pesticides (OPPs), carbamate pesticides (CBs), synthetic pyrethroid pesticides (PYRs), neonicotinoids and triazine herbicides (TRZs) (LeDoux, 2011b).
Organochlorine pesticides, effective against a variety of insects, were widely used worldwide in agriculture and animal production until developed countries introduced restrictions in the late 1970s. These pollutants have a highly stable, low volatile, non-polar, and lipophilic nature. Consequently, they exhibit considerable environmental persistence with a tendency to bioaccumulate, leading to the contamination of foodstuffs, especially those with high-fat content. Residue concentrations have decreased in monitored foods since these chemicals were banned in most countries, although trace levels are still detected in many foodstuffs. European regulation establishing pesticide residue levels in food has prompted EU members to monitor OCPs (LeDoux, 2011b).
Organophosphorus pesticides, mainly used as insecticides, are esters of phosphoric acid with different substituents. OPPs have widely varying physicochemical properties such as polarity and water solubility. Since these substances act through inhibition of
9
acetyl-cholinesterase, they also represent a risk to human health. Maximum residue limits (MRLs) have, therefore, been established for OPPs by the EU authorities (LeDoux, 2011b).
Carbamate pesticides, or N-substituted carbamic acid esters (RO–C(O)–NR‘R‘‘), are used for broad-spectrum insect control around the world. Exposure to carbamate pesticides, acting as acetyl-cholinesterase inhibitors, can lead to reversible neurologic disorders, and some are suspected carcinogens and mutagens. CBs are thermally unstable compounds; their stability has been studied in foodstuffs such as beef and poultry liver. The Canadian authorities recently initiated a re-evaluation of exposure to these substances. In the EU, MRLs have been established for CBs (LeDoux, 2011b). Synthetic pyrethroid pesticides are effective broad-spectrum insecticides with low mammalian toxicity and short-term environmental persistence. Pyrethroids are non-polar to low-non-polarity lipophilic compounds. Owing to their metabolism in animals, they tend to bioaccumulate in lipid compartments, becoming a potential source of human exposure through foodstuffs. Maximum residue limits for PYRs have been set by several organizations, including the FAO and the EU Council (LeDoux, 2011b). Triazines are among the most widely used herbicides in agriculture. Most of them are derived from s-triazine (1,3,5-triazine), but a few are based on 1,2,4-triazine. The triazines are degraded by chemical and biological processes in their respective hydroxytriazines. s-Triazines and their degradation products are weakly basic, poorly water-soluble compounds of low polarity, stable in the environment, and therefore persistent. 1,2,4-Triazines have similar physicochemical properties but are more polar. These herbicides are suspected of causing cancers, congenital disabilities, and disruption of hormone function. The EU Council has also established MRLs for triazines in food-stuffs (LeDoux, 2011b).
In the last ten years, neonicotinoids are a relatively new insecticide, which is increasingly used. Common substances in this group are imidacloprid, dinotefuran,
10
thiamethoxam, clothianidin, and acetamiprid. Due to the widespread use against a broad spectrum of sucking and certain chewing pests, neonicotinoid insecticides have been the fastest-growing classes of insecticides in the modern crop. Besides, neonicotinoids have many advantages as low risk for non-target organisms and the environment, a high-target specificity to insecticide, and versatility in application methods. However, some reports mention the limitations of the use of neonicotinoids as the Colonial Collapse disorder in bees, affecting the immunocompetence of honey bees, and adverse effects of imidacloprid in birds and aquatic life (Ensley, 2018).
1.3. Pesticide residues in tea
There is a growing number of reports of pesticide contamination in food. A report on pesticide residue in food has shown a significant amount of tea samples contaminated with pesticide residues (EFSA, 2016). Among the unprocessed products, tea is one kind of matrices with the highest MRL exceedance rates (greater than 10%). There are 243 samples of 1016 total samples (accounting 23.9%) of those pesticide residues higher than MRL. For processed food, tea is also in the top 3 matrices with pesticide residues higher than MRL (8/38 samples accounting of 21.1%).
A sample may be contaminated with multiple residues due to various causes: agricultural practices (using of herbicides, fungicides or insecticides against pests or diseases), contaminations during food processing, mixing of several lots, uptake of pesticide residues via soil, or spray drift from nearby fields. According to the current EU regulation, a sample that contaminated multi-pesticide residues is still compliant if each pesticide does not exceed the corresponding MRL. However, the EU 2016 report on pesticides shows that the number of samples contaminated with two or more pesticides is increasing. According to this report, 504 samples (accounting for 49.7%) and 13 samples (accounting for 34.2%) for unprocessed and processed tea, respectively, were contaminated with multiple pesticide residues. A high frequency of
11
MRL exceedances for anthraquinone in tea was identified; the highest residues amounted to up to 0.37 mg/kg while the MRL is set at the LOQ of 0.02 mg/kg.
Lozano et al. used a modified QuEChERS method for surveying multi-pesticide residues (86 compounds) in teas and chamomile (Lozano et al., 2012). Among 75 samples (green teas, black teas, red teas, white teas, oolong teas, chamomile, hibiscus and melissa), 69 (92%) samples were positive for pesticides. 17% of the samples contained ten or more pesticides. The most frequently detected pesticides were biphenyl (49% of the tested samples), acetamiprid (48%), carbendazim (48%), chlorpyriphos (45%), imidacloprid (41%), bifenthrin (40%), endosulfan (32%), and methomyl (23%). Huang et al. reported a multipesticide residue (102 compounds) method by GC-MS for testing pesticide residues in 3042 real tea samples including 1532 green teas, 620 black teas, 727 oolong teas and 163 flower teas (Z. Huang et al., 2007). Fenvalerate (detected concentration 0.05–0.25 mg/kg), cypermethrin (0.01– 0.05), fenpropathrin (0.03–0.30), buprofezin (0.06–0.25) and triazophos (0.02–0.20) were frequently detected. Some pesticides exceeded the EU MRLs, such as fenvalerate (73.4% samples in oolong teas and 52.3% in flower teas), fenpropathrin (57.6%, 30.2%, 22.7% and 16.4% in oolong, flower, black and green teas, respectively). In addition, Huang et al. also used a multipesticide residue method by LC-MS/MS to analyze 3000 tea samples, including 1500 green teas, 650 black teas, and 850 oolong teas (Huang et al., 2009). Among them, acetamiprid (0.01–0.05 mg/kg), imidacloprid (0.01–0.05), paclobutrazol (0.01–0.08) and triazophos (0.06–0.10) were frequently detected. However, these studies show that the number of pesticides surveyed remains low compared to European regulations.
1.4. Analytical methods for determination of multi-pesiticide residues in tea Determining the pesticide residue in tea is challenging because tea is a complex matrix with many alkaloids, pigments, fats and proteins, polyphenols, amino acids, vitamins, pectin, organic acids, polysaccharides and saccharides (Feng et al., 2013;
12
Pang et al., 2013; Zhang et al., 2010). In addition, the simultaneous determination of several hundred pesticides with different polarizations and properties at trace levels is difficult. Due to a unique technique of production, the tea cells are usually broken, the components in the sample move outspread over the leaf, so when extracted with an organic solvent, large interference extracted together with the analyte, and therefore, identify pesticides in tea difficult than the vegetables and fruits (Oellig & Schwack, 2012). Although there are many methods of screening, pesticides in tea are published with high recovery. However, those methods are often impractical because the results are based on surveys of spiking samples, pesticides are added to the sample, just over the surface without interacting with the sample structure (Feng et al., 2013). Currently, GC coupled with mass spectrometry (GC-MS) and GC or LC coupled with tandem mass spectrometry (GC-MS/MS and LC-MS/MS) are used most to analyse multi-pesticide residues in tea simultaneously with low limits of detection (LOD), low limits of quantification (LOQ) and good accuracy (Cajka et al., 2012; Fan et al., 2013; Hayward et al., 2015; Hayward et al., 2013; Hou et al., 2016; Z. Huang et al., 2007; Huang et al., 2009; Li et al., 2012; Pang et al., 2011; Y. Wang et al., 2011).
Generally, published analytical methods for one or more groups of pesticides involved the following: (i) use of an extraction procedures, such as accelerated solvent extraction (ASE), head-space phase micro-extraction (SPME), matrix solid-phase dispersion (MSPD) or solvent extraction; (ii) purification procedures, such as gel permeation chromatography (GPC), solid-phase extraction (SPE), dispersive liquid–liquid micro-extraction (DLLME) or dispersive solid-phase extraction (d-SPE); and, finally, (iii) separation and detection on a chromatographic system based on either gas chromatography (GC) or liquid chromatography (LC), coupled to different detectors (Cao et al., 2015; L. Chen et al., 2014; Feng et al., 2013; Hu et al., 2005; Moinfar & Hosseini, 2009; Schurek et al., 2008).
In some cases, the analysis results may be higher or lower than actual samples due to interferences. When analyzing pesticides in tea by GC, a few compounds tend to meet
13
efficiency and better peak shape when running a standard solution. That is the "ion-enhancement", a type of matrix effect (ME), in the GC technique. Accordingly, the impurities in the extract block the centers operating on the gate and GC column so that the analyte reaches the detector more (Li et al., 2012). ME depends not only on pesticides but also on the type of tea. The pesticides contain carboxyl (-COOH), carbamate (OCONH), phosphate (PO), hydroxyl (OH), azoles (N ), amino (RNH), urea (NHCONH), imidazole, and benzimidazole are the most susceptible type ofanalytes to matrix effect (Michelangelo Anastassiades et al., 2003; Ying Wang et al., 2011). Whereas, organochlorine compounds, due to the absence of polar groups, are less affected. Black tea is severely affected than green tea because black tea is fully oxidizied and has a more complex matrix than green tea (Li et al., 2012). In addition, a large number of impurities are extracted overwhelming compared to the analyte will cause significant difficulties when analyzing trace pesticides, affect ionization efficiency when analyzed by LC, decreased column life.
Besides the difficulties caused by the complex matrix, screening a large number of pesticides is one of the significant challenges. The simultaneous determination of several hundred pesticides with different polarization and properties at trace levels is not easy. Therefore, the preparation of samples for analysis is a particularly important role. Extraction and clean-up techniques, such as solvent extraction, liquid-liquid extraction (LLE) or solid-phase extraction (SPE), are often used. However, these techniques are often time-consuming, requires a large amount of solvent, consuming cost. Currently, QuEChERS extraction commonly uses for screening pesticides. This technique is fast, easy, but still some disadvantages as high ME and dilution factor. Pesticides are usually acidic or basic, depending on the pH of the extracted solution that may exist in the form of ions or molecules. When in the form of ions, the analyte distribution in the aqueous phase than the organic phase. Therefore, the pH of the extract should be optimized to maximize the extraction of compounds. However, basic
14
pesticides are less affected by pH extraction than acidic pesticides. In addition to some pesticides unstable in the high pH environment, the acidity extraction is chosen.
Analytical methods of mutipesticide residues analysis in tea in the last decade are presented in Table 1-1
15
Table 1-1. Summary analytical methods for multipesticide residues analysis in tea
# Number of pesticides Extraction procedure Clean-up procedure Separation technique Recovery (%) LOQ
(µg/kg) Reference 1 102 pesticides Modified QuEChERS
6 mL H2O/10 mL ACN (1% AA) 4g MgSO4/1g NaAc d-SPE PSA/C18/GCB/MgSO4 LC-MS/MS C18 (1.8 µm x 100 mm) 62 – 125 0.1 – 50 (Huang et al., 2019)
2 70 pesticides Modified QuEChERS 10 mL H2O/20 mL ACN 5g NaCl/4g MgSO4 d-SPE PSA/C18/GCB/MWCNTs/MgSO4 GC-MS/MS VF-5 30m 70 – 110 5 – 25 (H. Chen et al., 2014) 3 7 benzoylurea pesticides SE 10 mL ACN SPE Florisil/activated carbon LC-MS/MS SB-C18 (3.5 µm x 150 mm) 90.4 – 103 0.1 – 4 (L. Chen et al., 2014) 4 86 pesticides Modified QuEChERS
4 mL H2O/10 mL ACN 4 g MgSO4/1 g NaCl/1g trisodium citrate dihydrate/0.5 g disodium hydrogencitrate sesquihydrate d-SPE CaCl2/PSA LC-MS/MS C8 (5 µm x 150 mm) GC-MS/MS HP-5ms 15 m 41.7 – 119.6 10 – 100 (Lozano et al., 2012)
5 37 pesticides Modified QuEChERS 5 mL H2O/10 mL ACN 1g NaCl/4g MgSO4 d-SPE MWCNTs/ PSA/GCB/MgSO4 LC-MS/MS C18 (3.5 µm x 50 mm) 70 – 111 5 – 20 (Zhao et al., 2012) 6 135 pesticides QuEChERS 10 mL H2O/10 mL ACN 1g NaCl/4g MgSO4 LLE
1ml extract/1mL hexan/5mL NaCl (20%) GC-MS/MS HP-5ms 15 m DB-5ms 0.50 70 - 120 1 – 10 (Cajka et al., 2012)
7 65 pesticides Modified QuEChERS 10 mL H2O/10 mL ACN (1% AA)
1.5 g CH3COONa/4 g MgSO4,
Clean-up with SPE (graphite carbon/aminopropyl silanized silica gel) LC-MS/MS RP18 (2.1 µm x 150 mm) 70 – 120 10 (Chen et al., 2011)
8 22 pesticides Modified QuEChERS 15mL ACN (1% AA) 6g MgSO4/1.5g NaAc
d-SPE
PSA/MgSO4/C18.
GC-MS/MS
16
# Number of pesticides Extraction procedure Clean-up procedure Separation technique Recovery (%) LOQ
(µg/kg) Reference 9 67 pesticides (CBs, OCPs,
OPPs, PYRs,, azole, strobilurin, cyclodiene, dinitroaniline, and nereistoxin) Modified QuEChERS 10 mL H2O/10 mL EA-Cyclohexane (9/1) 1g NaCl d-SPE PSA/GCB/florisil/Na2SO4 GC-MS VF-5 30m 70 – 120 2 – 50 et al., 2010) (B. Kanrar
10 42 pesticides Modified QuEChERS 10 mL H2O/10 mL EtOAc-Cyclohexane (9/1) 1g NaCl d-SPE PSA/GCB/florisil/Na2SO4 LC-MS/MS C18 (5 µm x 100 mm) 66 – 105 6 – 47 (Bappaditya Kanrar et al., 2010)
11 68 pesticides Modified QuEChERS 5mL EtOH/Toluene (1/1)
d-SPE
MgSO4/PSA/GCB GC-MS HP-5ms 30m > 70 < 1 (Zhang et al., 2010) Modified QuEChERS
1 mL H2O/7 mL ACN (1%AA)
d-SPE
MgSO4/PSA/GCB UPLC-MS/MS BEH phenyl (1.7 µm x 50 mm)
> 70 < 10
12 103 pesticides SE
ACN (2 times with 5 and 2 mL) SPE Carb-NH2 LC-MS/MS Eclipse XDB-C18 (5 µm x 150 mm) 65 – 114 10 – 50 (Huang et al., 2009) 13 10 pesticides (OPPs) SE
ACN/Hexane (250/3) DLLME method. Take 0.5 mL of the mixture of solvent + 5 mL H2O for DLLME.
GC-FPD
BP-5 28.5m 83.3 – 117.4 0.03 – 0.1 (LOD) (Moinfar et al., 2009) 14 36 pesticides (OPPs and
OCPs) HS-SPME (Fiber: PDMS and PDMS/CX/DVB)
GC x GC/TOF
BPX-5 40m 2 – 28 (Schurek et al., 2008) 15 33 pesticides (OPPs, OCPs,
and PYRs) Accelerated solvent extracted GPC column (neutral, porous polystyrene-diethenyl benzene)
SPE Carb-NH2
GC-MS GC-FPD (OPPs) GC-ECD (OCPs and PYRs) 70 – 120 5 – 50 (Beizhen et al., 2008) 16 102 pesticides SE Acetone/EtOAc/hexan GPC system SPE EnviTM-Carb GC-MS
HP-5 30m 60.7 – 136.7 12 – 2450 Huang et al., (Zhiqiang 2007)
17
# Number of pesticides Extraction procedure Clean-up procedure Separation technique Recovery (%) LOQ
(µg/kg) Reference Note: HS: headspace PDMS: polydimethylsiloxane CX: carboxen DVB: divinylbenzene
DLLME: dispersive liquid-liquid microextraction MWCNTs: multiwalled carbon nanotubes
18 1.4.1. Sample preparation
1.4.1.1. Solvent extraction (SE)
Solvent extraction (SE) is one of the techniques most commonly used to extract pesticides from the matrix. For pesticide analysis, it is necessary to consider the balance between extraction efficiency and matrix effect. So polarity solvent medium such as acetonitrile (ACN), acetone, and methanol (MeOH) has been used as the extraction solvent because they are easily miscible with the agricultural products and penetrate the tissue of the samples (Picó, 2015). In such solvents, ACN and ethylacetae (EtOAc) are often used not only in tea but also in other matrices. ACN, despite being solvent mixed with water but can be easily separated for a phase when the salt is added in the solution. Moreover, it can extract polarized pesticides, non-polarized pesticides, and a small amount of matrix components (Zhang et al., 2012). EtOAc can reduce the polarization of a polarized solvent so quickly reduce interference for the next stage. However, some polar pesticides do not readily partition into the EtOAc phase. The acetone and methanol are usually less universal solvent because they are difficult for the phase separation with water. Diethyl ether rarely used due to low boiling temperature and easy to form explosive compounds (peroxides). SE extraction techniques usually associated with the ultrasonic to enhance efficiency and reduce processing time, ultrasonic energy to support the process of breaking the cell wall, as well as the penetration of the solvent into the sample (Zhang et al., 2012). Time ultrasound is survey parameters to ensure analytical results. Ultrasound a short time, the extraction process is not entirely. In contrast, ultrasound for a long time can cause decomposition of the labile compounds. The temperature generated during the ultrasound also needs control. Rezaei and colleagues showed that if the process temperature is greater than 40 °C will lead to the breakdown of heat-labile compounds. Also, the pH index is adjusted by formic acid (FA), acetic acid (AA), or sodium hydroxide (NaOH) to achieve the desired performance. This extraction technique is fast, efficient, suitable for the simultaneous extraction of pesticide compounds.
19
However, the process is extracted in several compounds that cause interference, especially for complex samples such as tea. Frequently solvent extraction techniques usually combined with liquid-liquid extraction (LLE), or solid-phase extraction (SPE), dispersed solid-phase extraction (d-SPE) to remove interferences. In recent decades, SE has been developed to simplify the process, reduce the time, and improve the efficiency of handling as QuEChERS. This method will be described in detail in the following section.
1.4.1.2. Liquid-liquid extraction (LLE)
LLE is one of the techniques used to eliminate interferences in the analysis of pesticides. LLE is based on the principle that a solute or an analyte can distribute itself in a certain ratio between two immiscible solvents, usually water (aqueous phase) and organic solvent (organic phase). LLE is used in the analysis of pesticides to eliminate water, water-soluble compounds, and transfer the analyte into a common polarity solvent, the low boiling point. This method is usually just part of the process of cleaning the complex sample such as tea (Tsipi et al., 2015). Cajka et al. have developed a method for rapid analysis of 135 pesticides in green tea and black tea (Cajka et al., 2012). Samples were processed according to the process QuEChER, then cleaned by LLE extraction LLE with hexane, recovery 70 – 120%, RSD < 20% for all the compounds with three levels 0.001, 0.1, and 1 mg/kg.LLE technique is simple, does not require sophisticated equipment but time-consuming, difficult to automate, use more solvent, so less used.
1.4.1.3. Supercritical fluid extraction (SFE)
In recent years the SFE is applied to extract pesticide compounds in supercritical fluids quickly - a form of matter exists in conditions of pressure and temperature above the critical point. Under these conditions, it can quickly diffuse into the solid form and dissolve analytes. In recent studies, CO2 supercritical fluid is commonly used in extracting pesticides because of the temperature and pressure for its existence in the
20
average, low toxicity, non-flammable, and easy drying after extraction. In addition, supercritical CO2 is effectively extracted the polar or medium polar compounds, should be able to remove the non-polar interference from the sample and leave the polarized pesticides. Arakawa developed a method for the determination of multi-pesticide residues in tea by SFE/GC-MS (Arakawa et al., 2012). It consumed a short period, compared to the total analysis time, and SFE extraction solution contains fewer components than the organic extraction. However, these ingredients interfere with analysis equipment, so the extraction solution is cleanup with SPE column ENVITM‐ Carb/NH2 and InertSepTM SI Cartridge.
In short, compared to the techniques of traditional solvent extraction, SFE technique spends less solvent and time, can extract selectively and efficiently analyze compounds from the sample matrix. Besides, since low-temperature solvent extraction, so it is suitable for heat unstable pesticides. However, due to the low polarity of supercritical CO2, so only the non-polarized or less polarized pesticides are extracted efficiently (Zhang et al., 2012). For medium polarized or polarized pesticide, need to add organic solvents to improve the efficiency of extraction.
1.4.1.4. Solid-phase extraction (SPE), dispersed solid-phase extraction (d-SPE)
Since mid-1970, SPE, an extractive technique where dissolved or suspended compounds in a liquid mixture are separated with respect to their physical-chemical properties, is considered as one of the techniques commonly used to isolate, enrich pesticide compounds in water, food, or eliminating interference components. By the early 1990s, this technique is used most commonly due to the simplicity and large enrichment factor. First, the sample is extracted by the solvent extraction then isolated, enriched based on SPE. In the loading phase, the sample solution is passed through the SPE column was activated before the analyte, and interferences will be stored in the stationary phase. Then interference substances are removed from the SPE with a suitable solvent. Finally, analytes were eluted and analyzed. With SPE, many of the
21
problems associated with liquid/liquid extraction can be solved, such as incomplete phase separations, less-than-quantitative recoveries, and disposal of large quantities of organic solvents (Supelco Bulletin 910, 1998). So, SPE is often considered as more efficient than liquid-liquid extraction, yields quantitative extractions that are easy to perform is rapid, and can be automated.
Typically, the selected type of stationary phase must be selectively absorbing analytes to ensure no loss of them. Today there are many different types of stationary phase is produced to allow isolation and enrichment of pesticides from the sample matrix. Lou. Z and his colleagues used SPE extraction combined gas chromatography to identify 92 pesticides in tea (Lou et al., 2008). Samples were extracted with ACN, and then the organophosphorus pesticides were isolated on Envi-Carb SPE cartridge, eluted by 10 mL acetonitrile-toluene (3:1, v/v) and determined by gas chromatography - Flame Photometric Detector (GC-FPD). The organochlorine and pyrethroid pesticides were isolated, enriched with Envi-Carb and NH2 SPE cartridges, eluted with 5 mL acetonitrile-toluene (3:1, v/v), and determined by gas chromatography - electron capture detector (GC-ECD). Recoveries for all compounds are 80.3% - 117.1%. LODs range 0.0025 - 0.10 mg/Kg. Overall, there are 3 sorbents commonly used in tea pesticide analysis including graphitized carbon black (GCB), primary secondary amine (PSA), and octadecyl (C18) (L. Chen et al., 2014; Hayward et al., 2015; Hayward et al., 2013; Hou et al., 2016). While GCB is suitable for removing coloured compounds, e.g., pigments, and chlorophylls, PSA is used to eliminate sugars, organic acids, caffeine, and fatty acids. In addition, C18 is also used for removal sterols and lipids out of tea extraction solution.
Although SPE gives high yield when processing multiple samples simultaneously, but time-consuming when processing a sample is relatively long, relatively high cost even more, so another form of SPE technique was invented, d-SPE. In this technique, a small amount of adsorbent was put into extract solution; mix well to eliminate interference substances. The solution was centrifuged, and the liquid is taken to
22
analyze. The d-SPE has many advantages, such as using less static and solvent phases, saving time and labor, without supporting equipment such as vacuum pumps. Compared with SPE, d-SPE is a simpler, faster, and cheaper sample process. The most basic adsorbent in the d-SPE is PSA, a weak anion exchange material that allows the exclusion of compounds such as fatty acids, organic acids, and sugars. The combination of two or more kinds of stationary phase helps achieve maximum efficiency exclusion. Octadecyl (C18) eliminates cholesterol in the fat better than PSA. The new adsorbent as nanocarbon is also recommended to use for the analysis of pesticides in tea. Xue Liu and colleagues developed a method d-SPE with mixed stationary phases include Graphene, PSA, GCB combined LC/MS/MS identified 25 pesticides in green tea, black tea, and white tea with the recovery of 71.1 - 108.3% (Liu et al., 2013).
1.4.1.5. QuEChERS
Today, sample extraction methods developed to identify pesticides simultaneously are simultaneously towards the targets (Wilkowska & Biziuk, 2011): many pesticide detections in one injection, quick analysis, good repeatability, environmentally friendly, and low detection. The traditional methods usually include multi-steps: extract, clean up, change solvent, and using a large sample volume. Therefore it is time-consuming, labor-intensive, and a lot of chemical consumption. On the other hand, the traditional processing technique with complex processes is nowadays considered as leading to poor quantitative results, usually only allows analysis of one or more substances in a group of pesticides. So the traditional methods are no longer appropriate.
QuEChERS method was first published in 2003 (M. Anastassiades et al., 2003), applications to process samples for the analysis of pesticides in fruits and vegetables with high water content. QuEChERS is considered to combine and simplify many different techniques: (i) the extraction process with a mixture of solvent ACN / water;
23
(ii) ACN-water phase separation by adding anhydrous MgSO4 and NaCl; and (iii) d-SPE solid phase extraction (with a variety of sorbents) to eliminate interfering compounds. The basic stages of the original QuEChERS described, as shown below. The combination of extraction, isolation, and elimination of interference occurs in a process, simplify operations, to avoid the filtering process, thus limiting evaporation and minimize the amount of solvent used. QuEChERS is the acronym of the words: Quick, Cheap, Effective, Rugged, and Safe, which the advantages of this technique. Nowadays, QuEChERS and modified QuEChERS are widely applied in sample handling for the determination of pesticides in food, especially in screening. The basic trends of the future QuEChERS method than the original method is mainly focused on aspects such as the selection of solvent extraction volume, the ratio between the amount of sample and solvent volume, the effect of pH on the performance extraction, the type and concentration of salt, stationary phase used in the extract phase, cleanup in order to improve extract efficiency.
24
The selection of solvent is essential to achieve the following requirements, including: (i) maximum extraction capacity for a wide polarized range of pesticides; (ii) ability to separate phase with water; (iii) compatibility with many chromatography techniques , and cost, safety; and (iv) environmental concern. Solvents commonly used in the extraction for QuEChERS are ACN, EtOAc, or acetone. Among them, ACN is most widely used due to the selective extraction of analytes, minimizing interfering co-extracts, and suitable for both GC and HPLC (M. Anastassiades et al., 2003). Moreover, due to its higher polarity than acetone and EtOAc, ACN can extract compounds from medium to very polar (Rejczak & Tuzimski, 2015). However, ACN also has some disadvantages: (1) a larger solvent expansion volume during vaporization in GC, (2) ACN‘s detrimental effect on nitrogen phosphorus detector (NPD), and (3) lower volatility (Majors, 2007). Slightly soluble of fat in ACN, so the co-extracted fat is limited; however, this risk is not entirely extracting the non-polar pesticides, particularly when the higher fat content. Ethyl acetate is used less than the ACN because less efficient extraction, waxy and fatty substances easily extracted out with pesticides. Also, if using EtOAc as solvent extraction, the next stage of cleaning by d-SPA ineffective as ACN, recovery of acidic and base pesticides is low.
The homogeneous technique also affects the accuracy of the analysis results. Samples should be pureed to increase the contact area between the solid phase and the organic phase to optimize extraction efficiency. The homogeneous samples should be taken at a low temperature to prevent the loss of non-thermostable substances (M. Anastassiades et al., 2003). Sample and solvent are selected accordingly to minimize the effect of the sample without sacrificing extraction efficiency and meeting of the standing technical sensitivity measurement. Usually, a minimum of 10 g sample is processed to ensure the representativeness. The ratio between the volumes of extraction and sample processing volume is 1:1 (v/m) to effectively extracted analytes without dilution, allowing bypass dried solution stage (M. Anastassiades et al., 2003).
25
MgSO4 often used in the phase separation stage. MgSO4 not only removes water but also increases the distribution of pesticides into the organic phase. Thereby increasing the extraction efficiency of polar substances such as methamidophos, acephate, or omethoate(Wilkowska et al., 2011). NaCl is often used in combination with MgSO4 at a ratio (1/4) to ensure the selectivity of the extraction process and to limit the interference compounds (e.g., sugar) distributed into the organic phase. MgSO4 quality is also essential. Lehotay suggested using MgSO4 powder, the purity over 98%. Many authors suggested it should be dried at 500 °C before use to eliminate phthalates and humid, but these claims were not strict when chemical quality is good enough (Lehotay, 2006). Recent studies show that ammonium formate is also used effectively in phase separation (González-Curbelo et al., 2014).
The stationary phase type commonly used in the d-SPE stage of the QuEChERS method usually C18, PSA, GCB combined with MgSO4. PSA can eliminate sugar, fatty acids, organic acids, and anthocyanin pigments but can cause loss of potent acidic pesticides. PSA does not remove interferences effectively when the samples contain more carotenoid or chlorophyll. C18 is used to remove the non-polar interferences. GCB has a strong affinity toward planar molecules and thus effectively removes pigments (e.g., chlorophyll, carotenoids) as well as sterols (M. Anastassiades et al., 2003). However, most of the pesticides have an affinity with GCB smaller than chlorophyll pigment, the appropriate amount of GCB should be studied so that the final solution is both light color and no loss of flat structure (Rejczak et al., 2015). ChloroFiltr® was also recently announced as a replacement for GCB. ChloroFiltr® is the material that allows exclusions chlorophyll without losing planar structure compounds. However, it should not be used when analyzing hexachlorobenzene (Rejczak et al., 2015). Wang has reported that the recovery efficiency of substances with a flat structure is significantly higher when using ChloroFiltr® compared to GCB; for example, thiabendazole has recovery of 93.2 and 55.9%, respectively (Rejczak et al., 2015). Recently a multi-walled carbon nanotube (MWCNTs) is used as