OATAO is an open access repository that collects the work of Toulouse
researchers and makes it freely available over the web where possible
Any correspondence concerning this service should be sent
to the repository administrator:
[email protected]
This is an author’s version published in: http://oatao.univ-toulouse.fr/21116
To cite this version:
Gañán, Nicolás and Morchain, Jérôme and Camy, Séverine
and Condoret,
Jean-Stéphane
Rate-based simulation of a high pressure counter-current packed column for
supercritical CO 2 extraction of alcohol from dilute aqueous mixtures. (2018) The Journal of
Supercritical Fluids, 135. 168-179. ISSN 0896-8446
Official URL:
https://doi.org/10.1016/j.supflu.2018.01.020
Rate-based simulation of a high pressure counter-current packed column for
supercritical CO
2
extraction of alcohol from dilute aqueous mixtures
Nicolás Gañán
a,b, Jérôme Morchain
b, Séverine Camy
c,⁎, Jean-Stéphane Condoret
caInstituto de Investigación y Desarrollo en Ingeniería de Procesos y Química Aplicada (IPQA), Universidad Nacional de Córdoba, CONICET, Av. Vélez Sarsfield 1611,
X5016GCA, Córdoba, Argentina
bLISBP, Université de Toulouse, CNRS, INRA, INSA, Toulouse, France
cLaboratoire de Génie Chimique, Université de Toulouse, CNRS, INPT, UPS, Toulouse, France
G R A P H I C A L A B S T R A C T
A B S T R A C T
In this work, the modeling and simulation of a fractionation packed column for the recovery of isopropanol from dilute aqueous mixtures using supercritical CO2is presented. The model is based on the numerical resolution of
differential mass balances for each component over the column height. The multicomponent mass transfer be-tween phases is described using a“rate-based” approach and the concept of local mass transfer coefficients. The model was validated by reproduction of experimental steady-state results for the fractionation of 5% isopropanol aqueous solutions obtained in a bench scale counter-current column. The effect of process conditions on the separation performance was satisfactorily described by the model calculations, showing that operation pressure and CO2flow rate enhance IPA recovery and extract purity, while operation temperature has a negative effect.
Model deviations (AARD) were in all cases lower than 20%.
1. Introduction
Fractionation of liquid mixtures using supercritical solvents has been proposed and studied as a promising tool for new separation challenges, as well as an alternative to current separation processes [1,2]. In this way, the use of supercritical carbon dioxide (scCO2) as a
solvent proposes a more environmentally friendly technology when compared to conventional organic solvents. The main potential appli cations include deterpenation of citrus oils [3 6], purification and
removal of solvent residues from edible oils [7], fractionation offish oils [8,9], recovery of high value lipid compounds from edible oils or by products [10,11] and extraction of alcohols and other organic sol vents from aqueous solutions [12,13].
In a typical fractionation process, the mixture to be separated and the supercritical solvent are fed to a separation column (generally a packed column) operated in counter current mode. During contact, the components of the mixture distribute between the liquid and super critical phases according to their volatility and affinity for scCO2to an
extent determined by the prevailing temperature, pressure and com position conditions, as well as the effective mixing and contact area of the phases. The supercritical phase leaving the column at the top (“extract”) is then totally or partially expanded in a separator where solutes condense and are recovered. The processed liquid phase leaves the column at the bottom (“raffinate”). The general features of this process are similar to the gas liquid contacting operations, and there fore its mathematical description is usually analogous or directly based on the theories developed for those operations. The main differences are connected to the particular properties of the supercritical phase (which cannot be considered simply as a gas, because of its significantly higher density and viscosity) together with the complexities of high pressure phase equilibria in ternary or multicomponent systems.
Due to the usually large solventflow rates required by such pro cesses when CO2is used, process optimization is fundamental to assess
economic feasibility, including not only the fractionation column but also the separators and solvent regeneration cycle. Costly and time consuming experimental work [14] can be alleviated through the use of computational tools based on robust and reliable thermodynamic and mass transfer models.
Similarly to gas liquid and liquid liquid operations, two different approaches can be proposed for modeling and simulation of super critical fractionation columns: (i) methods based on the concept of equilibrium stage, and (ii) rate based or “non equilibrium” methods, based upon hydrodynamic and interfacial mass transfer along with a thermodynamic equilibrium assumption at the interface.
In“equilibrium stage” methods the column is modeled as a suc cession of discrete units where the phases mix and reach equilibrium before separating. Concentrations are assumed to be homogeneous in each phase. This approach is applied to packed columns through the concept of“height equivalent to a theoretical stage” (HETS), i.e., the height of packed bed which produces a separation output similar to an equilibrium stage. Many commercial process simulation softwares propose calculation modules for contactors based on this approach. Although easy to implement and very useful to assess and compare performances of a complete process, equilibrium stage methods are somewhat limited due to the poor generalization capability of the concept of HETS or“stage efficiency”, which is very dependent on the physical properties of the system and the flow rates, as well as the contacting technology. Therefore their evaluation is complex and highly sensitive to the operating conditions.
On the other hand, rate based methods take into account the mass transfer kinetics between phases and do not assume that the phases are globally in equilibrium after contact but only at the interface. For this reason, they are often called “non equilibrium” methods. In these models, the mass transfer and hydrodynamic particularities of each system are explicitly computed based on physical and geometrical
properties. Ruivo et al. [15] applied this approach to the dynamic si mulation of the separation of methyl oleate and squalene with scCO2in
a counter current structured packing column. Their model consists in a set of differential mass balances for each phase and algebraic equations accounting for mass transfer and hydrodynamic aspects. Phase equili brium at the interface was taken into account through an empirical correlation, and the interfacial fluxes were calculated using overall mass transfer coefficients. With this model, steady state but also the initial transient period and the dynamic response to perturbations could be described. In a more recent work, Fernandes et al. [16] have ex tended this model to non isothermal operation by incorporating an energy balance. Martin and Cocero [17] have developed a steady state model for the scCO2fractionation of liquid mixtures in counter current
packed columns with external reflux based on differential mass and energy balances, describing mass transfer by Maxwell Stefan multi component diffusion theory. Their model was validated against ex perimental data on edible oils fractionation and fish oil ethyl esters separation. The model was solved by an iterative method, guessing the outlet gas flow rate and composition and calculating backwards the corresponding inlet values until obtaining the specified or experimental values within a certain tolerance. The onlyfitted parameter was the effective interfacial area.
In the present work, a dynamic rate based model of a high pressure counter current packed column is presented and applied to the simu lation of the extraction of isopropanol (IPA) from dilute aqueous solu tions using scCO2. This kind of separations is of great interest for the
recovery of bio alcohols in fermentation processes, and has been ex perimentally studied in bench scale fractionation column in our pre vious work [18]. Two different types of packing and various operating conditions have been studied. In that work, the fractionation process was described using the equilibrium stage approach. The number of equilibrium stages was found to be between one and two for a 2 m height column, this number being dependent on operating conditions, which reflects the fact that the stage approach is not well suited to that particular case. The same ternary system has been previously studied by Rathkamp et al. [19] who characterized mass transfer performances of a spray column, with and without a packing, and proposed a descrip tion using the conventional NTU HTU approach. In their work they considered droplets offluid phase flowing through a continuous liquid phase, with transfer of isopropanol only, and described thermo dynamics using a constant partition coefficient, which is likely to be not enough accurate for these complex systems. We propose here to further analyse our previous experimental results making use of a dynamic rate based model. In order to preserve the numerical cost at a reason able expense, the thermodynamic equilibrium data over a large range of operating conditions are calculatedfirst and embedded in the dynamic simulator as correlations. With this approach, the concentration profiles Nomenclature
aeff Effective interfacial area [m2/m3]
ap Packing specific surface area [m2/m3]
Dij Binary diffusion coefficient of components i and j [m2/s]
dp Packing characteristic dimension [m]
g Gravity acceleration [m/s2]
Ga Galilei number Ga = gdp3ρL2/μL2
hL Volumetric liquid hold up (volume of liquid/internal
column volume)
Ji Interfacial mass transferflux of component i [kg/m2s]
ki,F Fluid phase local mass transfer coefficient [m/s]
ki,L Liquid phase local mass transfer coefficient [m/s]
mi Partition coefficient of component i
N Number of discretisation elements in the column
NC Number of components
Q Massflow rate [kg/s]
Re Reynolds number
S Column section area [m2]
Sc Schmidt number Sc =μ/(ρD)
u Superficial velocity [m/s]
We Weber number We = dpQL2/(S2ρLσL)
xi Mass fraction of component i in the liquid phase
yi Mass fraction of component i in thefluid phase
z Height [m]
ε Packing void fraction
μF Fluid phase viscosity [Pa s]
μL Liquid phase viscosity [Pa s]
ρF Fluid phase density [kg/m3]
ρL Liquid phase density [kg/m3]
σc Critical surface tension of packing material [N/m]
= Re Q Sa μ L L L eff (6)
The effective interfacial area was assumed to be equal to the wetted packing area, which was estimated with the following correlation from Onda et al. (Eq.(7)):
= − ⎡ ⎣ ⎢− ⎛ ⎝ ⎞ ⎠ ⎤ ⎦ ⎥ a a σ σ a d Ga We 1 exp 1.45 ( ) p c L p p L L eff 0.75 0.35 0.05 0.2 (7) whereσcis the“critical” surface tension of the packing material and σL
the surface tension of the liquid. GaLand WeLare the Galilei and Weber
numbers for the liquid phase, respectively. The calculation of themo dynamical and physico chemical properties is presented in the fol lowing sections.
Finally, the liquid hold up (hL) was estimated with a standard cor
relation for randomly packed columns [25], according to Eq.(9):
= −
hL 1.295(a d Gap p) L0.44ReL0.676 (8)
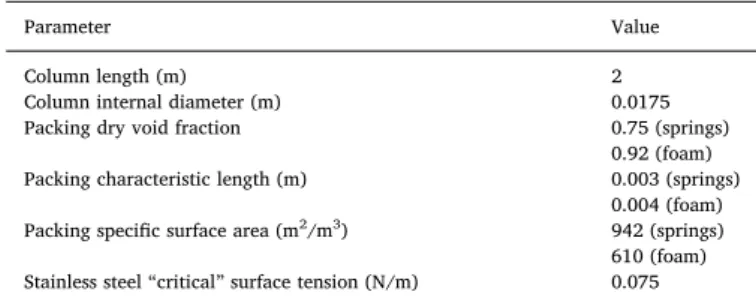
All symbols and non dimensional numbers are defined in the no menclature. All details regarding the characteristics of the fractionation column can be found in our previous work [18]. The main information is reported inTable 2.
2.2. Thermodynamic model
As mentioned, the model assumes thermodynamic equilibrium at the interface. The IPA water CO2ternary phase equilibrium was com
puted using the Simulis® Thermodynamics software (ProSim SA, France). A combined equation of state/activity coefficient model (EoS/ GE) approach with suitable complex mixing rules was selected. The
equation of state is the Soave Redlich Kwong equation [26] with the modification proposed by Boston Mathias [27]. The co volume b of the SRK equation is obtained from a standard mixing rule (arithmetic mean of the corresponding parameters of the pure compounds). The term a of the SRK equation is computed using the PSRK mixing rule [28] and the UNIQUAC model [29,30] is used to calculate the excess energy at zero pressure, GE
0, involved in the PSRK mixing rule. More detailed in
formation about the modeling of the system phase behaviour can be found in our previous work [18].
2.3. Physico chemical properties
The equations involved in the column model require the knowledge or an estimation of several physico chemical properties of the pure compounds. The needed physico chemical properties of pure IPA, water and CO2are presented inTable 1, as obtained from NIST.
The density and viscosity of the fluid and liquid phases were as sumed to be constant along the column and equal to those of pure CO2
and pure water at the specified pressure and temperature conditions, neglecting the effect of the low concentration of solutes and the com position changes along the column. This simplification, limited to dilute liquid solutions, was verified with available experimental data.
For density of the liquid phase, experimental results reported by Hebach et al. [31] indicate that the density of CO2saturated water
within the range of operation conditions covered in this work differs only around 1% with respect to pure water at the same conditions. Regarding thefluid phase, to the best of our knowledge there are no density data for the systems CO2+ water or CO2+ isopropanol at su
percritical conditions in the open literature. However, as a reference, data of saturated density of the system CO2+ ethanol at near critical
and supercritical conditions (40 and 55 °C, 7 9 MPa) indicate that the difference with pure CO2 density is below 12% [32]. Calculations
performed with the Simulis©software using our thermodynamic model
at the inlet:flow rate and composition are constant at the outlet: zero gradient for all quantities.
A second order upwind scheme is used for internal nodes (k = 3, …,N − 1) as well as for the definition of the Neumann boundary Table 1
Physico-chemical properties of pure compounds (from NISTa).
Property IPA water CO2
Molar mass (g/mol) 60 18 44
Critical temperature (°C) 235.9 373.6 31.1
Critical pressure (MPa) 4.9 22.1 7.38
Critical volume (cm3/mol) 222.0 55.9 91.9
Molar volume at normal boiling point (cm3/mol) 77 18 –
NIST webbook of chemistryhttp://webbook.nist.gov/chemistry/.
aNational Institute of Standards and Technology.
Note that the Reynolds number for the liquid phase has to be cal culated in terms of effective interfacial area (aeff), as in Eq. (6):
for a mixture consisting in 99% CO2, 0.5% water and 0.5% IPA (close to
the composition of the fluid phase in the column) predict a 9% devia tion with respect to pure CO2 density, as provided by the NIST data
base.
Supercritical fluid phase viscosity was estimated with the method of Lucas [33] for dilute mixtures of IPA and water (up to 2%) in scCO2 and
was found similar to the viscosity of pure CO2 under the same condi
tions within a maximum deviation range of 15%. For the viscosity of the liquid phase, data reported by Tanaka et al. [34] show that the
viscosity of aqueous solutions of IPA under pressure increases with IPA concentration, reaching a maximum at around 60% wt. On the other hand, it is known that the dissolution of supercritical solvents in liquids decreases their viscosity. For example, data of CO2 + oleic acid and
CO2 + squalene show that the saturated liquid viscosity is reduced with
increasing pressure, along with a higher dissolution of CO2 [35]. To the
best of our knowledge, there is no information regarding the viscosity of water saturated with CO2 at high pressure conditions, but a similar
behaviour is expected to occur, although in a lesser extent considering that scCO2 solubility in water is lower than in lipidic liquids. Therefore,
considering the opposite effects of IPA and CO2 on the aqueous phase
viscosity, the latter was assumed to be equal to that of pure water. The surface tension of the liquid phase (σL) was estimated using the
method of Tamura, recommended for aqueous solutions of organic compounds [33], corrected to account for the effect of pressure. The
details of this method are given in Appendix A. Briefly, the mixture surface tension is calculated by interpolation of the pure compound values as a function of the mixture composition. The model was fitted to experimental data of surface tension for the ternary system IPA + water + CO2 at high pressure conditions [36], and allowed es
timation of the surface tension variation along the column. This was thought to be necessary due to the fact that this property is sensitive to the presence of IPA and has a strong influence on the value of the wetted or effective interfacial area, a key parameter for mass transfer.
The diffusion coefficients of IPA and water in the supercritical phase (D13 and D23) and of IPA and CO2 in the liquid phase (D12 and D32) were
estimated using the conventional method of Wilke and Chang [33] for
liquids. The calculation details are given in Appendix B. Although this method provides an estimation of binary diffusion coefficients at in finite dilution, the values obtained are expected to hold because of the low concentration conditions that prevail in both phases in the case of dilute mixtures fractionation.
2.4. Numerical resolution
The model was implemented in the Matlab© software. The differ
ential mass balance equations (Eqs. (1) and (2)) were solved using a
finite difference discretization method based on N grid nodes. The first and last nodes receive the conventional following boundary conditions:
condition at node N, according to Eq.(9): ∂ ∂ = − + + − − Q x z Q x Q x Q x z O z ( ) 3( ) 4( ) ( ) 2Δ (Δ ) L i k L i k L i k 1 L i k 2 2 (9) A second order centred scheme is used for the second node (k = 2), according to Eq.(10). ∂ ∂ = − + + − Q x z Q x Q x z O z ( ) ( ) ( ) 2Δ (Δ ) L i k L i k 1 L i k 1 2 (10) In this way, the set of 6 partial differential equations (3 components and 2 phases) is transformed into a set of 6N ordinary differential equations. The resulting system of ordinary differential equations and algebraic equations is integrated over time using a fourth order explicit Runge Kutta (RK4) method. For each set of operating conditions, the time step is automatically adjusted in order to meet the stability cri terion (current number < 1).
In general, concentrations as well as total and partialflow rates are function of time and location along the column. When the solution to be purified is concentrated, the solute extraction by scCO2 may modify
significantly the liquid flow rate (and all associated properties). Also, the dissolution of CO2in the liquid phase may be important in some
cases, and therefore thefluid flow rate can be reduced in the same way. However, as previously mentioned, we consider in the present work dilute liquid feeds so it is acceptable to consider that theflow rates and the liquid hold up are practically constant along the column. Therefore the resolution of the mass balance equations is simplified: for each time step they are solved considering constant hL, QL and QF along the
column, and only the initial composition profile of each phase is re quired as initial condition. This assumption holds as long as the net massflux through the interface is small as compared to the mass flow rate of each phase. This clearly constitutes a limitation of our modeling approach which is indeed only valid for dilute mixtures but actually corresponds to the recovery of dilute alcohols from fermentation broths.
Solving this set of equations requires the calculation of the equili brium concentrations at the interface for each node at each time step. Implementing these thermodynamic equilibrium calculations using Simulis© proved to yield very lengthy computations because of the
numerous calls to an external procedure (i.e., the Simulis© software
toolboxes). To improve the computational efficiency of this dynamic simulator, ternary equilibrium data were beforehand computed for a wide range of compositions, at the specified operation temperature and pressure, and stored as a set of cubic spline interpolation functions. 3. Results and discussion
3.1. Simulation parameters and preliminary runs
As mentioned, the model was validated by fitting experimental steady state fractionation data of dilute aqueous mixtures of IPA using scCO2, obtained by Lalam et al. using a bench scale counter current
column, as reported in a previous work [18]. The adjustable coefficients
of Eqs.(4)and(5)were obtained in order to reproduce the recovery ratio and mass fraction of IPA in the raffinate stream under different temperature, pressure and solvent to feed ratio conditions.
Table 2shows the column and packing characteristics used in the experiments, required by the model as input information. Two types of packing have been evaluated: stainless steel springs and a porous me tallic (FeCrAlY) foam.
Afirst set of preliminary runs were performed in order to determine appropriate discretization and integration parameters. In order to ob tain reproducible and stable numerical results, 100 grid points (each of 2 cm height) and a time integration step of 0.3 s were sufficient in most cases. Calculations were carried out until the outlet concentrations were constant (steady state conditions). However, the accurate prediction of
the transient period duration was not an objective of this work. The dynamic simulation approach is used here as a strategy to avoid the initialization problem that usually arises in steady state models, which are solved iteratively and whose performance rely on the quality of the initial guess of the outlet conditions [17].
As mentioned, due to the constantflow rate hypothesis, only the initial composition profiles along the column are required as initial conditions. Different initialization strategies were tested. The fluid phase was considered initially as pure scCO2in all runs, but different
initial profiles for the liquid phase were tested: (i) pure water; (ii) a composition profile equal to that of the liquid feed, and (iii) variable composition profile with a linear gradient of IPA from the liquid feed composition at the top to zero at the bottom. In all cases, the model proved to converge toward the same steady state solution, with dif ferences regarding the duration and behaviour of the transient period, as shown inFig. 2for a given set of operating conditions. Notice that the curves corresponding to the initial liquid phase configurations (ii) and (iii) almost completely overlap.
The model also provides information about the calculated con centration profiles along the column, as well as the interfacial mass transferfluxes and partial flow rates. As an example,Fig. 3shows the calculated profiles for the fractionation of a 5% IPA solution at 40 °C, 10 MPa and a solvent to feed ratio (QF/QL) equal to 9.5 kg/kg using the
springs packing. This kind of information can be very useful for tech nological improvement, as it allows detecting if the mass transfer is low in a certain part of the column. It can be checked that the magnitude of the massflux between phases remains small compared to the mass flux of each phase (total liquid massflux is equal to 0.587 kg/(m2s)) thus validating the nearly constant massflow rate assumption.
3.2. Influence of pressure and temperature
Table 3shows the density and viscosity values for the liquid and fluid phase used in the simulations at all the studied temperature and pressure conditions.Table 4shows the calculated IPA diffusion coeffi
cients and mass transfer coefficients in the liquid and fluid phases. Note that, due to the hypothesis of constant fluid properties along the column, single values of kLand kFare calculated for each condition.
Fig. 4shows numerical and experimental results of IPA mass frac tion and recovery ratio of water and IPA in the raffinate phase as a function of operating pressure, at constant temperature (40 °C) and QF/
QLratio (6.04 kg/kg), for the fractionation of a 5% IPA solution using
springs packing. Experimental results are given in terms of composition and recovery ratio in raffinate, because, on an experimental point of view, this outlet phase is easier to recover and analyse than the extract phase. Recovery ratio in the raffinate is obtained by dividing the flowrate of the considered compound in the raffinate by the flowrate of the compound in the feed.
The experimental reproducibility has been assessed and demon strated in our previous work [18]. Each run was reproduced in quad ruplicate and results were found reproducible with a mean deviation equal to 0.005% for raffinate IPA mass fraction and 0.35% for raffinate Table 2
Packed column parameters used in the calculations.
Parameter Value
Column length (m) 2
Column internal diameter (m) 0.0175
Packing dry void fraction 0.75 (springs)
0.92 (foam)
Packing characteristic length (m) 0.003 (springs)
0.004 (foam)
Packing specific surface area (m2/m3) 942 (springs)
610 (foam) Stainless steel“critical” surface tension (N/m) 0.075
IPA recovery ratio.
The values of the coefficients of the Onda correlations (α and β) were manually fitted in order to reproduce the experimental results, with a good agreement using α = 1.05 and β = 0.001, valid for all experiments related to the springs packing at 40 °C. With these values, the absolute average relative deviation (AARD) was 16.4% for the IPA mass fraction and 17.6% for the IPA recovery, both in the raffinate. This implies that the mass transfer coefficient values predicted by the ori ginal correlations of Onda are divided approximately by 5 in order to reproduce the experimental data obtained in our column. Onda’s cor relations were developed from data obtained in conventional gas liquid systems, at atmospheric pressure, and therefore may not be directly applicable to our specific case, in which the gas phase is replaced by a dense supercritical phase and the packing type and column dimensions may induce specific flow patterns. Therefore, the original coefficients were replaced by adjustable parameters in order to account for these
features. Concerning flow patterns, it must be remembered that the correlations of Onda were developed from data obtained in gas ab sorption packed columns with a high ratio between column diameter and packing size. In our fractionation column, this ratio is lower and Fig. 2. IPA concentration in liquid (a) andfluid (b) outlet currents vs. time for the fractionation of a 5% IPA solution at T = 40 °C, P = 10 MPa, QL= 0.48 kg/h and QF/QL= 9.5 kg/kg,
using different initial liquid phase profiles: (- -) pure water; (—) 5% IPA solution; (···) linear profile.
Fig. 3. Calculated mass fraction of compounds (xi, yi) and mass transferflux (Ji) profiles for the fractionation of a 5% IPA solution at T = 40 °C, P = 10 MPa, QL= 0.48 kg/h and QF/
QL= 9.5 kg/kg using springs packing. The calculation time was 10 min, corresponding to the steady state solution.
Table 3
Fluid and liquid phase properties used in the calculations.
T (°C) P (MPa) ρF(kg/m3) μF× 105(Pa s) ρL(kg/m3) μL× 104(Pa s)
40 10 630 5.00 996 6.54 40 12 718 5.85 997 6.54 40 15 780 6.75 999 6.54 40 20 840 7.83 1001 6.55 50 10 384 2.84 992 5.49 60 10 290 2.38 987 4.69 70 10 248 2.25 982 4.06 80 10 222 2.20 976 3.57
wall effects are suspected to be much more pronounced, reducing the effective interfacial area and the column performance. Moreover, axial dispersion has not been taken into account in the model. Thus, it has been chosen to reflect these phenomena, including pressure effects, in the values of mass transfer coefficients.
InFig. 4, it can be observed that the model describes correctly the enhancing effect of pressure on the column efficiency within the studied range. Although the fluid phase density and viscosity increase with pressure (seeTable 3), with a subsequent decrease of the mass transfer coefficient, this effect is compensated by an IPA partition coefficient (m1) enhancement (almost 2 fold) as CO2density increases. This can be
seen inFig. 5, which shows the representative values of m1as well as
the IPA mass transfer resistance in both phases, defined according to Eqs.(13)and(14): = R k m 1 F F 1, 1, 1 (13) = R k 1 L L 1, 1, (14)
The m1 values shown in Fig. 5 are mean values calculated for
comparison using the column global composition. Although the parti tion coefficient is composition dependent, in the case of dilute mixtures its variation is limited within a narrow range, as can be seen for a ty pical run inFig. 6.
As can be observed inTable 4, the kLvalues calculated by the model
are practically independent of pressure, because the change in the li quid relevant properties (density and viscosity) with pressure is very low. Therefore, the mass transfer resistance on the liquid side also re mains almost constant, as shown inFig. 5. On the other hand, the kF
Table 4
Calculated IPA diffusion coefficient (D) and mass transfer coefficient (k) in fluid and li-quid phase. T (°C) P (MPa) DF× 108(m2/s) DL× 109(m2/s) kF× 105 (m/s) kL× 106 (m/s) 40 10 2.27 1.79 8.74 2.27 40 12 1.94 1.79 7.11 2.27 40 15 1.68 1.79 5.97 2.27 40 20 1.45 1.79 4.99 2.27 50 10 4.12 2.20 25.92 2.88 60 10 5.07 2.51 34.87 3.34 70 10 5.52 3.16 39.70 4.38 80 10 5.81 3.69 42.98 5.24
Fig. 4. (a) IPA wt% in raffinate (in CO2-free basis) and (b) raffinate recovery ratio of IPA and water versus operation pressure for the fractionation of dilute IPA solutions (5 wt%,
T = 40 °C, QL= 0.48 kg/h, QF/QL= 6.04 kg/kg) using springs packing. Dots: experimental results from Lalam et al. [18]. Lines: simulation results withα = 1.05 and β = 0.001.
Fig. 5. Calculated IPA partition coefficient (dotted line) and mass transfer resistances (solid lines). Column average values as a function of operation pressure for the fractio-nation of dilute IPA solutions (5 wt%, T = 40 °C, QL= 0.48 kg/h, QF/QL= 6.04 kg/kg)
using springs packing.
Fig. 6. IPA partition coefficient profile along the column as a function of operation pressure for the fractionation of a 5% IPA solution at T = 40 °C and QF/QL= 9.5 kg/kg
using springs packing.
It can be seen that the model was able to fairly reproduce the ex perimental data trend (AARD of 21.3% and 20.6% for IPA concentra tion and recovery, respectively), with a good matching for QF/QL≥ 6
but higher deviations at QF/QL< 6. In fact, for low QF/QLratios (< 6)
the model overpredicts the fractionation performance, yielding to lower concentration values of IPA in the raffinate phase than those observed experimentally. In this low QF/QLregion, lower values of the para
metersα and β should be used in order to reproduce correctly the ex perimental results, as discussed in the next paragraph. This possibly indicates a change in the column hydrodynamic regime, which is not explicitly taken into account in the applied correlations. In particular, as low QF/QLratio correspond to low CO2flow rate, a hypothesis could
be that the column is operated at conditions below loading point, where liquid and CO2phases weakly interact.
Simulations were also performed at higher QF/QLratios (up to 20),
predicting that for QF/QL> 15 the recovery and concentration of IPA
in the raffinate change at a very low rate. Operation in this region becomes more expensive, as the cost of CO2recompression increases,
with only a minor improvement in the separation efficiency. Besides, it can be observed from raffinate recovery ratio (Fig. 9(b)) that the ex traction of water in the supercritical fluid phase increases, reducing selectivity of extraction and thus the IPA purity in the extract.
3.4. Influence of packing type
In order to evaluate the model performance with different packing characteristics, simulations were performed and compared with ex perimental results using a metallic foam packing, as reported by Lalam et al. The main characteristics of this foam are presented inTable 2.
Fig. 10shows the experimental and numerical results for the frac tionation of a 5% IPA solution at 10 MPa and 40 °C and at different QF/
QL ratios. The results with springs packing are also presented for
comparison. Numerical results for the foam packing were calculated usingα = 1.38 and β = 0.0018 as adjusted coefficients. As in the case of springs, a fair agreement was obtained for QF/QL> 6 (AARD of 33%
for IPA concentration and recovery in the raffinate), with higher de viations for QF/QL< 6 (47%).
It is interesting to note that, for both types of packing, there seems to be a change in the experimental data slope around QF/QL= 6, which
is not correctly reproduced by the model. As mentioned, this may be due to a change in the column hydrodynamic regime and innerflow patterns, which would affect the phase distribution, the effective in terfacial area as well as the mass transfer coefficient values. This sudden change of behaviour can also remind the conventional“loading point” of a packed bed as encountered in gas liquid columns. This analogy Fig. 9. (a) IPA wt% in raffinate (in CO2-free basis) and (b) raffinate recovery ratio of IPA and water versus solvent-to-feed ratio for the fractionation of dilute IPA solutions (5 wt%,
T = 40 °C, P = 10 MPa, QL= 0.48 kg/h) using springs packing. Dots: experimental results from Lalam et al. [18]. Lines: simulation results withα = 1.05 and β = 0.001.
Fig. 10. (a) Raffinate recovery ratio of IPA and water and (b) IPA wt% in raffinate (in CO2-free basis) versus solvent-to-feed ratio for the fractionation of dilute IPA solutions (5 wt%,
The basic equation is: = + σm ψ σw ψ σ σ w o σ o 1/4 1/4 1/4 (A.1) whereσmis the mixture surface tension,σwandσoare the surface tension of pure water and the pure organic solute (at the same temperature), and
Ψσ
w,Ψσoare the superficial volume fractions of water and solute in the surface layer. The model consists in the following set of equations:
= B ψ ψ log( w)q o (A.2) ⎜ ⎟ = ⎛ ⎝ − ⎞ ⎠ W q T σ V q σ V 0.441 o o w w 2/3 2/3 (A.3) = + ψ ψ ( ) 10 wσ q o σ (B W) (A.4) where Vw, Voare the molar volumes of pure water and the pure organic solute, T is the absolute temperature, q is a parameter which depends on the
type and size of the organic solute (for alcohols, it is equal to the number of carbon atoms in the molecule), andΨw,Ψoare the superficial bulk
volume fractions of water and organic solute, defined as: = + ψ x V x V x V w w w w w o o (A.5) = + ψ x V x V x V o o o w w o o (A.6)
This set of equations can be solved provided the values of Vw, Vo, xw, xo,σw,σo, q and T, considering that:
+ =
ψwσ ψoσ 1 (A.7)
In this work, in order to take into account the effect of scCO2, the surface tension of pure water (σw) was replaced by the value for water under
CO2pressure within the experimental range covered here. More details can be found in the work by Tamura et al. [41].
Appendix B. Method of Wilke and Chang.
This method provides an estimation of the diffusion coefficient of a solute (A) in a solvent (B) at infinite dilution conditions (DABo ). The equation
is: = × − D ϕM T μ V 7.4 10 ( ) AB o B B A 8 1/2 0.6 (B.1) where MBandμBare the solvent molar mass (g/mol) and viscosity (cP), VAis the molar volume of the solute at its normal boiling temperature (cm3/
mol), T is the system temperature (K) andϕ is the association factor of the solvent (ranging from 2.6 if the solvent is water to 1.0 if it is unassociated).
References
[1] G. Brunner, Counter-current separations (Review), J. Supercrit. Fluids 47 (2009) 574–582.
[2] A. Bejarano, P.C. Simoes, J.M. del Valle, Fractionation technologies for liquid mixtures using dense carbon dioxide, J. Supercrit. Fluids 107 (2016) 321–348. [3] E. Reverchon, A. Marciano, M. Poletto, Fractionation of a peel oil key mixture by
supercritical CO2in a continuous tower, Ind. Eng. Chem. Res. 36 (1997)
4940–4948.
[4] M. Sato, M. Kondo, M. Goto, A. Kodama, T. Hirose, Fractionation of citrus oil by supercritical countercurrent extractor with side-stream withdrawal, J. Supercrit. Fluids 13 (1998) 311–317.
[5] M. Budich, S. Heilig, T. Wesse, V. Leibküchler, G. Brunner, Countercurrent de-terpenation of citrus oils with supercritical CO2, J. Supercrit. Fluids 14 (1999)
104–114.
[6] S. Díaz, S. Espinosa, E.A. Brignole, Citrus peel oil deterpenation with supercritical fluids. Optimal process and solvent cycle design, J. Supercrit. Fluids 35 (2005) 49–61.
[7] S. Espinosa, S.B. Bottini, E.A. Brignole, Process analysis and phase equilibria for the removal of chemicals from fatty oils using near-critical solvents, Ind. Eng. Chem. Res. 39 (2000) 3024–3033.
[8] V. Riha, G. Brunner, Separation offish oil ethyl esters with supercritical carbon dioxide, J. Supercrit. Fluids 17 (2000) 55–64.
[9] O.J. Catchpole, J.B. Grey, K.A. Noermark, Fractionation offish oils using super-critical CO2and CO2+ethanol mixtures, J. Supercrit. Fluids 19 (2000) 25–37. [10] L. Vázquez, C.F. Torres, T. Fornari, F.J. Señoráns, G. Reglero, Recovery of squalene
from vegetable oil sources using countercurrent supercritical carbon dioxide ex-traction, J. Supercrit. Fluids 40 (2007) 59–66.
[11] T. Fornari, L. Vázquez, C.F. Torres, E. Ibáñez, F.J. Señoráns, G. Reglero, Countercurrent supercriticalfluid extracion of different lipid-type materials: ex-perimental and thermodynamic modelling, J. Supercrit. Fluids 45 (2008) 206–212. [12] E.A. Brignole, P.M. Andersen, A. Fredenslund, Supercriticalfluid extraction of
al-cohols from water, Ind. Eng. Chem. Res. 26 (1987) 254–261.
[13] M. Budich, G. Brunner, Supercriticalfluid extraction of ethanol from aqueous so-lutions, J. Supercrit. Fluids 25 (2003) 45–55.
[14] M.S. Díaz, E.A. Brignole, Modeling and optimization of supercriticalfluid processes, J. Supercrit. Fluids 47 (2009) 611–618.
[15] R. Ruivo, A. Paiva, J.P.B. Mota, P. Simões, Dynamic model of a countercurrent packed column operating at high pressure conditions, J. Supercrit. Fluids 32 (2004) 183–192.
[16] J. Fernandes, R. Ruivo, J.P.B. Mota, P. Simoes, Non-isothermal dynamic model of a supercriticalfluid extraction packed column, J. Supercrit. Fluids 41 (2007) 20–30. [17] A. Martín, J.M. Cocero, Mathematical modeling of the fractionation of liquids with supercritical CO2in a countercurrent packed column, J. Supercrit. Fluids 39 (2007)
304–314.
[18] R. Lalam, S. Chamali, S. Camy, D. Rouzineau, R. Kessas, J.-S. Condoret, Fractionation of aqueous isopropanol mixtures in a countercurrent packed column using supercritical CO2, J. Supercrit. Fluids 101 (2015) 24–35.
[19] P.J. Rathkamp, J.L. Bravo, J.R. Fair, Evaluation of packed columns in supercritical extraction processes, Solvent Extr. Ion Exch. 5 (1987) 367–391.
[20] K. Onda, H. Takeuchi, Y. Okumoto, Mass transfer coefficients between gas and li-quid phases in packed columns, J. Chem. Eng. Jpn. 1 (1968) 56–62.
[21] C.J. King, Separation Processes, 2nd edition, McGraw-Hill, 1980.
[22] P.C. Simões, H.M. Matos, P.J. Carmelo, E. Gomes de Azevedo, M. Nunes da Ponte, Mass transfer in countercurrent packed columns: applications to supercritical CO2 extraction of terpenes, Ind. Eng. Chem. Res. 34 (1995) 613–618.
[23] R. Stockfleth, G. Brunner, Hydrodynamics of a packed contercurrent column for the gas extraction, Ind. Eng. Chem. Res. 38 (1999) 4000–4006.
[24] G.F. Woerlee, Hydrodynamics and Mass Transfer in Packed Columns and Their Applications for Supercritical Separations, Delft University Press, Delft, 1997 PhD Thesis.
[25] T. Otake, K. Okada, Liquid hold-up in packed towers, operating and hold-up without gasflow, Kagaku Kogaku (Japanese) 17 (1953) 176–184.
[26] G. Soave, Equilibrium constants from a modified Redlich–Kwong equation of state, Chem. Eng. Sci. 27 (1972) 1197–1203.
[27] J.F. Boston, P.M. Mathias, Phase equilibria in a third-generation process simulator, Proceedings of the 2nd International Conference on Phase Equilibria and Fluid
Properties in the Chemical Process Industries, West Berlin, 1980, pp. 823–849. [28] T. Holderbaum, J. Gmehling, PSRK: a group contribution equation of state based on
UNIFAC, Fluid Phase Equilib. 70 (1991) 251–265.
[29] D.S. Abrams, J.M. Prausnitz, Statistical thermodynamics of liquid mixture: a new expression for the excess Gibbs energy of partly or complete miscible systems, AIChE J. 21 (1975) 116–128.
[30] T.F. Anderson, J.M. Prausnitz, Application of the UNIQUAC equation to calculation of multi-component phase equilibria: 1. Vapor–liquid equilibria, Ind. Eng. Chem. Proc. Des. Dev. 17 (1978) 552–560.
[31] A. Hebach, A. Oberhof, N. Dahmen, Density of water + carbon dioxide at elevated pressures: measurements and correlation, J. Chem. Eng. Data 49 (2004) 950–953. [32] I. Tsivintzelis, D. Missopolinou, K. Kalogiannis, C. Panayiotou, Phase compositions and saturated densities for the binary systems of carbon dioxide with ethanol and dichloromethane, Fluid Phase Equilib. 224 (2004) 89–96.
[33] B.E. Poling, J.M. Prausnitz, J.P. O’Connell, The Properties of Gases and Liquids, 5th edition, McGraw-Hill, 2001.
[34] Y. Tanaka, Y. Matsuda, H. Fujiwara, H. Kubota, T. Makita, Viscosity of (water + alcohol) mixtures under high pressure, Int. J. Thermophys. 8 (1987) 147–163.
[35] G. Brunner, Gas Extraction: An Introduction to Fundamentals of Supercritical Fluids and the Application to Separation Processes, Topics in Physical Chemistry vol. 4, Steinkopff; Springer, Darmstadt; New York, 1994.
[36] B.-S. Chun, G.T. Wilkinson, Interfacial tension in high-pressure carbon dioxide mixtures, Ind. Eng. Chem. Res. 34 (1995) 4371–4377.
[37] R. Ruivo, M.J. Cebola, P.C. Simoes, M. Nunes da Ponte, Fractionation of edible oil model mixtures by supercritical carbon dioxide in a packed column. 2. A mass-transfer study, Ind. Eng. Chem. Res. 41 (2002) 2305–2315.
[38] T. Fang, M. Goto, Z. Yun, X. Ding, T. Hirose, Phase equilibria for binary systems of methyl oleate–supercritical CO2andα-tocopherol–supercritical CO2, J. Supercrit.
Fluids 30 (2004) 1–16.
[39] R. Bharath, H. Inomata, T. Adschiri, K. Arai, Phase equilibrium study for the se-paration and fractionation of fatty oil components using supercritical carbon di-oxide, Fluid Phase Equilib. 81 (1992) 307–320.
[40] O.J. Catchpole, J.B. Grey, K.A. Noermark, Solubility offish oil components in su-percritical CO2and CO2+ ethanol mixtures, J. Chem. Eng. Data 43 (1998)
1091–1095.
[41] M. Tamura, M. Kurata, H. Odani, Practical method for estimating surface tensions of solutions, Bull. Chem. Soc. Jpn. 28 (1955) 83–88.