HAL Id: pastel-00781220
https://pastel.archives-ouvertes.fr/pastel-00781220
Submitted on 25 Jan 2013HAL is a multi-disciplinary open access
archive for the deposit and dissemination of sci-entific research documents, whether they are pub-lished or not. The documents may come from teaching and research institutions in France or abroad, or from public or private research centers.
L’archive ouverte pluridisciplinaire HAL, est destinée au dépôt et à la diffusion de documents scientifiques de niveau recherche, publiés ou non, émanant des établissements d’enseignement et de recherche français ou étrangers, des laboratoires publics ou privés.
Clotilde Patry
To cite this version:
Clotilde Patry. Impacts of genomic selection on classical genetic evaluations. Agricultural sciences. AgroParisTech, 2011. English. �NNT : 2011AGPT0073�. �pastel-00781220�
AgroParisTech INRA GABI
Domaine de Vilvert, 78350 Jouy-en-Josas, France
présentée et soutenue publiquement par
Clotilde PATRY
le 9 décembre 2011
Impacts of genomic selection on classical genetic evaluations
Les impacts de la sélection génomique sur les évaluations génétiques classiques
Doctorat ParisTech
T H È S E
pour obtenir le grade de docteur délivré par
L’Institut des Sciences et Industries
du Vivant et de l’Environnement
(AgroParisTech)
Spécialité : Génétique animale
Directeur de thèse : Vincent Ducrocq
Représentant CIFRE UNCEIA :Laurent Journaux JuryM. Etienne VERRIER, Professeur, AgroParisTech, France Président M. Erling STRANDBERG, Professeur et chef de département, SLU, Suède Rapporteur M. Zengting LIU, Chef de projets Recherche et Développement, VIT, Allemagne Rapporteur M. Laurent JOURNAUX, Responsable du service génétique, UNCEIA, France Examinateur M. Vincent DUCROCQ, Directeur de Recherche, INRA GABI, France Examinateur
Abstract
In 2011, genomic evaluations have been implemented in 16 countries and at least 7 dairy cattle breeds. Selection decisions are no longer based on breeding values estimated after progeny testing but on those obtained after genomic predictions. In less than 4 years, the use of these early and accurate genomically enhanced breeding values (GEBV) was integrated in breeding schemes. This new strategy is called genomic selection.
Applied to mixed linear models, Best Linear Unbiased Prediction (BLUP) is the method used for national genetic evaluations and its extension, the Multiple Across Country Evaluation (MACE) is performed at the international level. With genomic selection, the selection process is no longer fully described in mixed model equations: only the selected candidates have actual progeny records and are included in the analysis. This violates the implicit assumption of random Mendelian sampling contribution used in BLUP applied to an animal model. Breeding value estimates are feared to be biased and less accurate. Because of incomplete and incorrect national information, MACE solutions would also be affected.
The adoption of genomic tools is fast and worldwide. It is therefore important to consider the consequences of a genomic selection step in breeding schemes on the current genetic evaluations. This is relevant at the national and international levels.
Based on real data in the Holstein population, bias was assessed by simulation. It was first measured in a French national evaluation and then on three country scales after international evaluations. Different levels of selection intensity and of genetic correlations between country scales were tested.
These simulations showed evidence of significant biases in classical evaluations. The breeding values of the genomically selected young sires were clearly underestimated at the national level and estimates were less accurate. These cohorts were also the most penalized in international rankings. They were even more affected when national breeding values were not only incomplete but also incorrect. In fact, bias could propagate to relatives and foreign populations on the different country scales. It is not only necessary but urgent to account for the genomic selection step in national evaluations.
The main requirement is to include all genotyped candidates in national evaluations, i.e., the selected and the culled ones based on their GEBV. One approach was tested to do so: the GEBV of all candidates were converted into pseudo-performances and associated with an appropriate weight derived from the genomic reliability. It was implemented under simplistic assumptions and gave satisfactory results as it totally eliminated the bias at the national level. However, it is not so straightforward to include genomic information in classical evaluations: some genomic information might be redundant.
Other approaches are proposed to first make GEBV reliabilities more realistic. Besides multi-step approaches for genetic evaluations, a single multi-step procedure including all available information in the same analysis would be more satisfactory. Genomic information is more properly distributed to the whole population. Computational strategies based on an iterative procedure were suggested to implement it. This could be the most optimal solution to quickly prevent from bias and at the same time to enhance the accuracy of national evaluations. It still needs to be tested. It is also necessary to develop tests to check whether national evaluations are unbiased after genomic selection before including them in international evaluations. A main consequence of bias corrected breeding values is that all breeding values will include some genomic information in a near future. This is not yet accepted in international evaluations: the latter need to be improved and adapted to deal with GEBV.
Key-words
This research was conducted with the financing from Agence Nationale de la Recherche (ANR,project AMASGEN) and APIS-GENE, at:
Institut National de la Recherche Agronomique (INRA) Génétique Animale et Biologie Intégrative (GABI)
Equipe G2B, génétique et génomique des bovins laitiers et allaitants Domaine de Vilvert
78350 Jouy-en-Josas France
With the support of :
Union Nationale des Coopératives d’Elevage et d’Insémination Animale (« CIFRE » contract n°0679/2008, Association Nationale de la Recherche de la Technologie fundings) UNCEIA
Service Génétique
Maison Nationale des Eleveurs 149, rue de Bercy
75595 Paris Cedex 12 France
In collaboration with: Interbull centre
Dept. Animal Breeding and Genetics
Swedish University of Agricultural Sciences (SLU) Box 7023
75007 Uppsala Sweden
A mon père,
Pour sa passion, son combat et ses paradoxes
“[The captain] had bought a large map representing the sea, Without the least vestige of land: And the crew were much pleased when they found it to be A map they could all understand.” Lewis Carroll – The hunting of the Snark
.
Abbreviations
AI Artificial or animal insemination BLUP Best Linear Unbiased Prediction DGV Direct Genomic Value
DRP De-Regressed Proof DYD Daughter Yield Deviation EBV Estimated Breeding Value
(g)EDC (Genomic) Effective Daughter Contributions EN Elastic-Net
GEBV Genomically Enhanced Breeding Value G-BLUP BLUP using a Genomic relationship matrix HMME Henderson Mixed Model Equations
Interbull International Bull Evaluation Service MACE Multiple Across Country Evaluation MS Mendelian Sampling
MAS Marker Assisted Selection MSE Mean Squared Errror PA Parent Average
PEV Predictor Error Variance PT Preferential Treatment QTL Quantitative Trait Loci R² Reliability
RP Reference Population
SNP Single Nucleotide Polymorphism TBV True Breeding Value
CONTENTS
Abstract ... 2
Key-words ... 3
Abbreviations ... 9
CHAPTER 1 - General Introduction ... 14
1.1. Background: the emergence of genomics in dairy cattle breeding ... 14
1-1.1. An additional type of information for breeding value estimation ... 14
1-1.2. The potential of genomic information: an increased genetic gain ... 14
1-1.3. A fast and wide development of genomic evaluations ... 14
1-1.4. Changes in genetic evaluations, breeding strategies, and worldwide organisation ... 15
1-1.5. Semantic issues ... 15
1.2. Context of the thesis: the AMASGEN research project ... 16
1.3. Aim of the thesis ... 16
1.4. Outlines of the thesis ... 17
CHAPTER 2 - Genomic selection in dairy cattle: a turning point in breeding value estimation and in breeding strategies ... 20
2.1. Improvement of genetic evaluations using additional information ... 20
2-1.1. The use of an increasing amount of information ... 20
2-1.2. The use of a new type of information, the genomic one ... 25
2-1.3. Combination of genomic and polygenic information: how to get GEBV? ... 27
2.2. New breeding strategies to use genomic information ... 32
2-2.1. Principle and logistics of a regular progeny test scheme ... 32
2-2.2. Moving away from progeny testing schemes ... 32
2-2.3. Optimization of breeding schemes based on genomic information ... 33
2-2.4. Changes in semen distribution ... 35
CHAPTER 3 - The reasons for bias in classical evaluations after a genomic selection step ... 36
3.1. Best and unbiased genetic predictions ... 36
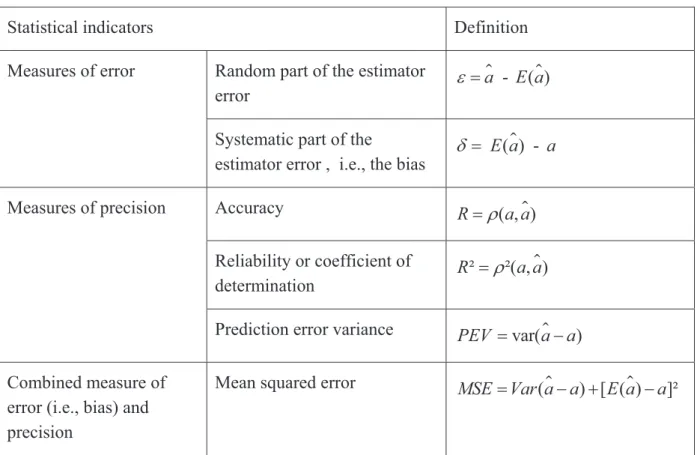
3-1.1. Definitions of bias and precision of an estimator ... 36
3-1.3. Assumptions for optimal properties of BLUP ... 38
3.2. Cases of biases in genetic evaluations ... 39
3-2.1. Biases due to selection in classical evaluations ... 39
3-2.2. Other sources of bias in classical evaluations ... 39
3-2.3. Mechanisms of bias in genetic evaluations ... 40
3-2.4. The use of molecular information: new types of selection bias ... 41
3.3. Bias in classical evaluations after a genomic selection step ... 42
3-3.1. Genomic selection: the combined effects of “selective phenotyping” and “sequential selection” ... 42
3-3.2. Violation of the mixed model assumptions: biased BLUP solutions ... 42
3-3.3. Bias in MACE solutions ... 42
3-3.4. A worry shared by the international community ... 43
CHAPTER 4 - Bias assessment in national evaluations after a genomic selection step ... 44
4.1. Assessment of bias in breeding value estimates ... 44
4-1.1. Measures of bias and accuracy ... 44
4-1.2. Factors influencing the direction and magnitude of bias ... 45
4.2. Our simulation study ... 46
4-2.1. Outlines of the implemented method ... 46
4-2.2. Summary of the simulation results ... 47
Article I ... 48
CHAPTER 5 - Accounting for a genomic selection step in national evaluations ... 60
5.1. Necessity to account for bias ... 60
5-1.1. Long terms problems due to bias in genetic evaluations ... 60
5-1.2. Bias due to genomic selection: a large!scale and urgent problem ... 60
5.2. Approaches to account for selection ... 62
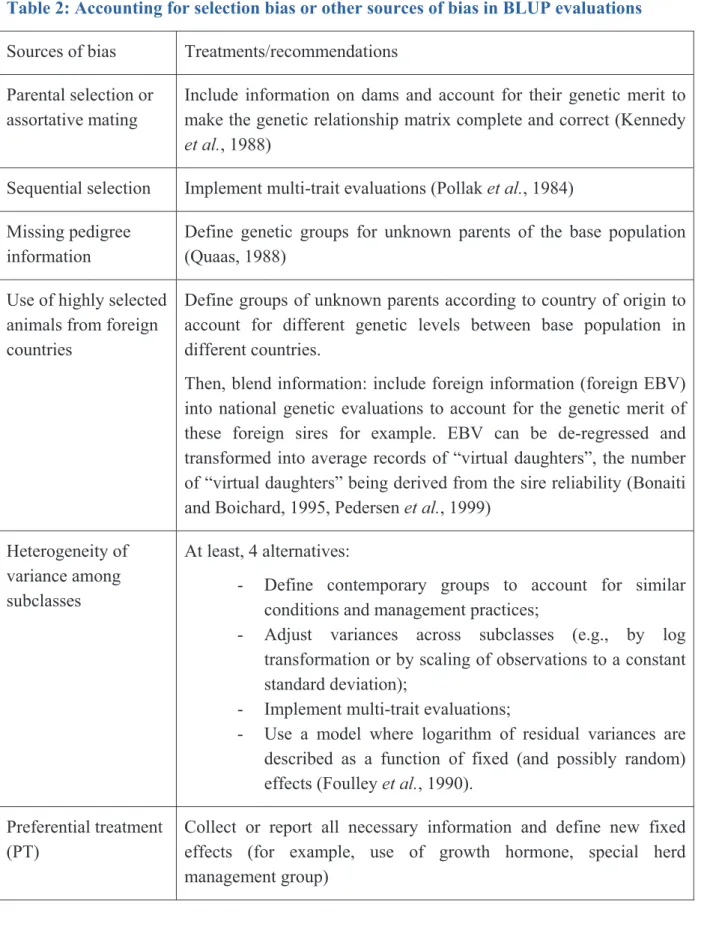
5-2.1. Usual approaches to account for bias in BLUP evaluations ... 62
5-2.2. Alternative approaches to account for genomic selection ... 64
5.3. Our implemented strategy ... 65
5-3.1. Choices for de!regression method and gEDC computation ... 65
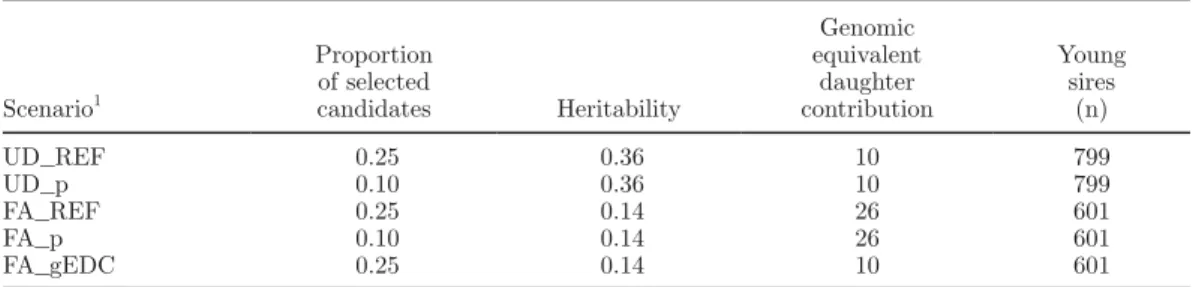
5-3.2. Alternative scenarios ... 65
5-3.4. Main conclusions of the simulation study ... 66
Article II ... 68
CHAPTER 6 - Bias propagation in international evaluations due to genomic selection ... 80
6.1. The roles of Interbull: changes due to genomic selection ... 80
6-1.1. The roles of Interbull ... 80
6-1.2. New Interbull’s roles in the genomic era ... 81
6.2. The importance of international evaluations in the genomic era ... 82
6.3. Risks of biases in international evaluations ... 83
6-3.1. Various strategies between countries to implement genomic selection ... 83
6-3.2. Two main sources of bias in international evaluations ... 83
6.4. Bias assessment in international evaluations ... 83
6-4.1. General strategy ... 83
6-4.2. Summary of the simulation results ... 84
Article III ... 86
CHAPTER 7 - General Discussion ... 106
7.1. Limits and contributions of the study ... 106
7-1.1. Limits of the simulation strategies and analyses ... 106
7-1.2. A better understanding of the bias mechanisms after simulations of genomic selection ... 107
7.2. Consequences on classical and genomic evaluations ... 109
7-2.1. The extent of bias in classical evaluations... 109
7-2.2. Widespread problems from biased classical evaluations ... 111
7.3. Techniques and methods to avoid bias propagation ... 114
7-3.1. Methods to prevent bias in national genetic evaluations ... 114
7-3.2. Possible implementations of these approaches in routine evaluations ... 120
7-3.3. Techniques to avoid bias propagation in international genetic evaluations... 124
CHAPTER 8 - General Conclusion ... 128
8.1. Impact of genomic selection on genetic evaluations ... 128
8-1.1. An established risk for genetic evaluations ... 128
8-1.3. A relatively easy approach to implement at the national level ... 129
8.2. A broader scope of the questions related to bias ... 129
8-2.1. Integration of genomic information in classical evaluations: objectives beyond the bias issue ... 130
8-2.2. Perspectives: genomic information propagated in all estimations of breeding values ... 130
8-2.3. Unsolved issues at the international level: incompatibilities with MACE ... 131
8.3. Perspectives for international collaborations in the dairy cattle breeding organization . 132 8-3.1. Economical and technological context: a high competitiveness ... 132
8-3.2. Opportunities and fears generated by genomic selection ... 132
8-3.3. The on!going changes in the organization of the world dairy cattle breeding ... 133
8-3.4. New market strategies and players ... 133
REFERENCES ... 136 Table of illustrations ... 142 Publications ... 144 Peer!reviewed publications ... 144 Other publications ... 144 Co!authored publications ... 144 Résumé ... 146 Mots-clés ... 150
CHAPTER 1
- General Introduction
1.1. Background: the emergence of genomics in dairy cattle
breeding
1-1.1. AN ADDITIONAL TYPE OF INFORMATION FOR BREEDING VALUE ESTIMATION
After the first sequencing of the whole bovine genome in 2006, hundreds of thousands of DNA markers in the form of Single Nucleotide Polymorphisms (SNP) were discovered throughout the genome. It dramatically increased the pool of usable molecular information to enhance the quality of genetic evaluations in dairy cattle. At the same time, the dramatic reduction in genotyping costs (costs have been divided by 1 million in ten years!) made this technology available for routine use in dairy breeding schemes.
1-1.2. THE POTENTIAL OF GENOMIC INFORMATION: AN INCREASED GENETIC GAIN
Genetic progress in dairy cattle depends on the accuracy of genetic evaluations, the intensity of selection and the generation interval. The potential for molecular information to improve the rate of genetic gain has been known for decades (Smith, 1967, Soller and Beckmann, 1983). Marker-assisted selection has improved somewhat the efficiency of breeding programs (Dekkers, 2004) but its implementation has been very limited (Boichard et al., 2010). The accessible marker genotypes information for males and females now provide early and accurate information at reasonable costs. Breeding values can now be estimated using the genome-wide dense information and then used as early selection tools. This is called genomic selection. Its implementation offers great potentials for increasing and managing a genetic gain.
1-1.3. A FAST AND WIDE DEVELOPMENT OF GENOMIC EVALUATIONS
In 2006, Powell and Norman reported that “we may be past the time when there will be revolutionary changes in genetic evaluation techniques. […] Changes will likely be incremental, each addressing some shortcoming of the prior system.” Just one year later, Goddard and Hayes (2007) reviewed the potential for genomic selection and reported that “Widespread use of DNA markers will have a major impact on the structure of the breeding programs and a significant impact on production systems more generally.” In 2008, genomic evaluations were run in 8 countries (Canada, Denmark, France, the Netherlands, New-Zealand, the USA, and Sweden) for the Holstein breed. In 2009, a first international workshop about “Genomic Information in Genetic Evaluations” was organized by Interbull (International Bull Evaluation Service) in Uppsala (Sweden). In 2010, genomic evaluations
were performed for 13 populations including 5 dairy breeds and 10 countries (Nilforooshan et al., 2010). Now, 16 countries can be identified as having implemented genomic evaluations: to the first 8 ones, we can add Germany in 2009, Finland, Austria, Ireland, Switzerland and Poland in 2010 and at least Italy and UK in 2011. Japan also developed genomic evaluations at a research stage. Moreover, genomic evaluations are not only performed for the Holstein breed but also for the Brown Swiss, the Fleckvieh, the Jersey, the Mondbéliarde, the Normande and the Red Nordic breeds. Some authors (Hayes et al., 2009) reported that “genomic selection is revolutionizing dairy cattle breeding”.
1-1.4. CHANGES IN GENETIC EVALUATIONS, BREEDING STRATEGIES, AND WORLDWIDE ORGANISATION
Genomic technologies are changing genetic evaluation techniques. New statistical and computational developments have emerged to analyze genomic information and enhance the quality of genetic predictions.
To fully benefit from the opportunities generated by genomic selection, the design of breeding strategies must be adapted to take advantage of the early and accurate genomically enhanced breeding values. New breeding strategies have been developed and implemented in less than 4 years moving away from progeny testing. Selection objectives have been or are being reviewed to put more emphasis on functional traits with low heritability but with better perspectives for improvement due to genomic selection (Ducrocq, 2010). Expectations of breeding companies and farmers also include a wide access to cheaper and efficient genotyping technologies as well as the development of innovative herd management tools. At the same time, the dairy cattle breeding world is moving toward an unbalanced market with competitive advantages for companies implementing genomic selection. In just a few years, the development of genomic evaluations and the implementation of genomic selection have led to a high competitiveness worldwide between not only breeding companies but also between research/computing centers for genetic predictions. In such a context, the necessity to keep on computing international genetic evaluations (as routinely delivered by the Interbull centre) was first questioned before to be reinforced because of their strategic role in multinational reference populations created for accurate genomic predictions.
1-1.5. SEMANTIC ISSUES
Genomics is a developing field and a large diversity of expressions can be found in the literature. The term “Genomic Selection” was first introduced by Haley and Visscher at the World Congress of Genetic Applied to Livestock Production (6th WCGALP) in 1998 and refers either to a field of research (Goddard and Hayes, 2007) or an approach to estimate breeding values (Meuwissen et al., 2001) or a tool for selection decisions (Hayes et al., 2009). In the present manuscript, “genomic selection” is explicitly differentiated from “genomic evaluation”. The procedure that delivers estimated breeding values based on molecular
information will be called “genomic evaluation” whereas “genomic selection” will refer to the selection decisions based on these genomic breeding values.
Another source of misunderstanding is the name given to evaluations based on the use of phenotypes and pedigree only. Scientists call these either “traditional”, “conventional” or “classical” evaluations, but also “BLUP evaluations”, “polygenic evaluations” or simply “genetic evaluations”. The first three alternatives are not precise and tend to be pejorative. The other ones are not valid strictly speaking: BLUP method for “Best Linear Unbiased Predictions” is the most widely implemented method to estimate breeding values based on phenotypic and pedigree information. However, genomic predictions may also rely on BLUP-derived methods. They may also include polygenic information, i.e., information on phenotypes and pedigree, and genomic predictions are now one particular step of the genetic evaluation process.
None of these denominations are strictly correct but for the sake of clarity, “classical evaluation” is the term chosen in this manuscript. Each type of evaluations, the genomic and the classical ones, will be considered as a step of the process for delivering an estimation of breeding values and the entire process will be called “genetic evaluation”.
1.2. Context of the thesis: the AMASGEN research project
In France, a research project called AMASGEN was launched in 2009 by INRA (the French research institute for agriculture) with the collaboration of professionals from the federation of breeding and AI (artificial or animal insemination) cooperatives (Union Nationale des Coopératives d’Elevage et d’Insémination animale, UNCEIA). The main aim of this project was to develop a method to combine genomic information from genotyped animals with the information from phenotypes and pedigree for a fast and large implementation of the genomic selection in the French dairy cattle breeding schemes. The fifth and last work package of this project was dedicated to the aim of this study.
1.3. Aim of the thesis
With the emergence of the genomic era, it has become relevant to consider the consequences of a genomic selection step in breeding schemes on the current genetic evaluations at the national and international levels. This motivated the present study focusing on four main questions:
- Does genomic selection impact the classical predictions of animal breeding values computed using linear mixed models and how?
- How can we measure potential biases, i.e., systematic over- or underestimations of breeding values, in classical genetic evaluations?
- Which methods can therefore be proposed to address this issue?
1.4. Outlines of the thesis
Chapter 2 of this thesis aims at highlighting the recent changes in prediction methods and on design of breeding schemes due to the availability of molecular information. This chapter first presents how in the past the gain in amount of information for the estimation of breeding values motivated the adaptation of statistical models and methods. The respective BLUP and MACE (Multiple Across Country Evaluation) methods for the national and international evaluations are described. The principles of genomic evaluations are described as well as the current approaches suggested to combine genomic and classical evaluations. The estimation of breeding values has been strongly based on the implementation of progeny testing programs. This chapter also depicts their usual organization and how breeding programs are currently reconsidered to take advantage of genomic information.
Chapter 3 explains why a genomic selection step could be an issue in genetic evaluations. The statistical definition of bias is given and the properties of BLUP are described. Biases in BLUP solutions have been a recurrent problem in the past. They have often been caused by missing information after selection. With the access to molecular information, new types of bias have appeared and are reviewed. This chapter also explains why not only BLUP but also MACE solutions might be biased after implementation of a genomic selection step.
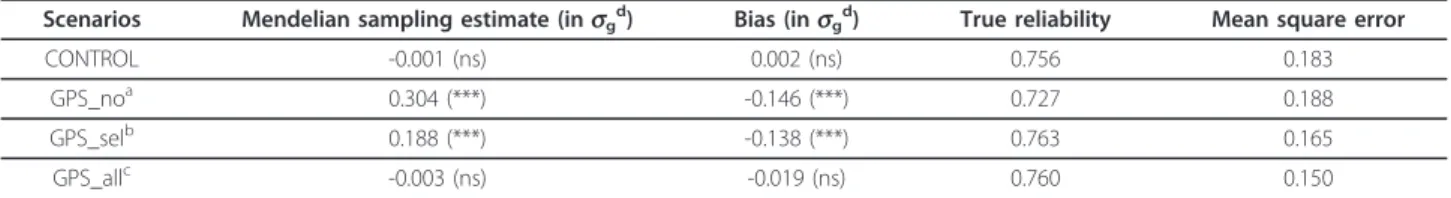
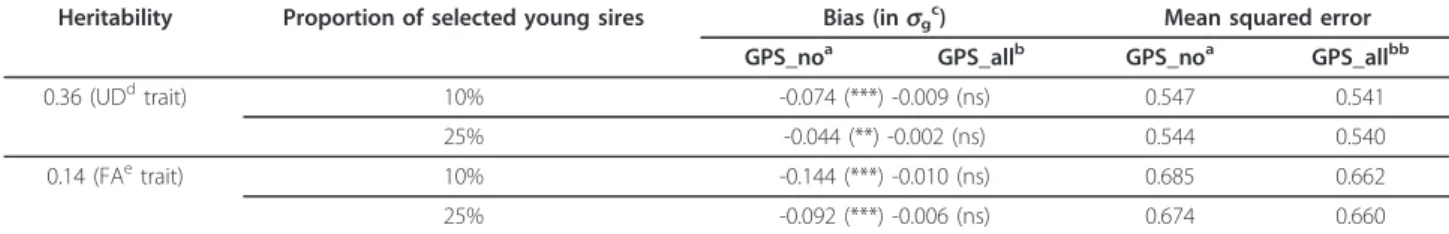
Chapter 4 focuses on the bias assessment in national evaluations after genomic selection. Experiences from the past can help in identifying the factors influencing bias direction and magnitude and in suggesting methods to measure such a bias. Based on real and simulated data, one strategy is proposed and applied. Methods and results for assessing bias in BLUP solutions are presented in a first article: Patry, C. and V. Ducrocq. 2011. Evidence of biases in genetic evaluations due to genomic preselection in dairy cattle. J Dairy Sci 94:1011-1020 (article I).
Chapter 5 explains why it is necessary (and how) to account for genomic selection in national evaluations. The potential scope of bias due to genomic selection might become large enough to make necessary finding ways to avoid it. BLUP adjustments from past experiences and recent propositions to account for genomic selection are reviewed. A strategy is defined, relying on the simulation framework developed to assess bias in article I. Methods and results of this approach are presented in a second article: Patry, C. and V. Ducrocq. 2011. Accounting for genomic pre-selection in national BLUP evaluations in dairy cattle. Genet Sel Evol 43:30 (article II).
In chapter 6, the importance of avoiding the propagation of bias at the international level is examined. International evaluations are delivered by Interbull. The roles of this organisation and how they are changing are described. International genetic evaluations are important for the accuracy of genomic predictions. So, it is relevant to prevent international
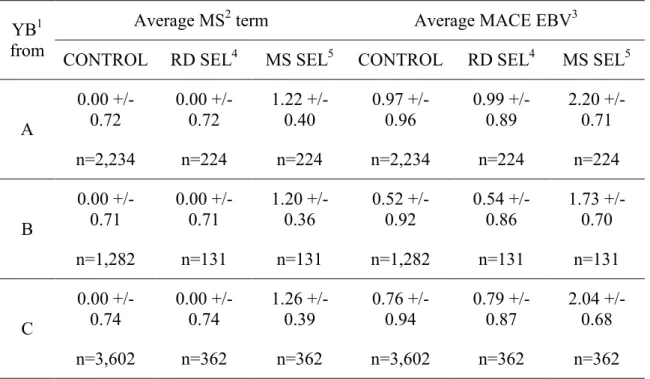
breeding values from being biased. Two issues are identified: completeness and correctness of the data sets provided by participating countries to Interbull. Based on real and simulated data, bias due to genomic selection and its spread are assessed in international evaluations. Methods and results are presented in a third article: Patry, C., H. Jorjani and V. Ducrocq. Implementation of genomic selection at national level: impact of pre-selected and biased national BLUP evaluations on international genetic evaluations, submitted to J Dairy Sci on September, 27th , 2011 (article III).
A general discussion of the methods and results follows in chapter 7. The first part is dedicated to the limits and contributions of the methods implemented to measures bias in national and international evaluations after genomic selection. In the second part, the impact of such a bias in genetic evaluations is evaluated from the statistician’s but also from the breeder’s point of view. The relevance of the implemented method to account for genomic selection in breeding schemes at the national level is discussed as well as ways to improve it based on alternative approaches. Some propositions are addressed to avoid the propagation of bias in international genetic evaluations
Chapter 8 concludes on the opportunities and risks generated by a bias in the genetic evaluations due to genomic selection. The consequences on the world dairy breeding organization are especially examined.
CHAPTER 2
- Genomic selection in dairy cattle: a
turning point in breeding value estimation and in
breeding strategies
The objective of this chapter is to understand how approaches dedicated to breeding value estimation and how dairy cattle breeding strategies are currently evolving to benefit from a new type of information, i.e., the genomic information coming from dense molecular markers, in the case of dairy cattle.
2.1. Improvement of genetic evaluations using additional
information
2-1.1. THE USE OF AN INCREASING AMOUNT OF INFORMATION
This section presents from a historical perspective the incremental evolutions of statistical models and methods for estimation of breeding values. Many changes occurred during the late 20th century but the following description only refers to the elements participating in the analysis of an increasing number of records in order to enhance the quality of genetic evaluations. Models, variance components and methods are systematically described using matrix notations as in Mrode (2005) who published an extensive overview of linear models for the prediction of animal breeding values.
Statistical basis for breeding value estimation
Prediction of breeding values is a key element to implement breeding schemes. The quality of genetic evaluations usually depends on the availability of trait records. Data for genetic evaluations in dairy cattle are commonly collected at national level.
Variations among records or phenotypic observations are explained by environmental and genetic factors. Mixed linear models are chosen to analyze records: environmental effects are considered as fixed whereas the genetic effects and the residuals are considered as random. The statistical model for genetic predictions is, in matrix notation:
! " " y Xb Zu e [1]
where y is the vector of records, X and Z are incidence matrices relating animals to effects, b is a vector of fixed environmental effects, u and e are vectors of genetic and residual random effects.
The BLUP method, for Best Linear Unbiased Prediction, was developed by Henderson (1963, 1973) and relies on the simultaneous estimation of fixed and random effects, accounting for genetic relationships among the animals to evaluate. This method has been widely
implemented because of its optimal properties: BLUP solutions are known to be unbiased and to be the most accurate predictors among the linear functions of the data. BLUP was first implemented under a sire model, i.e., s replaces u in [1]. BLUP equations are also called Henderson’s Mixed Model Equations (HMME) and are usually written as:
s # $ % $ % $ % ! & ' & ' & ' & ' ( ) ( ) ( ) -1 -1 -1 -1 -1 -1 -1 b X'R X X'R Z X'R y Z'R X Z'R Z + A s Z'R y [2]
R and G are the residual and sire genetic variance-covariance matrices, A is the numerator relationship matrix for sires such as the variance of sire effect is: 2
var( )s !A*s with * being s the sire standard deviation of the trait. s is the variance ratio between residual and sire variances: 2 2 4 ² ² e s s h h * # * +
! ! with h² the trait heritability.
In the history of livestock improvement, BLUP-based methods to estimate breeding values have been continuously improved to include more information and increase accuracy of the estimation under computing constraints (Powell and Norman, 2006). One major objective is to deliver early estimated breeding values (EBV) with sufficient accuracy, so that selection decisions can be made as soon as possible.
From sire to animal models
The additive genetic value a of an animal i depends on its parent breeding values (as and ad) and on its Mendelian sampling contribution (!), being the result of recombination and segregation of sire and dam alleles during gamete formation:
1 1
2 2
i s d i
a ! a " a ", [3]
Initially, only sires were evaluated with a sire model and the genetic merit of their mate, the dam (d) was not accounted for. This led to bias in the predicted breeding values when genetic trends started to generate heterogeneity in the genetic level of dams. One of the first advances has been to consider all relationships so that all animals, males and females, are simultaneously evaluated. Animal model has often replaced sire model. Since 1992, animal model has been considered as the standard method for national evaluation systems (Interbull, 1992):
! " " y Xb Za e [4]
a is the vector of random animal effects with var( )a !A*a2, * being the genetic standard a deviation of the trait. The corresponding variance ratio is
2 2 1 ² ² e a h h * # * + ! ! . Note that 2 2 4 a s * ! * .
y is the vector of actual or pre-corrected records. For cows, pre-corrected records may consist in “Yield Deviations” which are weighted averages of cow’s performances corrected for all
effects except genetic merit and residuals. For sires, it is common to use Daughter Yield Deviations (DYD) which are weighted average of daughter records corrected for all fixed effects and the breeding values of their dam (Van Raden and Wiggans, 1991). To define the daughter contribution in the model, these authors proposed to replace the number of daughters per sire by daughter equivalents (DE), weights actually derived from reliabilities (R²) and a variance ratio (k) to traduce the precision of daughter information:
2 2 1 i i i kR DE R ! + [5]
Animal model drastically increases the number of equations compared with sire models to increase computational difficulties and time. However, animal model has interesting properties, as described by Kennedy et al. (1988). These authors showed that, when used with the complete additive genetic relationship matrix, the animal model can account for changes in genetic mean and variance due to drift, non random mating or selection.
From single trait to multi-trait analyses
Selection is actually based on a combination of several traits of interest. It is more realistic to simultaneously evaluate animals on several traits of interest. Multi-trait analyses use the phenotypic and genetic correlations between these traits. The first use of BLUP for multi-trait evaluation was described in 1976 (Henderson and Quaas).
The model for the analysis of two traits (1 and 2) can be written as:
$ % $ % $ % $ % $ % $ %
& ' & ' & ' & ' & ' & '
( ) ( ) ( ) ( ) ( ) ( ) 1 1 1 1 1 1 2 2 2 2 2 2 y X 0 b Z 0 a e = + + y 0 X b 0 Z a e [6]
G is the matrix of additive genetic variance-covariance and is written as:
$ % $ % & ' & ' ( ) ( ) 1 11 12 2 21 22 a g A g A G = var = a g A g A [7]
with g11 and g22 being the additive genetic variance for traits 1 and 2 and g12 = g12 the additive genetic covariance between the two traits. R is the matrix of residual variance-covariance and is written as:
$ % $ % & ' & ' ( ) ( ) 1 11 12 2 21 22 e r I r I R = var = e r I r I [8]
where r11, r22, r12, r21 are the variances and co-variances for residual effects. It follows that the HMME for multi-trait analyses are:
$ % $ % $ % ! & ' & ' & ' & ' ( - )( ) ( ) -1 -1 -1 -1 -1 1 -1 -1 b X'R X X'R Z X'R y Z'R X Z'R Z +A G a Z'R y [9]
$ % & ' ( ) 1 2 X 0 X = 0 X , $ % & ' ( ) 1 2 Z 0 Z = 0 Z , ! ! $ % & ' & ' ( ) 1 2 b b = b , ! ! $ % & ' & ' ( ) 1 2 a a = a and $ %& ' ( ) 1 2 y y = y [10]
Again, multi-trait analyses increases accuracy of breeding value estimation. The gain from using correlated traits is partitioned into a direct gain from measuring other traits and a gain because fixed effects are estimated more precisely. Use of residual covariance between traits allows for better data connectedness (Thompson and Meyer, 1986).
From national to international evaluations
Throughout the 1980s, export of North American Holstein semen to other countries became widespread (Powell and Norman, 2006). These bulls had a large number of daughters in several countries and were evaluated in several places. For a sire, at an early stage of its productive life, combining pedigree and performances at the international level is known to increase the accuracy of its breeding value estimates in the evaluation system of the importing country. Moreover, the need for a tool for international comparisons was an important issue for fair exchange of semen and for genetic improvement programs.
In 1994, Interbull started to combine national genetic evaluations across countries and provided evaluations for all bulls on each participating country’s scale with 4 Nordic countries and 2 breeds.
In August 1995, the Multiple Across Country Evaluation (MACE) proposed by L. R. Schaeffer (1994), was adopted. This sire model for multi-trait analysis considers each trait evaluated in a country as a different trait from the one evaluated in the other countries. Therefore, different levels of heritability among countries and genetic correlations between countries less than one are used. In fact, the genetic correlations account for differences among countries in national models for data collection and genetic evaluations and for genotype by environment interaction. Finally, this model assumes a zero residual co-variances between countries as daughters are supposed to be recorded in only one country.
The MACE model requires:
- an international relationship matrix including sires and maternal grand-sires born in all participating countries. This pedigree is currently evolving toward a sire-dam pedigree (Jakobsen and Fikse, 2009).
- de-regressed proofs (DRP) of bulls as observations (Sigurdsson and Banos, 1995). DRP are a vector of pseudo-performances derived from national estimated breeding values and free from pedigree information. DRP are used as proxies of DYD.
- Effective daughter contributions (EDC) (Fikse and Banos, 2001) to weigh these phenotypes instead of the number of daughters of each sire. EDC consider together the contemporary group structure, the correlation between repeated records, and the reliability of dams:
j j(o) kR ( ) 4-R (1 ( )) i j dam o EDC R o ! . "
/
[11]Summation is over all daughters j of a sire i, 4 ² ²
h k
h +
! and Rj(o) is the reliability of animal j’s own record, Rdam(o) is the reliability of the dam of j’s own performance.
The MACE model for DRP submitted by country c (i.e., provided to Interbull) is usually denoted:
c 0
c i c c c c
y = 1 + Z Qw + Z s + e [12]
where c is the mean effect for country c, wc is a vector of genetic effect for groups of unknown parents (Quaas, 1988), Q is the matrix that relates sires to these groups. The latter are defined for unknown sires and maternal grand-sires on the basis of their country of origin, year of birth of their progeny and selection paths. Given two countries (1 and 2) and n bulls, the genetic variance-covariance matrix is:
11 12 21 22 var nn nn nn nn g g g g $ % $ % ! & '! & ' ( ) ( ) 1 2 A A s G A A s [13]
Given Di for the diagonal matrix of EDC in country c, the matrix of residual variance-covariance is: 2 1 2 2 0 var 0 e e * * $ % $ % ! & '! & ' ( ) ( ) 1 1 2 2 e D R e D [14]
Following the manipulation of HMME proposed by Quaas (1988) to more easily account for genetic groups of unknown parents, the HMME for multi-trait analysis are (new parts appear in red): ! ! + -+ - -$ % $ %& ' $ %
& - '& ' & '
& '& ' & '
& ' & ' ( )&( ') ( ) -1 -1 -1 -1 -1 --1 -1 -1 -1 -1 -1 -1 1 -1 c X'R X X'R Z X'R y Z'R X Z'R Z + 0 A Q G A G Qw + a = Z'R y 0 Q'A G Q'A G w 0 [15]
In MACE implementation, all relatives, whatever their country of origin, are considered. MACE breeding values especially benefit from good connectedness of the data due to common bulls across countries, i.e., bulls with daughters in several countries, to accurately estimate the country effects.
From single trait MACE to multi-trait MACE
Selection is often based on combined estimated breeding values and especially on total merit indices which are a combination of several breeding values estimated by a multi-trait analysis and weighed by economic values defined at national level. Traits with low heritability are often estimated together with several predictors of higher heritability. EBV for complex traits
are often predicted using traits that are easier to measure. EBV for time-dependent traits can be estimated considering traits measured at different ages as different traits.
To benefit from the sophisticated but heterogeneous national models and the international level of information, the interest in multi-trait analyses for multiple across country evaluation (MT-MACE) is high. This would be particularly relevant for complex traits of high economic interest such as fertility. Such analyses are currently under development (Nilforooshan, 2011) but are not yet routinely implemented.
2-1.2. THE USE OF A NEW TYPE OF INFORMATION, THE GENOMIC ONE
Besides phenotypic observations, a new kind of data - genotypes at molecular markers - can now contribute to the estimation of breeding values: using dense SNP chips, allelic variations at marker loci along the genome are known for each genotyped individual and can be used as proxies of allelic variations in genes nearby.
The contribution of genomic information to selection decisions
Selection decisions depend on the knowledge of an estimated parent average (PA) and an estimated Mendelian sampling contribution (MS) at the time of selection. The use of genome wide approaches is a clear turning point in genetic evaluations as it permits an early estimation of MS terms.
Under classical BLUP approaches, the accuracy of PA estimates is increased by the quantity of information available, i.e., by adding information on the parents themselves or on relatives or on correlated traits. Implementing BLUP under animal model, multi-trait analyses or international evaluations served this objective.
The accuracy of the estimated MS term, using BLUP, is increased by using the individual's own phenotypic record or progeny information, which are obtained relatively late in the life of the animal, i.e., after progeny testing. In contrast, molecular markers can be used to immediately estimate MS contribution at birth (or even before). Meuwissen et al. (2001) demonstrated that genomic evaluation can increase the accuracy of EBV from the increased accuracy of the MS term estimate. Daetwyler et al. (2007) emphasized that the exploitation of MS variation is the major source of increased genetic progress of genome-wide approaches over BLUP approaches.
However, including genomic information into genetic evaluations is not as straightforward as including a larger amount of data: the BLUP model cannot be adapted as in the past. New types of evaluation models have been especially developed to fit this information.
Development of genomic evaluations: principle
Until recently, DNA markers have only been used to search for quantitative trait loci (QTL) in the genome to use them in marker assisted selection (MAS). With the increased density of molecular markers, it becomes possible to find markers in linkage disequilibrium with any QTL. Moreover, because of the knowledge of genome-wide markers, all QTL can be
considered simultaneously. Two approaches have been developed to perform genomic predictions:
Genomic breeding values are derived from prediction equations established in a reference (or training) population:
The method was first proposed by Meuwissen et al. (2001), further developing older ideas, e.g., (Lande and Thompson, 1990). It conceptually involves two steps (Hayes et al., 2009):
- The entire genome is implicitly divided into small segments. Their effects are estimated in a reference population (RP) in which animals are both phenotyped and genotyped. Prediction equations based on these estimations are then derived from the effects of all segments.
- Animals of interest such as selection candidates can be genotyped and their genomic breeding values are predicted as the sum of the effects of the chromosome segments they carry.
Linear and non linear methods can be used to estimate the chromosome segment effects. Among others, least square regression, random regression BLUP, on the one hand, or Bayesian models, on the other hand, are often cited in the literature (de Roos, 2011) . The main difference between these models lies in the assumed distribution of marker effects.
Genomic breeding values are derived from a G- BLUP approach
This alternative strategy consists in computing estimated breeding values from the usual mixed model equations where the relationship matrix between genotyped animals contains relationship coefficients estimated from the similarity between the observed genotypes. BLUP using such a genomic relationship matrix is called G-BLUP (Van Raden, 2008) and can be shown to be equivalent to BLUP on marker effects.
Practical applications of genomic evaluations have shown that linear methods based on BLUP are relatively easy to implement in terms of programming and computing requirements. But Bayesian methods tend to outperform them for traits influenced by a few QTL with large effects (Daetwyler et al., 2010).
Genomic predictions raise a major statistical problem related to the relatively large number of effects to estimate compared with the number of observations. Other methods were therefore developed to reduce the number of SNP by identifying the most informative markers: the Elastic-Net (Croiseau et al., 2011), the Bayesian Lasso (Legarra et al., 2011), the sparse PLS (Colombani et al., 2011) methods among many others were studied for this purpose.
Dependency between genomic and classical evaluations
Genomic evaluations will not replace the evaluations based exclusively on phenotypes. The quality of genomic evaluations closely depends on phenotypes which are analyzed through classical evaluations based on sophisticated genetic models.
In fact, the phenotypic and pedigree-based evaluations provide observations which are used for the estimation of SNP effects in the reference populations. Corrected performances such
as daughter yield deviations or de-regressed proofs can be used as input data for genomic predictions. Moreover, multi-national RP were shown to be beneficial to increase the reliability of genomic evaluations (Lund et al., 2010, Lund et al., 2011, Van Raden et al., 2009). DRP from international genetic evaluations are therefore required as phenotypes. In fact, genomic evaluations are dependent on the national but also international genetic evaluations which rely on BLUP or MACE analyses.
Moreover, in animals (Simianer et al., 2011b) as well as in humans (Maher, 2008), genomic information was shown to only explain a part of the additive genetic variance, the unexplained part being referred to as the “missing heritability” part. Since genetic markers do not explain 100% of the genetic variance, genomic information has to be combined with polygenic information to estimate the complete genetic effects. When genomic information is combined with the polygenic one to compute estimated breeding values, EBV are called “genomically enhanced breeding values” and abbreviated by GEBV.
2-1.3. COMBINATION OF GENOMIC AND POLYGENIC INFORMATION: HOW TO GET GEBV? To increase the quality of the genetic evaluation process, it is not only relevant to increase the quality of genomic predictions of genotyped animals with polygenic information (as seen previously) but also to increase the quality of genetic predictions of non genotyped animals with genomic information of the genotyped ones.
Two alternative approaches exist to combine genomic with polygenic information. On the one hand, multi-steps approaches are currently implemented to blend all types of estimated breeding values. However, not all the population benefits from genomic information of genotyped relatives. On the other hand, a single step approach is being developed to simultaneously estimate the breeding values of genotyped and non genotyped animals whether they are phenotyped or not.
Among single and multi-step approaches, four methods are presented here according to the number of steps involved (from 1 to at least 3) and the population for which GEBV are delivered: only genotyped animals, genotyped animals and their ancestors, or all animals, whether genotyped or not.
Case 1: GEBV computed for genotyped animals only
Genotyped animals are evaluated by genomic evaluation on the one hand and by classical evaluation on the other hand. Genomic breeding values and classical EBV are then combined in a post-processing phase. This approach usually requires two (if genomic predictions are based on the use of a genomic relationship matrix) to three steps (if based on the estimation of marker effects) and is therefore called a multi-step approach.
Before all, classical evaluations are run for all animals with phenotypes (C1 evaluation). The C1 EBV for the genotyped animals in the reference population are converted into phenotypes, e.g., de-regressed proofs or DYD.
Based on the knowledge of genotypes and phenotypes, genomic effects (i.e., marker or breeding value) can be estimated. Direct genomic value or DGV for the genotyped animals are actually computed either from the prediction equations or from a G-BLUP approach (G2 evaluation).
G2 evaluations include less pedigree information than the C1 ones: there are fewer (genotyped) ancestors included in G2. To account for this difference, a third evaluation is run, i.e., a classical evaluation including only genotyped animals and excluding all non genotyped animals such as ancestors and dams (C3 evaluation). Parent average (PA) of genotyped animals can be estimated from C1 and C3.
Finally, the genomic information from DGV is blended with the pedigree information from PA into one final GEBV using selection index theory. This strategy was described by Goddard and Hayes (2007) and implemented by Van Raden et al. (2009) for North American Holstein bulls. The three types of EBV for genotyped animals are weighed by coefficients derived from selection index theory which are function of heritability and accuracies of C1, G2 and C3.
Such an approach benefits to genotyped animals and enhances the quality of their genetic evaluations by combining polygenic information with extra genomic information. However, non genotyped animals do not benefit from the genomic information of their genotyped relatives.
This approach requires 3 evaluation runs and a post-processing treatment to blend all sources of information. Despite the number of steps, this indirect approach was said to be easy to implement using existing software. Another advantage is that only one final value is delivered and expressed on the same scale as classical EBV which is therefore easy to use and to understand by breeders. Such approach is the most frequently implemented one but it is still an approximation and may lead to biased GEBV and overestimated reliabilities (Van Raden et al., 2009)
Case 2: GEBV computed for genotyped animals and their ancestors
Genotyped animals and their non genotyped ancestors can be evaluated in a same evaluation. In fact, genotypes of ancestors should be inferred. The additive genetic value is computed as the sum of genomic and polygenic effects for both groups of animals.
Genomic information from actual molecular marker information (for the genotyped animals) and from inferred molecular marker (for the non genotyped ancestors) are analyzed together with the polygenic information of the ancestors. This strategy has been implemented in France based on Marker-Assisted Selection (MAS) combined to genome-wide information. It is called the G-MAS approach and was described by Boichard et al. (2010) at the 9th WCGALP in Leipzig.
The G-MAS approach relies on a preliminary step which aims at identifying the informative haplotypes using two ways:
- QTL detection based on Linkage Disequilibrium and Linkage Analysis (LDLA) using haplotypes of consecutives SNP (Druet et al., 2008, Meuwissen and Goddard, 2001);
- SNP pre-selection by Elastic-Net (EN) (Croiseau et al., 2011).
It is known that markers and QTL only explain a fraction of the additive genetic variance and the respective weights for polygenic and haplotypic effects have to be given depending on variance components (Guillaume et al., 2008): the variance explained by QTL and SNP is assumed to be between 40 and 60% depending on traits. The variance of each QTL haplotype is estimated by LDLA. All SNP haplotypes detected by EN are assumed to have the same variance.
Before genomic evaluations are performed, missing genotypes and the different marker haplotypes at each QTL need to be inferred whenever it is possible for each evaluated animal. The first step of the genomic prediction process is the computation of phenotypes (DYD or DRP) from the most recent and most complete classical evaluation (previously called C1). In a second step, haplotypic and polygenic effects are jointly estimated in a BLUP-based evaluation (G2). The total breeding value of each animal is then computed as the sum of all QTL effects and the “residual” polygenic component. Using the notations of Guillaume et al. (2008), the model is written as followed:
/
QTL i n v i i=1 y = X + Zu +1 Z v + e [16]where y is the vector of phenotypes; is the vector of fixed effects, u is the vector of random polygenic effects, vi is the vector of random haplotypic effect, e.g., for QTL, e is the vector of random residual errors ; X, Z and
i v
Z are incidence matrices which associate animals to fixed, polygenic and haplotypic effects.
In this case, genotyped animals naturally benefit from the polygenic information and non genotyped ancestors benefit from the genomic information of all relatives included in the relationship matrix in G2.
Case 3: GEBV for all animals, genotyped or not
Two strategies were proposed to analyze simultaneously and more broadly all genotyped and non genotyped animals:
A bivariate approach:
Gianola et al. (2006) proposed to use a bivariate model to simultaneously analyze traits of genotyped and non genotyped animals. They assumed that the breeding value of a genotyped animal is the sum of polygenic and genomic effects and the genomic information is considered as a trait correlated with the polygenic information. Effects are estimated by HMME. However, genomic effects are not estimated for non genotyped animals, only the polygenic effect is estimated. The two-trait linear model was written as:
1 1 1 1 1 2 2 2 2 ( )h 2 ! " ! " ! " ! " ! " ! " # # # $ % $ % $ % $ % $ % $ % & '
& ' & ' & ' & ' & '
y W Z 0 u 0 e
=
y W ( 0 Z u T ) e [17]
y is the vector of phenotypic data (e.g., any trait measurements): y1 consists of records of non genotyped animals, y2 includes records of genotyped animals. is the vector of fixed effects, u the vector of additive genetic effects independent from the marker effects !. In fact, u is a strictly additive polygenic effect. For a given smoothing parameter h, T(h) is estimated in a previous step by semi-parametric procedures (not detailed here). It is assumed that:
- 1 12 12 2 2 2 u u u u * * * * + ! ", ! " -! " . $ % $ % -$ % . & ' & ' / $& %'0 1 2 A A u 0 ~ N , u 0 A A [18] - !j~ N(0,*)2); -1 2 1~N( *e)
e 0, I and e1 is independent from e2: e2 ~N(0, I*e22).
1 2 u * and 2 2 u
* are additive genetic variances in individuals without and with molecular information, respectively and
12 u
* is their additive genetic covariance. 2 )
* is the genetic variance of marker effects.
Once more, non genotyped animals do not fully benefit from the genomic information of their genotyped relatives: u1 is correlated with u2 but not with v.
A single step approach:
Two research groups proposed an alternative method to simultaneously evaluate all genotyped and non genotyped animals in a single step approach. On the one hand, Christensen and Lund (2010) and on the other hand, Misztal et al. (2009), Legarra et al. (2009) and Aguilar et al. (2010) also suggested to predict the additive genetic value of all animals as the sum of polygenic and genomic effects. In contrast with Gianola et al. (2006), genomic effects for the non genotyped animals are inferred from genotyped animals using the pedigree-based relationship matrix as regression coefficients. In fact, the genomic information from genotyped animal is transmitted to non genotyped animals through the relationship matrix: if a1 and a2 are the additive genetic values of non genotyped and genotyped animals combining polygenic and genomic information and 2
a
* is the genetic variance (Legarra et al., 2009): 2
( ) ~ ( ( ) a)
p a | a1 2 N A A a , A12 -122 2 11 -1* [19]
The approach especially relies on a modification of the numerator relationship matrix A into a matrix H by replacing in the pedigree based relationship matrix A the part corresponding to genotyped animals by the genomic relationship matrix G (Misztal et al., 2009):
! " ! " $ % $ % & ' & ' 11 12 11 12 21 21 22 22 A A A A H = = A G A A + (G - A ) [20]
where subscripts 1 and 2 represent ungenotyped and genotyped animals and G is a genomic relationship matrix. This H matrix replaces the usual relationship matrix in a BLUP evaluation of all genotyped and non genotyped animals. But in HMME, it is the inverse of H which is needed. Both research groups discovered that in fact, H-1 has a simple form, which was rather unexpected:
! " $ % & ' -1 -1 -1 -1 22 0 0 H = A + 0 G - A [21]
To avoid potential problem due to singularity with the inversion of H, G can be modified as: (1 )
w w
1 r# 2 22
G G A [22]
where w can be interpreted as the relative weight of the polygenic effect needed to explain the total additive variance (Christensen and Lund, 2010), Gr is the original matrix constructed from genotypes before including weights.
Single step procedures are therefore considered as a natural way to combine all types of information on all animals. However, there are difficulties to implement single step procedures for large numbers of genotyped animals, to adapt to complex genetic models and to consider foreign genotyped bulls without domestic daughters.
Conclusion: From sire to animal model, from single to multi-trait analyses, from national to international evaluations, the genetic predictions have been enhanced by including an increasing amount of information. Information on relatives, on correlated traits at the national and then at the international level has been continuously added. With genomic information, a new kind of evaluation has emerged which now needs to be combined with the classical sources of information. Multi-step approaches are already implemented but the entire population do not benefit yet from the availability of genomic information. Single step approaches are promising but require heavy software adaptations.
2.2. New breeding strategies to use genomic information
2-2.1. PRINCIPLE AND LOGISTICS OF A REGULAR PROGENY TEST SCHEME
Progeny testing has been intensively used for decades in dairy cattle breeding schemes to identify bulls of high genetic merit. Given breeding objectives and parent information, a sample of bulls is randomly mated to cows to get daughters with performances in different environments. After progeny testing, based on more accurate PA and MS estimations, full-sib or half-sib bulls can be ranked.
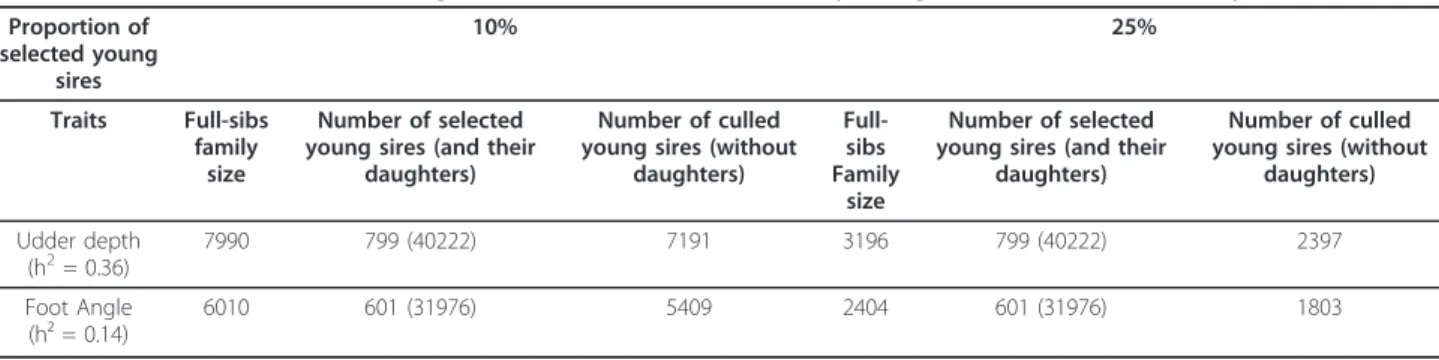
Among others, Schaeffer (2006) precisely described the logistics for progeny testing. Elite females are identified each year to become dams of young bulls and these are mated to the best sires from the current generation, the sires of bulls. These sires are highly selected and can be imported from foreign breeding schemes. Young bull calves are purchased by breeding companies and moved to studs. Once young bulls are sexually mature, i.e., at 1 year of age or a bit more, they are mated to a sample of cows in the population in order to produce a minimum number of daughters (e.g. 100) recorded for different trait groups such as production, conformation, functional, calving ease, etc… Once these daughters have completed their first lactations, the young bulls get their first EBV. For production traits, the reliability of EBV is usually about 75% or more. At this point, the young bull is “proven”: it may be culled or returned to service. The entire process of progeny testing takes about 5 to 6 years.
2-2.2. MOVING AWAY FROM PROGENY TESTING SCHEMES Several designs to implement genomic selection
Three main strategies can be envisioned to integrate a genomic selection step in dairy breeding schemes.
Strategy I: genomic selection as a pre-selection tool
The first strategy consists in selecting young bull calves based on their genomic breeding values before entering regular progeny testing.
Marker assisted selection was already envisioned as such a pre-selection tool as it provided a smaller gain in accuracy than genomic selection. Such a strategy was implemented in France between 2001 and 2008 with the first Marker-Assisted Selection (MAS) program based on microsatellites markers and between 2008 and 2009 with the second MAS program based on SNP markers (Fritz and Guillaume, 2008).
Currently, some AI companies have decided to reinforce their progeny testing program together with the implementation of a genomic pre-selection step (e.g., ABS breeding company in the USA). This is a way to increase selection intensity while at least keeping the
same level of reliability as progeny testing provided for the choice of elite sires. This is also a way to get both GEBV and EBV for all sires.
Strategy II: disuse of progeny testing schemes
In the second strategy, genomic selection may completely replace progeny testing to identify bulls with high genetic merit and to take final selection decisions. In some countries, this conversion is already well advanced (France, Germany) and some bull barns were closed or will be used to house more young bulls (Ducrocq and Santus, 2011).
However, two options can be recognized: the selected young bulls are used for service either with (1) or without (2) restriction. According to the first option, young bull semen are distributed for a short period of time or for a restricted number of mating. Some AI companies, e.g., Semex in Canada, CRV in the Netherlands or CREAVIA in France, among others, have decided to limit AI services. In this case, sires are still being progeny tested but through commercial sales rather than through an established progeny testing scheme (Ducrocq and Santus, 2011). It mainly aims at buffering the risks due to lower GEBV reliabilities and it favors random mating for better data recording and breeding value estimation.
Strategy III: disuse of national breeding programs
Finally, some countries may abandon their own breeding program in the future and simply import bulls based on prediction equations derived on their local conditions (Goddard and Hayes, 2007).
2-2.3. OPTIMIZATION OF BREEDING SCHEMES BASED ON GENOMIC INFORMATION
Genomic tools are now used to optimize breeding schemes. Various key-elements might be depicted to benefit from the advantages of genomic selection over progeny testing:
Management of genetic gain Reduction of generation interval
Because of information on MS term, GEBV at birth were shown to be far more accurate than classical EBV at birth, i.e., parent average (PA). Van Raden et al. (2009) reported an average gain in reliability of 23% for genomic predictions compared with published PA over 26 traits from low to moderate heritability. Gains are consistent with those observed in France in Holstein breed based on either national or multi-national reference population: averaged over four traits of interest, reliability of GEBV was respectively 20% and 29% higher than the reliability of PA (Lund et al., 2011).
It follows that GEBV accuracies of young bulls are almost as high as accuracies after progeny testing. In France, bulls used to be proven with an objective of a minimum reliability of 50% for functional traits and 70% for production traits even though the final values were