Optimization of trace elements in purified glycerol for microbial lipid and citric acid
production by Yarrowia lipolytica SKY7
--Manuscript
Draft--Manuscript Number: SMAB-D-20-00003R1
Full Title: Optimization of trace elements in purified glycerol for microbial lipid and citric acid production by Yarrowia lipolytica SKY7
Article Type: Original Article
Funding Information: Natural Sciences and Engineering Research Council of Canada (A4984)
Prof. Rajeshwar Tyagi
Abstract: Purified glycerol obtained after acid treatment of crude glycerol solution was used as the carbon source for lipid and citric acid production using Y. lipolytica SKY7. Although purified glycerol was high in phosphorus, it was important to investigate the impact of fortification of trace elements in the medium on cell growth, lipid and citric acid (CA) production. When all the trace elements (including phosphates and
sulphates) required for growth and lipid production were added to the purified glycerol medium, high biomass (51.67 g/L) and lipid concentration (19.47 g/L) were observed at 96 h of fed-batch fermentation with low CA concentration of 5.42 g/L. The purified glycerol medium without additional trace elements gave low biomass (27.67 g/L), lipid concentration (9.35 g/L) at 80 h of fed-batch fermentation, but gave high CA
concentration (24.51 g/L). When purified glycerol was provided with only sulphates or all elements except KH 2 PO 4 , low biomass (32.59 g/L & 38.52 g/L) and citric acid concentration (1 g/L & 2.42 g/L) were obtained at 96 h.
Corresponding Author: Rajeshwar Tyagi
INRS Eau Terre et Environnement CANADA
Corresponding Author Secondary Information:
Corresponding Author's Institution: INRS Eau Terre et Environnement Corresponding Author's Secondary
Institution:
First Author: Lalit R Kumar, M. Tech First Author Secondary Information:
Order of Authors: Lalit R Kumar, M. Tech Sravan K Yellapu, PhD Rajeshwar Tyagi Patrick Drogui, PhD Order of Authors Secondary Information:
Author Comments:
Response to Reviewers: The reviewer's comments have been responded with answer and the changes in the revised manuscript have been highlighted in yellow.
Reviewer #1:
Crude glycerol solution is cheap and easily acquired bioresource. Pretreated crude glycerol, namely purified glycerol, can be used as substrate in fermentation to produce chemicals. As this substrate has complex composition, it is important to investigate the impact of fortification of trace elements in the medium on cell growth and chemicals production. The authors therefore performed shaking flask and fermenter cultivations
Major comments:
1. Also, the authors present tons of results within the manuscript, the main line of the study is not clear. If the authors intend to optimize the media for fermentation,
systematically design is needed. On the other hand, although different combinations of purified glycerol and trace element had divergent effect on chemical production, the readers could be hard to find which in the substrate is the key positive factor or which one is negative specifically. I suggest the authors could focus more on purified glycerol itself and clearly illustrate the characteristic of its content as a fermentation medium. This will provide reference value for the readers.
Answer: The main objective of the study is highlighted in lines 41-48 in the introduction section of the revised manuscript.
The systematic design of experiments has been provided in Table 2. The important finding of the study is highlighted in the abstract of the revised manuscript. Pl see lines 11-17 of the revised manuscript. The detailed metabolism of YL for cell growth, lipid and citric acid synthesis is discussed in section 3.1.
The characteristics of crude and purified glycerol are presented in Table 1. Purified glycerol as a growth medium has been tabulated in Table 5 and discussion is provided in lines 218-221 of the revised manuscript.
Minor comments
1. P3 L46-47 Please rephrase this long sentence.
Answer: The sentence has been rephrased. Lines 64-66 of the revised manuscript. 2. P3 2.2 strain used only introduces the products of SKY7, other aspects should be included from cell physiology point of view, such as temperature, pH, substrate spectrum….
Answer: Other physiological details about the strain used are provided in lines 67-69 of the revised manuscript.
3. P4 L24-34 I don't know why there are some words underlined. It would be better to list the ingredient of different flasks in a table.
Answer: The underlined words have been removed. The ingredients used in different flask medium are provided in Table 2.
4. P6 L12-27 Are they repetition of flask media?
Answer: Yes, they are repetition of flask media in fermenter. This was necessary as in shake-flask studies, there is no-control of pH due to which, pH of the medium
decreases with time due to production of organic acids by microbes. However, pH-control is important for lipid and citric acid production. Controlled- pH conditions are obtained in fermenter. This argument is provided in lines 206-209 of the revised manuscript.
5. P7 L4 What is the solid content of the culture? Will it affect the biomass assay? Answer: There is no solid content in the culture medium. The solid content was only in the form of biomass generated during growth. Biomass concentration was estimated by standard method of weighing the washed and dried centrifuged biomass pellet of 15 mL sample volume.
6. P8 L43 KH2PO4 also contains phosphorus, which is an important substrate for cell growth. How would you evaluate it’s effect on the results?
Answer: The effect of phosphorus has been incorporated in the revised manuscript. Pl check lines 221-224 of the revised manuscript for effect of phosphorus.
7. Please correct all "KH2PO4" in the figures.
Answer: KH2PO4 has been written as “monopotassium phosphate” in all figure legends.
2) Give the full company name of 'BIOLIQ-INC'. Answer: BIO-LIQ is the full name of the company.
3) As the YPD contains '20 g/L glucose, 20 g/L peptone and 10 g/L yeast extract' (in page 4), what does 'fortified with 50 g/L YPD' mean in line 12, page 5?
Answer: The statement has been modified. Line number 91-92 of the revised manuscript.
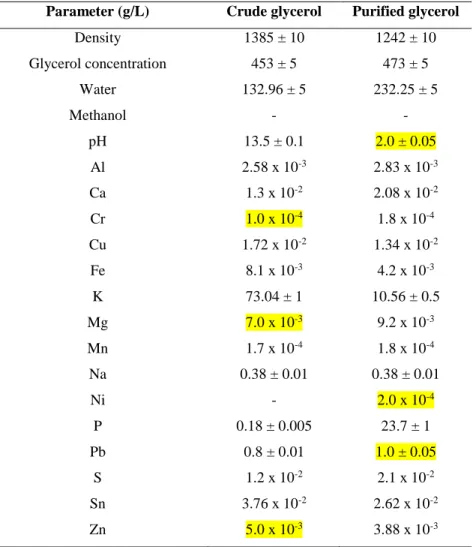
4) In table 1, not good to keep only 1 significant digit for concentration of Cr, Mg and Zn in crude glycerol, and for pH, concentration of Ni and Pb in purified glycerol.
Answer: The suggestion has been incorporated in table 1 and highlighted in the revised manuscript.
5) Provide details of the methods of LC-MS-MS for organic acids analysis and ICP-MS for elemental concentration determination in page 7.
Answer: The column and equipment details for LC-MS and ICP-MS have been provided in lines 137-141 of the revised manuscript.
6) All the tables need to be changed to three-line form. Answer: All the tables have been changed to 3-line format.
7) In figure 1, the biomass is still growing dramatically in exponential phase and the glycerol concentration is still decreasing linearly, it seems the fermentation can be continued for better results, why stopped the fermentation at 96 h?
Answer: The fermentations could have been conducted for a longer time. But the main objective of the study was to compare the effect of different trace elements in purified glycerol on biomass, lipid and citric acid, which is clearly visible in 96 h run.
8) In table 2, why the initial glycerol added in the sample of 'purified glycerol with all the trace elements' is 25 g/L instead of 20 g/L like other samples? It makes this medium different from the other three samples and may influence the results.
Answer: The high initial glycerol concentration in ‘purified glycerol with all trace elements’ is due to manipulation error during glycerol addition. Yes, the difference in initial glycerol concentration might influence the results. But considering very high glycerol consumption rates (Table 8) in Fermenter 4 (purified glycerol with all trace elements), it can be concluded that the ‘presence of all trace elements including KH2PO4’ is major reason for enhanced biomass concentration and glycerol consumption in Fermenter 4. Pl check lines 332-335 of the modified manuscript. 9) How to decide the fermentation ending time? Either the same fermentation time or the same feeding times are acceptable, but this experiment ended in different time with different feeding strategy.
Answer: The feeding time is dependent on residual glycerol concentration in the fermenter. Pl see Figure (3a) of the revised manuscript. When glycerol concentration went below 5 g/L, glycerol feed was imparted. Even though fermentation ending time are different, the results can be compared based on productivities. Biomass, lipid and citric acid productivities are discussed in section 3.2.5.
10) In discussion of '3.2.7 comparison of yield coefficients' page 16, it is reasonable that the decrease of lipid yield was caused 'by the shift of metabolism from cell membrane lipid production (cell growth phase) to cytosolic lipid production (lipid production phase)', but the time points can't be explained so well. For 'purified glycerol with sulphates and expect KH2PO4, a dip in lipid yield was after 32 h' in figure 6a, but the change of cell growth phase was earlier than 24 h in figure 2.
Answer: Although change of cell growth phase was earlier than 24 h in figure 2. But please see figure 4a and table 8 of the modified manuscript where in fermenter 3 (all except KH2PO4), change in lipid productivity was observed from 32 h. The sentence (L357-359) has been written considering this fact.
biomass (51.67 g/L) and lipid concentration (19.47 g/L) WAS observed' needs to be changed to WERE.
Answer: English corrections have been rectified in the revised manuscript.
The sentence has been changed in the revised manuscript. Pl check lines 13-14 of the revised manuscript.
13) In line 21, page 2, 'involve not only problem' needs to change order to put 'INVOLVE' behind 'NOT ONLY'.
Answer: The mistake has been rectified in the revised manuscript. Pl check lines 30-31 of the revised manuscript.
14) In line 39, page2, 'catalyst' needs to be in plural form 'catalysts'.
Answer: The mistake has been rectified in the revised manuscript. Pl check line 37 of the revised manuscript.
15) The second sentence in '2.1 crude glycerol purification', page 3, is incorrect. It only contains the subject 'BIOLIQ' and a subordinate clause. In line 31 the same page, 'protocols given in (Chen et al. 2017)' needs to be changed to 'protocols given by Chen et al. (2017)'.
Answer: The correction has been incorporated in the revised manuscript. Lines 53 and 59-60 of the revised manuscript.
16) In line 10, page 4, '(or PC1)' can omit the word 'OR'.
Answer: The suggestion has been incorporated in line 89 of the revised manuscript. 17) In line 5, page 7, 'reported by Chen et al. (2017);(Zhang et al. 2017)', change the sentence.
Answer: The suggested change has been made in lines 134-135 of the revised manuscript.
18) In line 16, page 8, 'Specific growth rate (μ, h-1)' needs to be 'Specific growth rate (μ/h)' to consist with other parts of the article.
Answer: The suggestion has been incorporated in line 160 of the revised manuscript. 19) In line 25, page 11, the sentence does not have a verb.
Answer: The sentence has ben corrected, pl check lines 233-234 of the revised manuscript.
20) In line 33, page 18, 'when compared to compared to pure glycerol' needs to delete the extra 'compared to'.
There are so many grammar errors in this article.
Answer: The error has been fixed, pl check line 399 of the revised manuscript. Grammar errors in the article has been rectified.
Reviewer #3: This is an experimental report on the effect of trace metals on the growth and product formation by a Yarrowia lipolytica strain. It is essentially a preliminary medium optimization study and unfortunately in its current form the paper lacks the scientific significance to justify publication in SMAB. The result is well-expected, although the exact numbers should to be dependent on the glycerol purification protocol and the composition of the crude glycerol. In terms of experimental methods, the trace element concentrations (Page 4) appear to be arbitrarily determined. If the authors are willing to, a detailed design of experiment is expected to gain deeper understanding in the roles of the metal ions involved.
Answer: The detailed design of experiment is provided in table 2. The trace element concentration might seem to be arbitrarily determined, but it is an effective way to conclude the effect of particular trace element on cell metabolism of YL for cell growth,
Optimization of trace elements in purified glycerol for microbial lipid and
1
citric acid production by Yarrowia lipolytica SKY7
2
Lalit R Kumara, Sravan K Yellapua, RD Tyagia*, Patrick Droguia
3
aINRS-ETE, 490, Rue de la Couronne, Québec, Canada, G1K 9A9 4
*Corresponding author: Tel: 1-(418) 654-2617; Fax: 1-(418) 654-2600. Email:[email protected]
5 6
ABSTRACT
7
Purified glycerol obtained after acid treatment of crude glycerol solution was used as the carbon
8
source for lipid and citric acid production using Y. lipolytica SKY7. Although purified glycerol
9
was high in phosphorus, it was important to investigate the impact of fortification of trace elements
10
in the medium on cell growth, lipid and citric acid (CA) production. When all the trace elements
11
(including phosphates and sulphates) required for growth and lipid production were added to the
12
purified glycerol medium, high biomass (51.67 g/L) and lipid concentration (19.47 g/L) were
13
observed at 96 h of fed-batch fermentation with low CA concentration of 5.42 g/L. The purified
14
glycerol medium without additional trace elements gave low biomass (27.67 g/L), lipid
15
concentration (9.35 g/L) at 80 h of fed-batch fermentation, but gave high CA concentration (24.51
16
g/L). When purified glycerol was provided with only sulphates or all elements except KH2PO4,
17
low biomass (32.59 g/L & 38.52 g/L) and citric acid concentration (1 g/L & 2.42 g/L) were
18
obtained at 96 h.
19 20
Keywords: Yarrowia lipolytica SKY7, Purified glycerol, Trace elements, Microbial lipid, Citric
21 acid 22 23 1 2 3 4 5 6 7 8 9 10 11 12 13 14 15 16 17 18 19 20 21 22 23 24 25 26 27 28 29 30 31 32 33 34 35 36 37 38 39 40 41 42 43 44 45 46 47 48 49 50 51 52 53 54 55 56 57 58 59
1. Introduction
24
Current biodiesel feedstock like vegetable oil, fossils, and wood cause environmental
25
concerns (e.g., global warming, greenhouse gas emissions) and lead to depletion of natural
26
resources including deforestation. Animal slaughtering for biodiesel production will lead to fuel
27
vs food competition. Microbial oil or microbial lipid can be quickly synthesized by bacteria, yeast
28
and fungi and its fatty-acid composition is highly similar to that of vegetable oil (Wang et al. 2015;
29
Marjakangas et al. 2015). Since commercial substrates like glucose not only involves problem of
30
food versus fuel competition, but also are expensive for microbial lipid production and increases
31
the final biodiesel production cost. Therefore, alternative substrates need to be explored. Crude
32
glycerol has attracted researchers’ attention in past few years because it is a by-product of the
33
biodiesel industry and application of crude glycerol as a substrate for lipid production will help to
34
boost biodiesel industry economy by maintaining the circular economy (Kumar et al. 2019).
35
However, crude glycerol contains several impurities, which emanate from the
trans-36
esterification process due to the use of different catalysts such as methanol, soap, free fatty acids,
37
metals and salts. These impurities may inhibit cell growth and lipid production depending on the
38
stain and concentration of the impurity (Kumar et al. 2019). Acidification is an effective method
39
to remove soap, metals and salts from the crude glycerol (Nanda et al. 2014; Chen et al. 2018;
40
Kumar et al. 2019). However, purified glycerol obtained after acid treatment may contain several
41
trace elements required for microbial growth, but they may not be present in sufficient
42
concentration needed for lipid and citric acid production or they may not be consumed by microbe.
43
If they are not present in sufficient quantity, what extra elements would be needed to be supplied
44
for high lipid and citric acid production? Therefore, the objective of this study was to investigate
45
whether purified glycerol had sufficient trace elements for high lipid and citric acid production by
46 3 4 5 6 7 8 9 10 11 12 13 14 15 16 17 18 19 20 21 22 23 24 25 26 27 28 29 30 31 32 33 34 35 36 37 38 39 40 41 42 43 44 45 46 47 48 49 50 51 52 53 54 55 56 57 58 59 60
Yarrowia lipolytica SKY7 (YL). Also, optimum trace element concentration was found out to
47
obtain high cell biomass and lipid concentration by YL.
48 49
2. Methodology
50
2.1 Crude glycerol purification
51
The crude glycerol was obtained from Canadian biodiesel producing company BIO-LIQ INC.
52
BIO-LIQ crude glycerol had high potassium concentration because potassium methoxide was used
53
as a catalyst during trans-esterification process step. The high potassium concentration in
BIO-54
LIQ crude glycerol was treated with phosphoric acid (by adjusting pH to 2) followed by
55
centrifugation at 6000 rpm for 10 minutes. During the purification process of crude glycerol using
56
phosphoric acid, precipitates of KH2PO4 are formed as indicated by the following equation:
57
RCOOK + H3PO4 RCOOH + KH2PO4 (precipitate) (1)
58
The characterization for crude and purified glycerol was performed using protocols given
59
in Chen et al. (2017). The composition of crude glycerol solution and that of purified glycerol is
60 mentioned in table 1. 61 62 2.2 Strain Used 63
Y. lipolytica SKY7 (YL) isolated in INRS laboratory was used in this study. YL is a wild
64
strain and can accumulate lipids up to 50% of cell dry weight (w/w). The lipids produced by the
65
strain closely resemble with vegetable oil and could serve as a feedstock for biodiesel production.
66
The optimum pH and temperature for growth of YL are 6.5 and 28oC. The strain is capable of
67 4 5 6 7 8 9 10 11 12 13 14 15 16 17 18 19 20 21 22 23 24 25 26 27 28 29 30 31 32 33 34 35 36 37 38 39 40 41 42 43 44 45 46 47 48 49 50 51 52 53 54 55 56 57 58 59
assimilating a wide variety of substrates like glycerol, Tween 80, D-glucose,
N-acetyl-D-68
glucosamine, inulin, L-proline, L-glutamic acid and succinic acid (Kuttiraja et al. 2015). The strain
69
also produces citric acid, which could be recovered and used by the food and/or chemical industry
70
since the organism is safe to use at the industrial level (Kuttiraja et al. 2015).
71 72
2.3 Shake-flask studies
73
The dormant pure culture of Y. lipolytica (4ºC) was revived by cultivating in pre-culture 1
74
(or PC1) synthetic media (Yeast extract peptone dextrose broth/ YPD: 20 g/L glucose, 20 g/L
75
peptone and 10 g/L yeast extract) for 24 h in a shaking incubator with agitation 180 rpm and
76
temperature of 28ºC. PC1 volume of 6.25% v/v was used for inoculation of experimental flasks.
77
Experiments were carried out in duplicate in 1 L Erlenmeyer flask with a working volume of 300
78
mL. The shake-flasks experiments were started with purified glycerol (20 g/L) while 4 g/L peptone
79
was added at 0 h to provide nitrogen source. Initial pH was 6.5 but the pH was not controlled in
80
shake-flasks. No additional trace elements were added in shake flask 1 at 0 h. The media
81
composition of shake flask 2, 3 and 4 is tabulated in table 2. The flasks were incubated at 180 rpm
82
and 28ºC for 96 h. The samples were withdrawn every 24 h for biomass and glycerol estimation
83
while lipid and citric acid were estimated for 96 h sample.
84 85
2.4 Fermentation under controlled conditions
86
2.4.1 Pre-culture and inoculum preparation
87 3 4 5 6 7 8 9 10 11 12 13 14 15 16 17 18 19 20 21 22 23 24 25 26 27 28 29 30 31 32 33 34 35 36 37 38 39 40 41 42 43 44 45 46 47 48 49 50 51 52 53 54 55 56 57 58 59 60
The dormant pure culture of Y. lipolytica SKY7 (4ºC) was revived by cultivating in
pre-88
culture 1 (PC1) synthetic media (given above) for 24 h in a shaking incubator with agitation 180
89
rpm and temperature of 28ºC. PC1 volume of 6.25% v/v was used to produce pre-culture 2 (PC2).
90
Pre-culture 2 medium was prepared by dissolving 50 g YPD in 1L tap water and purified glycerol
91
was added with concentration of 20 g/L. This was done to acclimatize Y. lipolytica in purified
92
glycerol medium. PC2 was grown at 28ºC in an incubating shaker at 180 rpm for 36 h before being
93
transferred to the production fermenter.
94 95
2.4.2 Fermentation Operation
96
Fermentations were carried out in stirred tank fermenters (SARTORIUS BIOSTAT, USA
97
and LABFORS 3, INFORS AG, Switzerland) equipped with accessories and programmable logic
98
control (PLC) system. The inoculum size of 6.25 % (v/v) was chosen as it is the optimum value
99
reported for Y. lipolytica SKY7 (Mathiazhakan et al. 2016). During the fermentation, DO was
100
maintained between 25-40% saturation by adjusting the agitation rate (250–600 rpm) and airflow
101
rate (1–2.5 L/min). The limitation of DO favors lipid production (Yen and Zhang 2011). During
102
6-12 h, DO decreases from 90% to 35% and later it was maintained in the range of 25%-40%. The
103
temperature was maintained at 28°C by circulating water through the fermenter jacket.
104
Fermentation pH was controlled automatically at 6.5 ± 0.1 by the addition of pH control agents:
105
4M NaOH or 4M H2SO4. Dissolved oxygen, temperature and pH were continuously monitored by
106
means of a polarographic dissolved oxygen probe (Mettler-Toledo, USA), temperature probe
107
(Mettler-Toledo, USA) and a pH sensor (Mettler-Toledo, USA), respectively.
108 109 4 5 6 7 8 9 10 11 12 13 14 15 16 17 18 19 20 21 22 23 24 25 26 27 28 29 30 31 32 33 34 35 36 37 38 39 40 41 42 43 44 45 46 47 48 49 50 51 52 53 54 55 56 57 58 59
2.4.3 Fed-batch strategy
110
Fermentations were conducted using purified glycerol as a carbon source. The fermenters
111
were operated under fed-batch mode to control substrate limitation. The production fermenters
112
were operated at temperature 28ºC and pH 6.5 for Y. lipolytica SKY7 as reported by Kuttiraja et
113
al. (2018). No additional trace elements were added in fermenter 1 at 0 h. The fermenter 2 had
114
only different sulphates at 0 h: 0.2 g/L MgSO4.7H2O, 0.0055 g/L FeSO4.7H2O, 0.001 g/L
115
ZnSO4.7H2O and 0.00076 g/L MnSO4.H2O. All trace elements except KH2PO4 were added at 0 h
116
in fermenter 3: 0.95 g/L Na2HPO4, 0.2 g/L MgSO4.7H2O, 0.0055 g/L FeSO4.7H2O, 0.001 g/L
117
ZnSO4.7H2O and 0.00076 g/L MnSO4.H2O. In fourth fermenter, all the additional trace elements
118
were added in the medium at 0 h with composition: 2.7 g/L KH2PO4, 0.95 g/L Na2HPO4, 0.2 g/L
119
MgSO4.7H2O, 0.0055 g/L FeSO4.7H2O, 0.001 g/L ZnSO4.7H2O and 0.00076 g/L MnSO4.H2O.
120
The production fermenters were started with 8-10 g carbon /L (or 20-25 g glycerol /L) and C/N
121
ratio (molar) of 10 at 0 h. When glycerol concentration in the medium reached below 5 g/L, a
122
glycerol feed was added so that the glycerol concentration in the medium reaches the initial
123
glycerol concentration (20-25 g/L). Peptone was added at 0 h only to provide nitrogen for cell
124
growth. However, no nitrogen (peptone) and trace elements were imparted during the feed at later
125
stages. The reason for it is that high initial nitrogen concentration or low initial C/N ratio will help
126
to build high lipid- free biomass during early stages of fermentation and once nitrogen
127
concentration will become limiting, the addition of glycerol feed will increase the C/N ratio in the
128
medium, which will result in high lipid accumulation (Chen et al. 2017). Feeding details are
129
presented in Table 3. Samples were withdrawn every 8 h during the fermentation to determine the
130
biomass, lipid, glycerol and organic acid concentration in the fermentation medium.
131 132 3 4 5 6 7 8 9 10 11 12 13 14 15 16 17 18 19 20 21 22 23 24 25 26 27 28 29 30 31 32 33 34 35 36 37 38 39 40 41 42 43 44 45 46 47 48 49 50 51 52 53 54 55 56 57 58 59 60
2.5 Analytical Techniques
133
Biomass concentration and lipid concentration were determined as reported in Chen et al.
134
(2017). Glycerol was measured according to the method by Bondioli and Della Bella (2005). Citric
135
acid estimation was carried out according to the method by Marier and Boulet (1958). Other
136
organic acids (keto-glutamic acid, pyruvic acid, malic acid) in the supernatant were analyzed using
137
LC-MS (Liquid chromatography-mass spectrometry with 2x150 mm column VG-50 2D, Shodex,
138
Japan). Elemental concentration in the samples was determined by inductively coupled plasma
139
mass spectroscopy (ICP-MS) after acid digesting the samples (model DRE, Leeman Labs Inc,
140
USA) (Kaur et al. 2019).
141
For lipid characterization, a lipid sample of 25 mg was trans-esterified using acidified methanol.
142
Decahexanoic acid was used as the internal standard. The trans-esterified lipid fraction was
143
extracted using hexane and the samples were further characterized by GC (Agilent 7890B, USA)
144
equipped with flame ionization detector. Column length was 60 m (Agilent J&W, USA); the
145
carrier gas was helium at a flow rate of 1.18 mL/min with the oven temperature at 230 °C.
Trans-146
esterified sample (1μL) was injected with an automated sample injector and the sample analysis
147
was performed with Agilent GC chem station software. A 37 components FAME mixture from
148
Supelco was used as the calibration standard at different concentrations.
149
All samples were analyzed in duplicates and their standard deviation was less than 5%.
150 151
2.6 Determination of kinetic parameters
152
Productivity is defined as g product produced per unit volume at a particular time t. Unit of
153
productivity is g/L/h. Biomass, lipid and citric acid productivity will be calculated by equation 2.
154 4 5 6 7 8 9 10 11 12 13 14 15 16 17 18 19 20 21 22 23 24 25 26 27 28 29 30 31 32 33 34 35 36 37 38 39 40 41 42 43 44 45 46 47 48 49 50 51 52 53 54 55 56 57 58 59
𝑃𝑟𝑜𝑑𝑢𝑐𝑡𝑖𝑣𝑖𝑡𝑦 (𝐿.ℎ𝑔) = 𝑝𝑟𝑜𝑑𝑢𝑐𝑡 𝑝𝑟𝑜𝑑𝑢𝑐𝑒𝑑 (𝑔) (𝑉𝑜𝑙𝑢𝑚𝑒 𝑥 𝑡𝑖𝑚𝑒) (2)
155
Product yield coefficient (YP/S) is defined as the amount of product produced per g of substrate
156
consumed. It will be determined for lipid and citric acid by the equation (3a) and (3b):
157
Yl/S = dL/dS (3a)
158
Yc/s = dCA/dS (3b)
159
Specific growth rate (µ, /h) was determined by the equation (4):
160
µ =dX/(X.dt) (4)
161
Where X represents biomass concentration at particular time t
162
Biomass productivity and specific growth rate have been calculated with respect to cell biomass
163
including intracellular lipid.
164
165
3. Results and discussion
166
3.1 Shake-flask studies
167
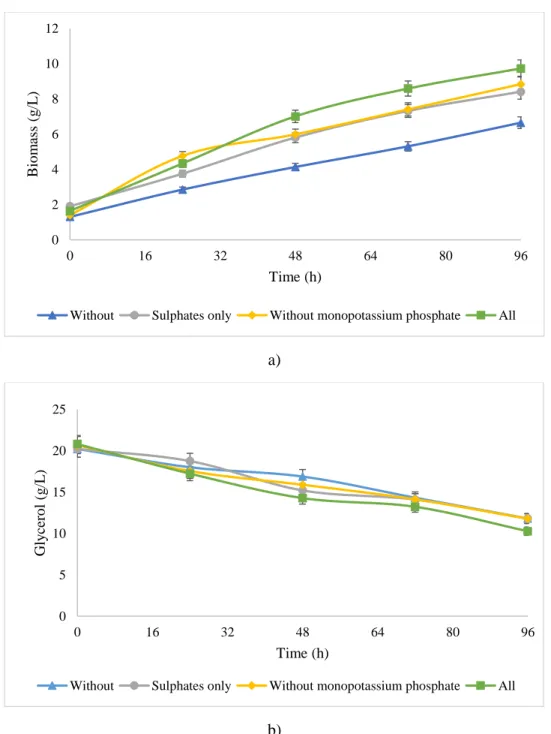
Biomass profile for different trace element media is presented in Figure 1a. At 96 h, the highest
168
biomass concentration (9.73 g/L) was obtained in shake flask 4 where all the trace elements were
169
present in the medium including KH2PO4. It indicates that presence of additional potassium in the
170
purified glycerol medium assisted in cell growth of Y. lipolytica SKY7. It has been reported that
171
potassium in the media is essential for cellular activities such as maintaining cell volume, enzyme
172
activity, compensation of negative charges of macromolecules to electroneutrality, protein
173
synthesis, maintenance of intracellular pH and membrane potential (Yenush 2016). At 96 h,
174 3 4 5 6 7 8 9 10 11 12 13 14 15 16 17 18 19 20 21 22 23 24 25 26 27 28 29 30 31 32 33 34 35 36 37 38 39 40 41 42 43 44 45 46 47 48 49 50 51 52 53 54 55 56 57 58 59 60
biomass concentration in shake flask 3 (containing sulphates and Na2HPO4) was higher than
175
biomass concentration in shake flask 2 (containing only sulphates). It reveals that the added sodium
176
salt assisted in cell growth of Y. lipolytica SKY7. This is in agreement with the observations of
177
Gao et. al. (2016) who reported that increased concentration of sodium salt in the medium provided
178
R. toruloides with osmoregulation and a good physiological state for growth and reproduction. At
179
96 h, the biomass concentration in shake flask 2 (containing sulphates) was higher than shake flask
180
1 (no trace elements). The above fact revealed that the added sulphate salts assisted in cell growth
181
of Y. lipolytica SKY7. It has been reported that the presence of sulphates in the growth medium
182
provided sulphur element for growth of R. toruloides, which is essential for the provision of
acyl-183
SCoA and S-containing amino acids (Yang et al. 2014).
184 185
Citric acid and lipid concentration in different flasks at 96h of fermentation are presented in
186
table 4. It shows that without the addition of any trace elements in shake flask 1 leads to citric acid
187
production (4.05 g/L). However, the addition of sulphates in the medium (shake flask 2, 3 and 4)
188
leads to no citric acid production. The citric acid production (citrate concentration in the
189
cytoplasm) is one of the important factors that control the de-novo lipid accumulation (EVANS et
190
al. 1983). Citrate is known as the acetyl donor for fatty acid biosynthesis and is transported from
191
mitochondria to the cytoplasm. A constant supply of intracellular citrate will generate adequate
192
amounts of acetyl-CoA in the cytoplasm by the enzyme ACL (ATP citrate lyase). Acetyl CoA is
193
converted to malonyl-CoA (a step-in lipid synthesis) using ACC enzyme (acetyl-CoA carboxylase)
194
(Kuttiraja et al. 2018). If ACL enzyme gets inhibited, accumulated citrate in cytoplasm comes out
195
of the cell instead of being converted into lipids. The metal ions like Mg2+, Fe2+, Mn2+ and Zn2+
196
which were supplied in the form of sulphate salts in shake flasks 2, 3 and 4 play an important role
197 4 5 6 7 8 9 10 11 12 13 14 15 16 17 18 19 20 21 22 23 24 25 26 27 28 29 30 31 32 33 34 35 36 37 38 39 40 41 42 43 44 45 46 47 48 49 50 51 52 53 54 55 56 57 58 59
in the functioning of ACL enzyme and lipid production. It has been reported that addition of 1.5
198
g/L Mg2+, 0.0001 g/L Mn2+, 0.1 g/L Fe3+, 0.0001 g/L Cu2+, 0.0001 g/L Co2+, 0.1 g/L Ca2+, and
199
0.0001 g/L Zn2+ in the growth medium after 48 h increased the lipid accumulation in fungi
200
Cunninghamella bainieri (Shuib et al. 2014). Metals like Mg2+ and Fe2+act as cofactor for ACL
201
enzyme and are essential for lipid production (Ma et al. 2009). Moreover, iron is vital for cell
202
metabolism as it impacts the transfer of electrons, DNA synthesis and nitrogen fixation (Concas
203
et al. 2014). A beneficial effect of Mn2+ in the concentration range of 2–500 mg/L on lipid
204
production has been observed in Mortierella sp.(Šajbidor et al. 1992). The lipid concentration in
205
shake flask 4 was higher due to highest biomass concentration. The reason for low lipid
206
concentration and biomass lipid content in shake flask studies might also be due to uncontrolled
207
pH in shake flask experiments. It has been reported that lipid and citric acid production improves
208
under pH control (pH – 6.5) condition for Y. lipolytica SKY7 (Kuttiraja et al. (2018).
209 210
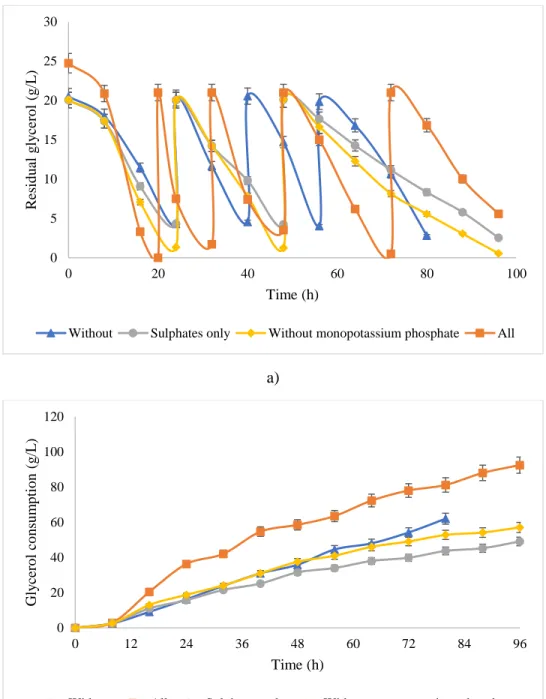
The residual glycerol profile for different trace elements has been highlighted in Figure 1b. At
211
96 h, glycerol consumption was highest (10.54 g/L) where all the trace elements were added when
212
compared to without the addition of trace elements (8.42 g/L), addition of only sulphates (8.42
213
g/L), the addition of all elements except KH2PO4 (8.89 g/L) (Table 4). It can be concluded that
214
chemical elements present in the purified glycerol are not sufficient to promote cell growth and
215
lipid production in Y. lipolytica SKY7. The chemical elements contributed by the added purified
216
glycerol in the medium (Shake flask 1) and concentration of complete trace elements added in the
217
medium (shake flask 4) are compared with the actual requirement (Table 5). It can be observed
218
from table 5 that sufficient Fe, K, Mg, Mn and Zn were not present where purified glycerol was
219
added in the medium and no extra trace elements were added. Hence, they had to be imparted
220 3 4 5 6 7 8 9 10 11 12 13 14 15 16 17 18 19 20 21 22 23 24 25 26 27 28 29 30 31 32 33 34 35 36 37 38 39 40 41 42 43 44 45 46 47 48 49 50 51 52 53 54 55 56 57 58 59 60
through the addition of trace elements - sulphates and phosphates. It can also be concluded from
221
tables 4 and 5 that although the purified glycerol medium had sufficient phosphorus in it, additional
222
phosphorus imparted through Na2HPO4 and KH2PO4 had no detrimental effect on the biomass
223 concentration. 224 225 3.2 Fermenter studies 226 3.2.1 Biomass concentration 227
Impact of the trace elements in purified glycerol medium on biomass concentration is
228
highlighted in Figure 2. The biomass results in fermenter studies follow a similar trend as that of
229
shake flask studies. At 96 h, the highest biomass concentration (51.67 g/L) was obtained in
230
fermenter where all trace elements were added in the medium, including KH2PO4, followed by
231
purified glycerol except KH2PO4 (38.32 g/L), purified glycerol with only sulphates (32.59 g/L).
232
Throughout fermentation, lowest biomass concentration was observed in purified glycerol medium
233
without any trace elements. Thus, additional potassium, sulfur and sodium at 0 h in the medium
234
assisted in cell growth of Y. lipolytica SKY7.
235 236
3.2.2 Glycerol consumption
237
The maximum glycerol consumption was observed when all the trace elements were imparted
238
at 0 h in the purified glycerol medium (92.43g glycerol/L at 96 h) (Figure 3b). The presence of all
239
trace elements in purified glycerol provided a complete growth medium for Y. lipolytica due to
240
which higher glycerol consumption was observed. The maximum number of glycerol feeds (four)
241
were also required and provided when all the trace elements were present (Fig 3a). However,
242 4 5 6 7 8 9 10 11 12 13 14 15 16 17 18 19 20 21 22 23 24 25 26 27 28 29 30 31 32 33 34 35 36 37 38 39 40 41 42 43 44 45 46 47 48 49 50 51 52 53 54 55 56 57 58 59
higher glycerol consumption was observed when no trace elements were provided compared to
243
only sulphates and all trace elements except KH2PO4. This is due to higher citric acid production
244
when no trace elements were provided in the purified glycerol medium (discussed later).
245 246
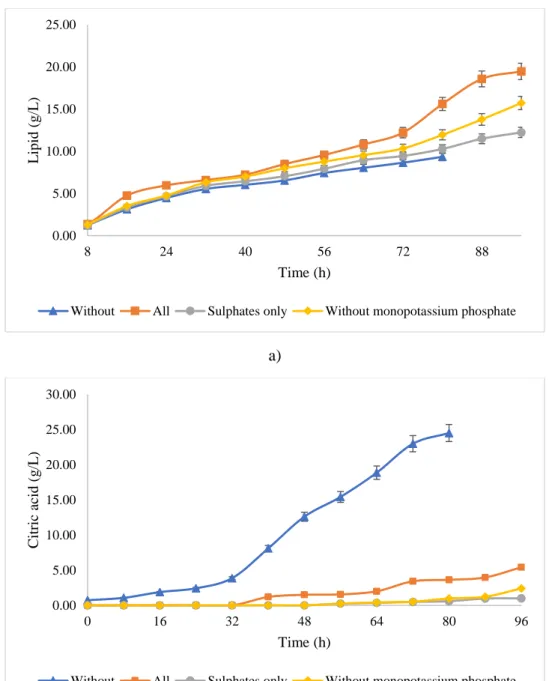
3.2.3 Lipid production
247
At 96 h, highest lipid production (19.47 g/L) occurred in purified glycerol medium where
248
all the trace elements were present (Figure 4a). This was followed by purified glycerol medium
249
where all trace elements were present except KH2PO4 (15.72 g/L at 96 h), purified glycerol
250
medium with only sulphates (12.24 g/L at 96 h) and purified glycerol medium without trace
251
elements (9.35 g/L at 80 h). The lipid results obtained in fermenter studies follow a similar trend
252
as that of shake-flask studies. For lipid production, a greater concentration of biomass is needed
253
so that empty cells can be filled with microbial lipids. Microbial lipid production takes place due
254
to increase of the C/N ratio in the fermentation medium. Lowest biomass concentration in the
255
absence of trace elements is the reason for lowest lipid production. The reason for the high lipid
256
accumulation in presence of all trace elements is because of the high biomass concentration in the
257
medium. When nitrogen concentration started decreasing the C/N ratio started increasing due to
258
glycerol feeding (Table 3), lipid concentration started increasing in all glycerol media. Lipid
259
characterization observed in different cases has been provided in table 6.
260
Lipid characterization revealed that palmitic acid (C16:0), Oleic acid (C18:1) and linoleic
261
acid (C18:2) were produced in all glycerol media. Oleic acid (C18:1) and linoleic acid (C18:2) are
262
the major components in the case of SKY7 as reported in other studies (Kuttiraja et al. 2015;
263
Kuttiraja et al. 2018). These lipids have a resemblance with the vegetable oil. The presence of
264 3 4 5 6 7 8 9 10 11 12 13 14 15 16 17 18 19 20 21 22 23 24 25 26 27 28 29 30 31 32 33 34 35 36 37 38 39 40 41 42 43 44 45 46 47 48 49 50 51 52 53 54 55 56 57 58 59 60
polyunsaturated fatty acids (PUFAs) makes the isolate Y. lipolytica SKY7 important for biodiesel
265
production. Other fatty acids like mysteric acid (C14:0), stearic acid (C18:1), arachidic (C20:0),
266
and arachidonic acid (C20:4) were produced in minor quantities.
267 268
3.2.4 Organic acids production
269
Citric acid is the major acid produced by Y. lipolytica, which is a well-known industrial
270
scale citric acid producer. Highest citric acid concentration (24.51 g/L) was observed at 80 h in the
271
fermenter without additional trace elements (Fig 4b). In other fermenters, low citric acid
272
production was obtained, 1 g/L-5.42 g/L at 96 h. The absence of additional trace elements assisted
273
in citric acid production, as discussed in shake-flask studies. In another three fermenters, these
274
metal ions were supplied in the form of sulphates at 0 h, due to which low citric acid and increased
275
lipid production were detected.
276 277
Other organic acids produced during fermentation were pyruvic acid, alpha-ketoglutaric
278
acid, malic acid, glutamic acid and fumaric acid. Other organic acids produced during fermentation
279
at 96 h are highlighted in table 7. Pyruvic acid, malic acid, fumaric acid and alpha-keto-glutaric
280
acid are intermediates of citric acid cycle and all have commercial applications (Vuoristo et al.
281
2016). Malic acid was majorly produced acid in the medium with only sulphates and trace elements
282
except KH2PO4. It is used as a food additive. Alpha-keto glutaric acid was produced in all glycerol
283
media and is used for immune regulation and as anti-oxidant. Pyruvic acid, fumaric acid and
284
glutamic acid were produced in lower quantities. However, the concentration of these acids in the
285
medium is very low and recovery may be expensive.
286 4 5 6 7 8 9 10 11 12 13 14 15 16 17 18 19 20 21 22 23 24 25 26 27 28 29 30 31 32 33 34 35 36 37 38 39 40 41 42 43 44 45 46 47 48 49 50 51 52 53 54 55 56 57 58 59
287
3.2.5 Variation of biomass, lipid and CA productivities
288
In order to calculate biomass productivity, the biomass curve can be divided into different
289
sections (Table 8) and each section is represented by a straight line. The slope of each line
290
represents biomass productivity (dX/dt) during that fermentation period. Lipid productivity
291
(dL/dt), citric acid productivity (dC/dt) and glycerol consumption rates (dS/dt) have been
292
calculated by similar method.
293 294
Biomass productivity was higher during the initial 24 h for all four-glycerol medium and
295
was lower in the later period of fermentation (24-96 h) (Table 8). Higher biomass productivity
296
during initial 24 h is due to abundance of nitrogen in the medium, which resulted in cell growth.
297
Also, during the initial 24 h, carbon of peptone (contains 10% carbon) was used for cell growth.
298
During later phase, biomass productivity was lower due to reduction in nutrients and nitrogen
299
concentration. Biomass productivity in the purified glycerol medium with all trace elements was
300
observed highest among all conditions. At 96 h, the overall biomass productivities for purified
301
glycerol without trace elements, purified glycerol with only sulphates, purified glycerol except for
302
KH2PO4 and purified glycerol with all trace elements were 0.35 g/L/h, 0.34 g/L/h, 0.40 g/L/h and
303
0.54 g/L/h, respectively.
304 305
Irrespective of trace elements, lipid productivity was higher during initial 16-32 h period
306
because during this period, membrane lipids develop with biomass growth (Mathiazhakan et al.
307
2016). While during later stages of fermentation, lipid was accumulated as intracellular lipids in
308
cytosol. For purified glycerol medium with no trace elements and only sulphates, two sections are
309 3 4 5 6 7 8 9 10 11 12 13 14 15 16 17 18 19 20 21 22 23 24 25 26 27 28 29 30 31 32 33 34 35 36 37 38 39 40 41 42 43 44 45 46 47 48 49 50 51 52 53 54 55 56 57 58 59 60
identified where membrane lipids are developed (1st section, 0-32 h) and lipids accumulate in
310
cytosol (2nd section, after 32 h) (Table 8). For purified glycerol with all trace elements and except
311
KH2PO4, three sections were identified: 1st section (accumulation of membrane lipids), 2nd and 3rd
312
section (accumulation of cytosol lipids). However, 3rd section had higher lipid productivity than
313
2nd section due to higher C/N ratio. Throughout the fermentation, lipid productivity was the highest
314
in purified glycerol with all trace elements followed by purified glycerol except KH2PO4, purified
315
glycerol with only sulphates and purified glycerol with no trace elements. At 96 h, the overall lipid
316
productivities for purified glycerol with all trace elements, purified glycerol except KH2PO4,
317
purified glycerol with only sulphates and purified glycerol with no trace elements were 0.2 g/L/h,
318
0.164 g/L/h, 0.128 g/L/h and 0.117 g/L/h, respectively.
319 320
For all trace element’s media, citric acid productivities were lower during the initial stages
321
of fermentation (24-48 h) and were higher during late stages of fermentation (Table 8). Citric acid
322
productivities were higher during later stages of fermentation due to a reduction in nitrogen
323
concentration and an increase in the C/N ratio in the medium. Citric acid productivity was highest
324
in purified glycerol with no trace elements due to inhibition of ATP-citrate lyase enzyme
325
responsible for the breakdown of intracellular citrate. All other trace element media resulted in
326
very low citric acid productivities. At 96 h, the overall citric acid productivities for purified
327
glycerol with all trace elements, purified glycerol except KH2PO4, purified glycerol with only
328
sulphates and purified glycerol with no trace elements were 0.056 g/L/h, 0.025 g/L/h, 0.01 g/L/h
329 and 0.31 g/L/h, respectively. 330 331 4 5 6 7 8 9 10 11 12 13 14 15 16 17 18 19 20 21 22 23 24 25 26 27 28 29 30 31 32 33 34 35 36 37 38 39 40 41 42 43 44 45 46 47 48 49 50 51 52 53 54 55 56 57 58 59
The glycerol consumption rate in Fermenter 4 (all trace elements) was twice as that of other
332
fermenters. The difference in initial glycerol concentration might influence the results. However,
333
the presence of all trace elements, including KH2PO4 is a major reason for enhanced biomass and
334
glycerol consumption in Fermenter 4.
335 336
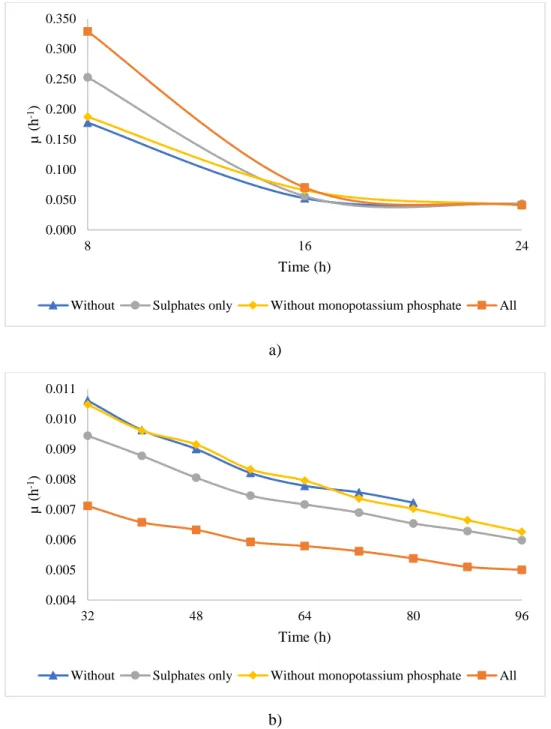
3.2.6 Comparison of specific growth rates
337
For all types of glycerol medium, the specific growth rate monotonically decreased until
338
the end of the fermentation process (Figure 5). Maximum specific growth rate (µmax) for purified
339
glycerol with all trace elements, purified glycerol except KH2PO4, purified glycerol with only
340
sulphates and purified glycerol with no trace elements was 0.329, 0.188, 0.253 and 0.178 h-1,
341
respectively at 8 h (Figure 5a). Thus, trace elements are necessary for cell growth of Y. lipolytica
342
because lowest µmax was obtained in purified glycerol with no trace elements. The effect of specific
343
growth rate during initial 24 h is more prominent on final biomass concentration.
344 345
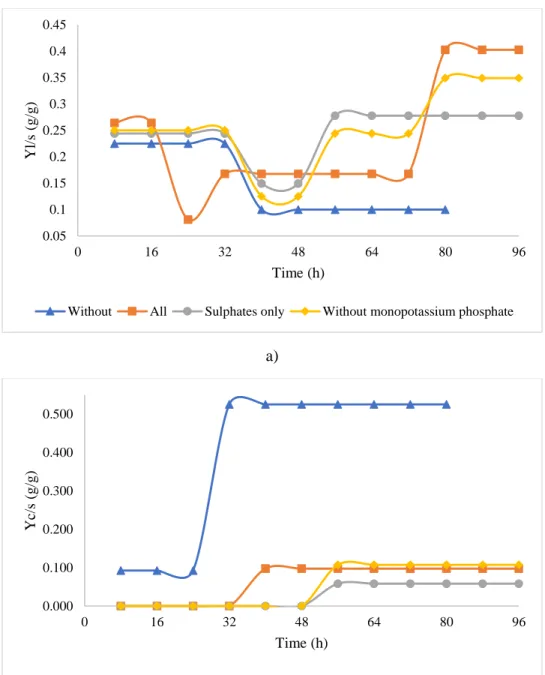
3.2.7 Comparison of yield coefficients
346
Point yield coefficients have been calculated by diving point productivity by the glycerol
347
consumption rate (calculated from Table 8) at a particular point of time. Overall yield is calculated
348
for a total fermentation time, total product produced divided by total glycerol consumed. Point
349
lipid yield and point citric yields are depicted in Figure 6. Lipid yield (Yl/s, g of lipid produced
350
per g of glycerol consumed) was observed lowest for purified glycerol without any trace elements
351
because of highest citric aid yield (Figure 6b). In a purified glycerol medium with all trace
352
elements, lipid yield was comparatively higher during initial 16 h due to the formation of cell
353
membrane lipids and after 72 h, as C/N ratio increased with glycerol feeding at 72 h (Table 3)
354 3 4 5 6 7 8 9 10 11 12 13 14 15 16 17 18 19 20 21 22 23 24 25 26 27 28 29 30 31 32 33 34 35 36 37 38 39 40 41 42 43 44 45 46 47 48 49 50 51 52 53 54 55 56 57 58 59 60
which resulted in lipid accumulation. A dip in lipid yield was observed at 24 h for purified glycerol
355
with all trace elements because of the shift of metabolism from cell membrane lipid production
356
(cell growth phase) to cytosolic lipid production (lipid production phase) (Figure 6a). For purified
357
glycerol with sulphates and expect KH2PO4, a dip in lipid yield was after 32 h where there was a
358
shift in metabolism from growth phase to lipid production phase (Figure 6a). The point of dip in
359
yield is delayed for purified glycerol with sulphates and except KH2PO4 due to prolonged cell
360
growth phase because of lack of sufficient trace elements in the medium. At 96 h, the overall lipid
361
yield obtained in purified glycerol medium without any trace elements, purified glycerol medium
362
with sulphates, purified glycerol except KH2PO4 and purified glycerol medium with all trace
363
elements were 0.15 g/g glycerol, 0.25 g/g glycerol, 0.28 g/g glycerol and 0.21 g/g glycerol
364
respectively. Table 9 indicates lipid productivity and lipid yield obtained in this study and that
365
reported in the literature. The lipid yield and productivity observed in purified glycerol was
366
comparable to crude glycerol for Y. lipolytica SKY7 (Mathiazhakan et al. 2016). Lipid productivity
367
recorded in this study was comparable to that of T. oleaginous grown on crude glycerol (with high
368
soap content) (Chen et al. 2017) and was higher than genetically engineered Y. lipolytica grown
369
on glucose (Tai and Stephanopoulos 2013), C. curvatus and L. starkeyi grown on crude glycerol
370
(Liang et al. 2010) (Signori et al. 2016). Microorganisms like T. oleaginosus, C. curvatus and L.
371
starkeyi are strictly lipid producers and do not produce extracellular organic acids while Y.
372
lipolytica also produces organic acids besides intracellular lipids.
373 374
In this study, irrespective of glycerol medium, citric acid yield was lower during the initial
375
stages of fermentation and was higher during later stages of fermentation (Figure 6b). Citric acid
376
yield was higher during later stages of fermentation due to a decrease in nitrogen concentration
377 4 5 6 7 8 9 10 11 12 13 14 15 16 17 18 19 20 21 22 23 24 25 26 27 28 29 30 31 32 33 34 35 36 37 38 39 40 41 42 43 44 45 46 47 48 49 50 51 52 53 54 55 56 57 58 59
and an increase in the C/N ratio in the medium. Throughout fermentation, citric acid yield was
378
observed highest in purified glycerol medium without trace elements due to inhibition of
ATP-379
citrate lyase enzyme responsible for the breakdown of intracellular citrate, as stated above. At 96
380
h, overall citric acid yield was the highest for purified glycerol (0.4 g/g) without any trace elements
381
followed by purified glycerol with all trace elements (0.059 g/g), purified glycerol except KH2PO4
382
(0.042 g/g) and purified glycerol with sulphates (0.02 g/g). Table 10 indicates citric acid yield and
383
productivity of studies reported in literature. Citric acid productivity for Y. lipolytica SKY7 in
384
purified glycerol (this study) was higher than reported on crude glycerol (Kuttiraja et al. 2018).
385 386
The citric acid productivity and yield in this study is lower when compared to genetically
387
engineered strain grown on glucose (Table 10). High citric acid production in genetically modified
388
strain was due to cloning and over-expression of pyruvate carboxylase gene, PYC1 gene (obtained
389
from marine fungus) in citric acid producing wild strain of Y. lipolytica SWJ- 1b (Fu et al. 2016).
390
In Y. lipolytica SWJ- 1b, pyruvate carboxylase catalyzes the carboxylation of one mole of pyruvic
391
acid to oxaloacetic acid by fixing 1 mol of CO2. The oxaloacetic acid formed is reduced to malate, 392
and the malate enters into mitochondria where the malate is oxidized to oxaloacetic acid. At the
393
same time, another mole of pyruvic acid is converted into acetyl-CoA under the catalysis of
394
mitochondrion pyruvate dehydrogenase (mPDH) by releasing 1 mol of CO2 in the mitochondria. 395
Then, oxaloacetic acid and acetyl-CoA are condensed to form CA in mitochondria. Therefore, due
396
to overexpression of pyruvate carboxylase, more oxaloacetic acid exists in the mitochondria and
397
hence higher CA is formed. It can also be noted (Table 10) that citric acid yield and productivity
398
were higher on glucose when compared to pure glycerol (Sabra et al. 2017). With glycerol as the
399
sole carbon source, only 6.7% of its uptake rate is directed to phosphate pentose pathway (PPP)
400 3 4 5 6 7 8 9 10 11 12 13 14 15 16 17 18 19 20 21 22 23 24 25 26 27 28 29 30 31 32 33 34 35 36 37 38 39 40 41 42 43 44 45 46 47 48 49 50 51 52 53 54 55 56 57 58 59 60
compared to 35% with glucose. On the other hand, higher fluxes toward the tri-carboxylic acid
401
(TCA) cycle are observed with glycerol rather than glucose as substrate. The relatively lower TCA
402
cycle and higher PPP fluxes could explain the higher citrate produced with glucose as the sole
403
carbon source. Moreover, the higher PPP fluxes would also reduce the fluxes toward the NADP
404
dependent isocitrate dehydrogenase, reported to be present in Y. lipolytica, the major citrate
405
degrading enzyme. Although citric acid yield with respect to glucose is higher than from glycerol,
406
glucose is an expensive substrate (1 $/kg) for fermentation and in this study, during crude glycerol
407
purification, KH2PO4 is produced as by-product, which has application in the food industry, as 408
buffering agent and fungicide (Javani et al. 2012).
409 410
4. Conclusion
411
In this study, the purified glycerol was investigated as carbon and trace element source for
412
lipid and citric acid production using Y. lipolytica SKY7. It was revealed that in purified glycerol,
413
sufficient Fe, K, Mg, Mn and Zn were not present for cell growth and lipid production. Hence, low
414
biomass and lipid concentration were obtained in the absence of trace elements. Hence, these metal
415
ions had to be imparted through external trace elements (in the form of sulphates and phosphates)
416
to promote cell growth and lipid production. However, high CA concentration was obtained when
417
no additional trace elements were added in purified glycerol.
418 419
Acknowledgements: The authors would like to acknowledge the Natural Sciences and Engineering
420
Research Council of Canada (grant A4984, Canada Research Chair) for financial support. We are grateful 421
to the technical staff of INRS-ETE (Mr. Stephane Moise and Mr. Stefane Premont) for their timely help to 422
analyze the samples on LC-MS and ICP. 423 4 5 6 7 8 9 10 11 12 13 14 15 16 17 18 19 20 21 22 23 24 25 26 27 28 29 30 31 32 33 34 35 36 37 38 39 40 41 42 43 44 45 46 47 48 49 50 51 52 53 54 55 56 57 58 59
424
Conflict of Interest:
425
On behalf of all authors, the corresponding author states that there is no conflict of interest.
426 3 4 5 6 7 8 9 10 11 12 13 14 15 16 17 18 19 20 21 22 23 24 25 26 27 28 29 30 31 32 33 34 35 36 37 38 39 40 41 42 43 44 45 46 47 48 49 50 51 52 53 54 55 56 57 58 59 60
References
427
Bondioli P, Della Bella L (2005) An alternative spectrophotometric method for the determination of free 428
glycerol in biodiesel. European journal of lipid science and technology 107 (3):153-157 429
Chen J, Yan S, Zhang X, Tyagi RD, Surampalli RY, Valéro J (2018) Chemical and biological conversion 430
of crude glycerol derived from waste cooking oil to biodiesel. Waste Management 71:164-175 431
Chen J, Zhang X, Yan S, Tyagi RD, Drogui P (2017) Lipid production from fed-batch fermentation of 432
crude glycerol directed by the kinetic study of batch fermentations. Fuel 209:1-9 433
Concas A, Steriti A, Pisu M, Cao G (2014) Comprehensive modeling and investigation of the effect of iron 434
on the growth rate and lipid accumulation of Chlorella vulgaris cultured in batch photobioreactors. 435
Bioresource technology 153:340-350 436
EVANS CT, SCRAGG AH, RATLEDGE C (1983) A comparative study of citrate efflux from 437
mitochondria of oleaginous and non‐ oleaginous yeasts. The FEBS Journal 130 (1):195-204 438
Fu G-Y, Lu Y, Chi Z, Liu G-L, Zhao S-F, Jiang H, Chi Z-M (2016) Cloning and characterization of a 439
pyruvate carboxylase gene from Penicillium rubens and overexpression of the genein the yeast 440
Yarrowia lipolytica for enhanced citric acid production. Marine biotechnology 18 (1):1-14
441
Javani A, Hasheminejad M, Tahvildari K, Tabatabaei M (2012) High quality potassium phosphate 442
production through step-by-step glycerol purification: a strategy to economize biodiesel 443
production. Bioresource technology 104:788-790 444
Kaur R, Roy D, Yellapu SK, Tyagi RD, Drogui P, Surampalli RY (2019) Enhanced Composting Leachate 445
Treatment Using Extracellular Polymeric Substances as Bioflocculant. Journal of Environmental 446
Engineering 145 (11):04019075 447
Kumar LR, Yellapu SK, Tyagi R, Zhang X (2019) A review on variation in crude glycerol composition, 448
bio-valorization of crude and purified glycerol as carbon source for lipid production. Bioresource 449
Technology 293:122155 450
Kuttiraja M, Dhouha A, Tyagi RD (2018) Harnessing the Effect of pH on Lipid Production in Batch 451
Cultures of Yarrowia lipolytica SKY7. Applied Biochemistry and Biotechnology 184 (4):1332-452
1346. doi:10.1007/s12010-017-2617-y 453
Kuttiraja M, Krishna S, Dhouha A, Tyagi RD (2015) A substrate-based approach for the selection of oil-454
bearing heterotrophs from nitrogen-deficient soil for lipid production. Applied biochemistry and 455
biotechnology 175 (4):1926-1937 456
Liang Y, Cui Y, Trushenski J, Blackburn JW (2010) Converting crude glycerol derived from yellow grease 457
to lipids through yeast fermentation. Bioresource technology 101 (19):7581-7586 458
Ma Z, Chu C-H, Cheng D (2009) A novel direct homogeneous assay for ATP citrate lyase. Journal of lipid 459
research 50 (10):2131-2135 460
Marier J, Boulet M (1958) Direct determination of citric acid in milk with an improved pyridine-acetic 461
anhydride method. Journal of Dairy Science 41 (12):1683-1692 462
Marjakangas JM, Lakaniemi A-M, Koskinen PE, Chang J-S, Puhakka JA (2015) Lipid production by 463
eukaryotic microorganisms isolated from palm oil mill effluent. Biochemical engineering journal 464
99:48-54 465
Mathiazhakan K, Ayed D, Tyagi RD (2016) Kinetics of lipid production at lab scale fermenters by a new 466
isolate of Yarrowia lipolytica SKY7. Bioresource Technology 221:234-240 467
Nanda M, Yuan Z, Qin W, Poirier M, Chunbao X (2014) Purification of crude glycerol using acidification: 468
effects of acid types and product characterization. Austin Journal of Chemical Engineering 1 (1):1-469
7 470
Sabra W, Bommareddy RR, Maheshwari G, Papanikolaou S, Zeng A-P (2017) Substrates and oxygen 471
dependent citric acid production by Yarrowia lipolytica: insights through transcriptome and 472
fluxome analyses. Microbial cell factories 16 (1):78 473
Šajbidor J, Koželouhov’a D, Ĉert’ik M (1992) Influence of some metal ions on the lipid content and 474
arachidonic acid production by Mortierella sp. Folia Microbiologica 37 (6):404-406 475 4 5 6 7 8 9 10 11 12 13 14 15 16 17 18 19 20 21 22 23 24 25 26 27 28 29 30 31 32 33 34 35 36 37 38 39 40 41 42 43 44 45 46 47 48 49 50 51 52 53 54 55 56 57 58 59
Shuib S, Wan Nawi WNN, Taha EM, Omar O, Abdul Kader AJ, Kalil MS, Abdul Hamid A (2014) Strategic 476
feeding of ammonium and metal ions for enhanced GLA-rich lipid accumulation in 477
Cunninghamella bainieri 2A1. The Scientific World Journal 2014
478
Signori L, Ami D, Posteri R, Giuzzi A, Mereghetti P, Porro D, Branduardi P (2016) Assessing an effective 479
feeding strategy to optimize crude glycerol utilization as sustainable carbon source for lipid 480
accumulation in oleaginous yeasts. Microbial cell factories 15 (1):75 481
Tai M, Stephanopoulos G (2013) Engineering the push and pull of lipid biosynthesis in oleaginous yeast 482
Yarrowia lipolytica for biofuel production. Metabolic engineering 15:1-9 483
Vuoristo KS, Mars AE, Sanders JP, Eggink G, Weusthuis RA (2016) Metabolic engineering of TCA cycle 484
for production of chemicals. Trends in biotechnology 34 (3):191-197 485
Wang Y, Gong Z, Yang X, Shen H, Wang Q, Wang J, Zhao ZK (2015) Microbial lipid production from 486
pectin-derived carbohydrates by oleaginous yeasts. Process Biochemistry 50 (7):1097-1102 487
Yang X, Jin G, Gong Z, Shen H, Bai F, Zhao ZK (2014) Recycling biodiesel-derived glycerol by the 488
oleaginous yeast Rhodosporidium toruloides Y4 through the two-stage lipid production process. 489
Biochemical engineering journal 91:86-91 490
Yen H-W, Zhang Z (2011) Effects of dissolved oxygen level on cell growth and total lipid accumulation in 491
the cultivation of Rhodotorula glutinis. Journal of bioscience and bioengineering 112 (1):71-74 492
Yenush L (2016) Potassium and Sodium Transport in Yeast, vol 892. doi:10.1007/978-3-319-25304-6_8 493 494 3 4 5 6 7 8 9 10 11 12 13 14 15 16 17 18 19 20 21 22 23 24 25 26 27 28 29 30 31 32 33 34 35 36 37 38 39 40 41 42 43 44 45 46 47 48 49 50 51 52 53 54 55 56 57 58 59 60
Table 1: Characterization of crude and purified glycerol
Parameter (g/L) Crude glycerol Purified glycerol
Density 1385 ± 10 1242 ± 10 Glycerol concentration 453 ± 5 473 ± 5 Water 132.96 ± 5 232.25 ± 5 Methanol - - pH 13.5 ± 0.1 2.0 ± 0.05 Al 2.58 x 10⁻³ 2.83 x 10⁻³ Ca 1.3 x 10⁻² 2.08 x 10⁻² Cr 1.0 x 10⁻⁴ 1.8 x 10⁻⁴ Cu 1.72 x 10⁻² 1.34 x 10⁻² Fe 8.1 x 10⁻³ 4.2 x 10⁻³ K 73.04 ± 1 10.56 ± 0.5 Mg 7.0 x 10⁻³ 9.2 x 10⁻³ Mn 1.7 x 10⁻⁴ 1.8 x 10⁻⁴ Na 0.38 ± 0.01 0.38 ± 0.01 Ni - 2.0 x 10⁻⁴ P 0.18 ± 0.005 23.7 ± 1 Pb 0.8 ± 0.01 1.0 ± 0.05 S 1.2 x 10⁻² 2.1 x 10⁻² Sn 3.76 x 10⁻² 2.62 x 10⁻² Zn 5.0 x 10⁻³ 3.88 x 10⁻³
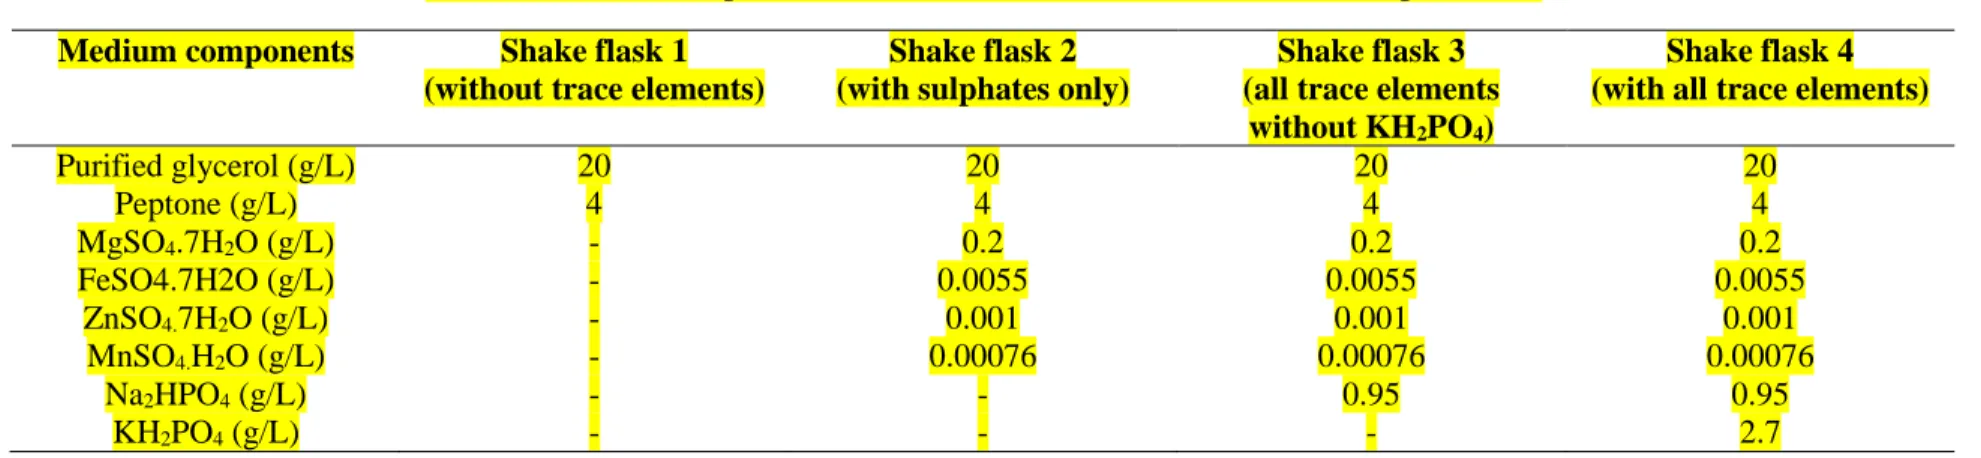
Table 2: Media composition used in different set of shake flasks experiments Medium components Shake flask 1
(without trace elements)
Shake flask 2 (with sulphates only)
Shake flask 3 (all trace elements
without KH2PO4)
Shake flask 4 (with all trace elements)
Purified glycerol (g/L) 20 20 20 20 Peptone (g/L) 4 4 4 4 MgSO4.7H2O (g/L) - 0.2 0.2 0.2 FeSO4.7H2O (g/L) - 0.0055 0.0055 0.0055 ZnSO4.7H2O (g/L) - 0.001 0.001 0.001 MnSO4.H2O (g/L) - 0.00076 0.00076 0.00076 Na2HPO4 (g/L) - - 0.95 0.95 KH2PO4 (g/L) - - - 2.7
Feeding time and component
Fermenter 1 (without trace elements)
Fermenter 2 (with sulphates only)
Fermenter 3 (all trace elements
without KH2PO4)
Fermenter 4 (with all trace elements)
Time 0 h 24 h 40 h 56 h 0 h 24 h 48 h 0 h 24 h 48 h 0 h 20 h 32 h 48 h 72 h Glycerol added (g/L) 20 16 16 15.83 20 15.7 16 20 18.7 19 25 20 20 18.5 19.5 Carbon added (g/L) 8 6.4 6.4 6.33 8 6.28 6.34 8 7.48 7.54 10 8 8 7.4 7.8 Peptone added (g/L) 8 - - - 8 - - 8 - - 9.5 - - - - Nitrogen added (g/L) 0.96 - - - 0.96 - - 0.96 - - 1.1 - - - - C/N (molar) in the medium 10.08 16.63 17.20 23.75 10.21 15.63 21.32 10.11 16.87 24.21 10.23 20.47 33.33 40.23 46.67 Microbial Lipid concentration (g/L) 0 4.47 6.03 7.43 0 4.68 7.05 0 4.76 7.99 0 5.21 6.59 8.49 12.21
Parameter No trace elements (Shake flask 1) Only sulphates (Shake flask 2) All except KH2PO4 (Shake flask 3) All trace elements (Shake flask4) Citric acid (g/L) 4.05 ± 0.2 0 0 0 Lipid (g/L) 0.79 ± 0.04 0.99 ± 0.05 1.08 ± 0.02 1.13 ± 0.02 Glycerol consumed (g/L) 8.42 ± 0.4 8.42 ± 0.4 8.89 ± 0.45 10.54 ± 0.5
Elements
Shake flask 1 (without addition of
trace elements)
Shake flask 4 (with all trace elements)
Actual Requirement (Kuttiraja et al. 2018) Fe (mg/ L) 0.178 1.178 1 K (g/L) 0.447 1.221 0.774 Mg (mg/L) 0.389 20.089 19.7 Mn (mg/ L) 0.008 0.258 0.25 Na (g/ L) 0.540 0.694 0.154 P (g/ L) 1.002 1.824 0.207 S (g/L) 0.140 0.166 0.026 Zn (mg/ L) 0.164 0.394 0.23
Fatty acid
Fermenter 1 (Without trace
elements)
Fermenter 2 (With only sulphates)
Fermenter 3 (Except KH2PO4)
Fermenter 4 (With all trace
elements) C14:0 (Mysteric acid) 16.01% 8.46% 4.15% 3.17% C16:0 (Palmitic acid) 24.59% 11.67% 5.78% 4.64% C18:0 (Stearic acid) 2.6% 3.97% 1.82% 1.51% C18:1 (Oleic acid) 18.76% 15.91% 27.46% 31.7% C18:2 (Linoleic acid) 34.99% 55.05% 60.79% 37.23% Others 3.05% 4.94% - 21.74%
Medium Pyruvic acid (mg/L) Glutamic acid (mg/L) α-ketoglutaric acid (mg/L) Malic acid (mg/L) Fumaric acid (mg/L)
Fermenter 1 (No trace elements) 200 200 250 104 9.2
Fermenter 2 (With only sulphates) 34 14 200 2000 120
Fermenter 3 (Except KH2PO4) 290 4.0 460 1500 100
curve (fermenter studies) Fermenter 1
(no trace elements)
Fermenter 2 (only sulphates)
Fermenter 3 (except KH2PO4)
Fermenter 4 (all trace elements)
Biomass productivity (g/L/h) 0-24 h dX/dt = 0.69 R2 = 0.95 24-80 h dX/dt = 0.20 R2 = 0.97 0-24 h dX/dt = 0.77 R2 = 0.94 24-96 h dX/dt = 0.195 R2 = 0.98 0-24 h dX/dt = 0.85 R2 = 0.98 24-96 h dX/dt = 0.24 R2 = 0.99 0-24 h dX/dt = 1.31 R2 = 0.95 24-96 h dX/dt = 0.26 R2 = 0.97 Lipid productivity (g/L/h) 0-32 h dL/dt = 0.18 R2 = 0.98 32-80 h dL/dt = 0.08 R2 = 0.99 0-32 h dL/dt = 0.19 R2 = 0.98 32-96 h dL/dt = 0.1 R2 = 0.99 0-32 h dL/dt = 0.20 R2 = 0.98 32-72 h dL/dt = 0.1 R2 = 0.99 72-96 h dL/dt = 0.225 R2 = 0.99 0-16 h dL/dt = 0.42 R2 = 0.99 16-72 h dL/dt = 0.129 R2 = 0.99 72-96 h dL/dt = 0.31 R2 = 0.95 Citric acid productivity (g/L/h)
0-24 h dC/dt = 0.074 R2 = 0.98 24-80 h dC/dt = 0.42 R2 = 0.99 0-48 h dC/dt = 0 R2 = 1 48-96 h dC/dt = 0.021 R2 = 0.97 0-48 h dC/dt = 0 R2 = 1 48-96 h dC/dt = 0.044 R2 = 0.9 0-32 h dC/dt = 0 R2 = 1 32-96 h dC/dt = 0.075 R2 = 0.95 Glycerol consumption rate (g/L/h)
0-80 h dS/dt = 0.8 R2 = 0.99 0-48 h dS/dt = 0.67 R2 = 0.99 48-96 h dS/dt = 0.36 R2 = 0.99 0-48 h dS/dt = 0.80 R2 = 0.99 48-96 h dS/dt = 0.41 R2 = 0.98 0-24 h dS/dt = 1.59 R2 = 0.94 24-96 h dS/dt = 0.77 R2 = 0.99