PerfOrmaNce Of hBs
aND The INfOrmaL secTOr
Xavier Oudin
Household businesses, even if they are constituted of only one self-employed per-son, are economic units which produce or distribute goods and services, generate income and have expenditures. They can own assets and invest part of their profit. This chapter deals with the accounts of HBs and evaluates their performance in terms of turnover, value added and profit. It also discusses the dynamics of the HBs through their investments and changes in employment in the previous year.
The first section deals with the economic performance of household businesses, their structure and their characteristics. The value added generated by a HB is low on average, with a median value added of 3 million VND per month for all HBs and 2.4 mil-lion VND for informal HBs. As HBs do not employ many workers, the value added of a HB greatly determines the amount of profit made by the owner. However, there are very diverse situations. Section 2 focuses on the heterogeneity of the HBs and compares the profit earned by HBs with the minimum wage and the poverty line. The third section deals with the capital and investment of HBs. Most of them do not invest and only maintain their equipment. Formal businesses are not more prone to investing than informal ones. The last section confirms this lack of dynamism, as most HBs have been stable in terms of employment for the past twelve months. However, a minority of HBs have increased in size.
1.
aCCOUNTINg RESUlTS fOR HOUSEHOlD BUSINESSES aND
THE INfORmal SECTOR
The weight of the non-farm HBs and, in particular, of the informal sector in the national economy is due to the large number of HBs which operate in this sector rather than to the individual performances of the businesses. These are low on average, with a low turnover and low value added and profit. Investment, as seen at the macroeconomic level, is even weaker.
1.1. Turnover, value added and profit: The low but contrasting performances of household businesses
Turnover is the amount of products, merchandise and services sold. The median monthly turnover for all HBs is 9 million VND, but this figure encompasses a wide range of situations. The difference of scale between informal and formal HBs is signifi-cant, with a median turnover of 7.5 million VND for the former and 22 million VND for the latter (see Table 6.1). Differences in the median turnover among sectors of activity are very large. The service sector is where the median turnover is the lowest, and the manufacturing and construction sector is where it is the highest, except for informal HBs in the trade sector, which have a higher median turnover than those in the ma-nufacturing and construction sector. However, the differences are partly explained by the different signification of turnover across sectors. In the trade sector it is the amount of sales of untransformed merchandise, while in other sectors it is the amount of goods and services produced and sold. Thus, at the same level of value added, HBs in the trade sector have a higher turnover than HBs in the manufacturing and construction and the service sectors. Manufacturing HBs tend to have a high turnover because they use a great amount of raw materials to produce goods. Thus, the turno-ver is not the most suitable indicator of the performance of the HBs. Value added is a better indicator of the performance of the HBs as it reflects the creation of net wealth by the HBs (see Chapter 5 section 1.1 for a more detailed definition).
The median value added of informal HBs is around half that of formal HBs, 2.6 million VND and 5.5 million VND per month respectively. Variations between sectors are almost non-existent in the informal sector (between 2.6 and 2.8 million VND per month), but they are larger among formal HBs, from 4.1 million VND in the trade sector to 8 million VND in the manufacturing and construction sector. In this sector there are more employees on average, and a significant part of the value added is comprised of the salaries of workers.
TaBle 6.1.
averaGe monThlY Turnover, value added and profIT In The hB secTor
(MILLION VND)
Informal hBs formal hBs
Turnover value profit Turnover value profit
added added
Manuf. & constr. Mean 22.7 9.3 6.1 64.0 27.3 21.5
Median 6.2 2.8 2.3 28.0 8.0 4.9 Trade Mean 37.7 5.1 4.8 70.3 10.0 9.1 Median 13.3 2.6 2.5 25.7 4.1 3.9 Service Mean 13.0 5.1 4.1 30.6 13.1 10.6 Median 6.0 2.6 2.2 13.6 6.5 4.8 Total mean 23.4 6.3 4.9 57.6 14.3 12.0 median 7.5 2.6 2.3 21.9 5.5 4.3
Source: 2014/15 HB&IS survey, VASS-CAF & IRD-DIAL; authors’ calculations
The median profit for all HBs is just below 3 million VND per month, and differences across sectors are even lower. However, looking at the profitability, i.e. the profit correc-ted from the level of activity (profit/turnover ratio, calculacorrec-ted on means), differences across sectors appear. The profitability of HBs is around 20 (meaning that the profit represents 20 per cent of the turnover), and it is similar for informal and formal busi-nesses. For both, it is much lower in the trade sector, at 13 per cent. HBs in the trade sector are definitively less profitable on average than HBs related to the production of goods and services, and formality status does not affect profitability, despite the fact that formal HBs have a higher scale of activity than informal HBs. These businesses are on average more profitable in urban than in rural areas. This reveals the existence of obstacles to mobility across sectors as well as the cost of entry into the sectors with the highest profitability: the service sector and the manufacturing and construction sector. Otherwise the tendency to equalize profits would be observed across sectors under economic rationality.
1
The differences between the mean and the median in Table 6.1 illustrate the extre-mely unequal distribution of the value added and other aggregates in the informal sector, and they are detailed in the next section.
1. One HB out of 10 conducts mixed activities comprised of production and trade or service and trade. Their turnover is the addition of goods and services produced and merchandise sold.
1.2. determinants of the value added
What are the main determinants of the value added?2 Answering this question may highlight some of the characteristics of HBs in general and also provide some indica-tions for policies to improve the performance of this sector.
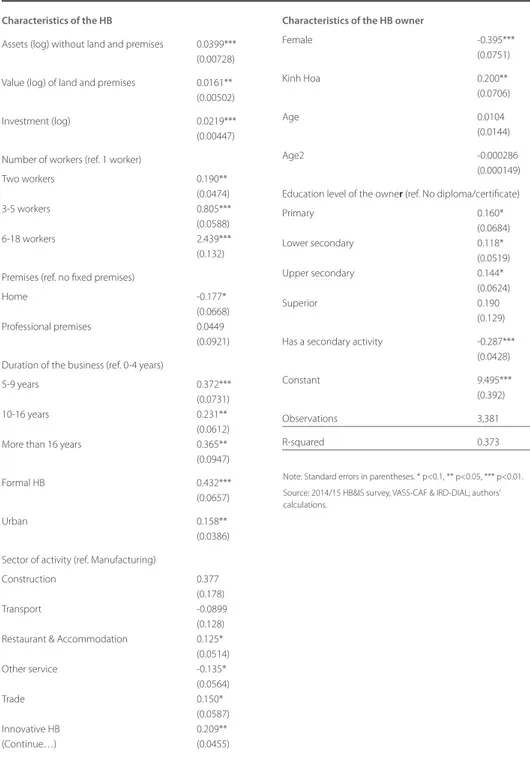
We use an OLS model to explain the value added of the HBs by variables on assets and investment, employment, sectoral characteristics and individual characteristics of the owner (see Table 6.A in the appendix). This model shows that the performance of the HBs is highly correlated with labour. Compared to being self-employed and working alone, having one employee increases the value added of a HB by 21 per cent, and having two to four employees increases the value added by around 125 per cent. Assets are the actual values of machines, tools, furniture and vehicles used for the activity. We do not include here land and premises, which are treated separately.3 The actual value of assets is correlated with the value added, but weakly: An increase of 10 per cent of the value of the assets increases the value added by 1 per cent. In the same way, investment, which includes here the purchase of new or secondhand tools, machines, furniture or vehicles and the expense of maintaining equipment du-ring the past 12 months, has a weak, although significant, effect on the value added. For most HBs, these expenditures for investment are small and sometimes difficult to distinguish from those for raw materials (e.g. tools and furniture that last less than one year). Nearly 80 per cent of the HBs have an annual investment of less than 4 mil-lion VND (see section 3 below). Moreover, for those that have made a higher level of investment, it will yield returns in the following years and it is too early to expect an effect on the value added of the year. Unfortunately, the investment of previous years is not known.
Being formal is strongly associated with the amount of value added, all other things being equal. This suggests a better use of the factors (capital, labour and skills) and a difference in nature (i.e. not only scale), which is not captured by other variables of the model. Formal HBs, on average, yield 54 per cent more value added than informal ones with the same amount of capital and labour. This can be seen as an
2. More than the determinants, we are identifying here the factors associated with the level of value added, as no causal inference has been done.
3. The value of land and premises is mentioned by only 15 per cent of the HBs in the sample, and for half of them this value constitutes more than 90 per cent of the total value of their assets (see details in section 3 below).
efficiency premium for formal HBs. This is true for both urban and rural HBs: They have a value added that is 17 per cent higher when other characteristics including size are controlled for.
Value added is also highly correlated with being innovative. Other things being equal, a HB which innovates its product or production process, or one which prospects for new customers or changes its suppliers to reduce its costs, has a value added that is 23 per cent higher than a HB which does not do any of these things. Chapter 8 gives more insight into this topic.
Longstanding HBs are more likely to be associated with a high level of value added. This could be explained by a selection process in which the most efficient HBs persist. The individual characteristics of the owners are also associated, although only slightly,4 with the performance of the HBs. Females are much less likely to have high value added to their HB: The value added of a HB owned by a woman is on average 48 per cent lower than the value added of a HB owned by a man. The strong negative effect of being female can be explained by “hidden” variables, i.e. characteristics which were not identified in the survey. This can be a lack of opportunities to have better opera-ting conditions. At the sectoral level, they might be confined to activities which are less profitable. For instance, female street vendors may sell items which have a lower profit margin than items sold by their male counterparts. Further in-depth analysis is needed to identify the reason why women are more involved with HBs that have a lower level of efficiency. Similarly, Kinh and Hoa owners (87 per cent of the population of HBs owners) have an advantage which is probably related to the precise location of their businesses, e.g. a better or less remote location, and this was not captured in the survey. As expected, the education level of the owner is positively associated with the value added of a HB, but the correlation is weak.
Not surprisingly, the production factors, labour and capital, are the main determinants, but they are only a partial explanation for the amount of value added. Labour is much more significant and has a stronger impact than capital and investment. Formality and the use of innovative technologies or methods of marketing also characterise the best performing HBs.
1.3. how income in the informal sector relates to the minimum wage
We compare the profit of the businesses with the minimum wage in order to have a view of how working at a HB can provide a living in the context of the Vietnamese labour market. Taking the minimum wage as a benchmark to assess the position of HBs is justi-fied by the fact that the minimum wage is calculated in order to provide workers with a minimum but decent income. One of the mainstream theories about the informal sector, derived from the Harris and Todaro model (Harris and Todaro, 1970), states that informal activities expand due to a supply of labour that cannot enter the formal sector because of barriers or an insufficient labour demand. Excess labour supply in the informal sector makes wages and income in this sector lower than in the formal sector, especially when wages are institutionally set in this sector. A comparison of incomes in the informal sector with the minimum wage set in the formal sector validates this view. In Chapter 4 we saw that three quarters of the wage workers in the informal sector have a salary that is above the minimum wage. However, wage workers only account for 11 per cent of the total labour force in the informal sector. We consider here the case of HB owners.
The minimum wage differs by region because of differences in the cost of living (see Chapter 4). In our sample, which is representative of the whole country, region I constitutes 19 per cent, region II 9 per cent, region III 25 per cent and region IV 47 per cent of the HBs.
While in Chapter 4 we compare the legal minimum wage with the wages of wage workers at HBs and in the informal sector, here we compare it with the income of bu-sinesses owners. The figure we use here is the profit of the business, which is the value added minus wages and taxes. This profit can be utilised as income by the owner, but it can also be saved or used for investment or the reimbursement of debts. It is shared by the household in the case of a family business. In addition, households often have other sources of income not taken into account here, the profit of the business of one of its members being only one of them. Profit is thus a potential income and should be considered as a proxy for individual remuneration for the business owner in the absence of other figures more comparable to the minimum wage.
Nevertheless, this remains an interesting indicator of how HBs, and in particular the self-employed who work alone, adjust to the conditions of the labour market in terms of income. Although the segmentation of the labour market may hinder wage adjust-ments between sectors, the minimum wage in the formal sector has spillover effects on the informal sector (Hohberg and Lay, 2015). Setting a minimum wage in the formal
sector may deter employers from hiring more workers, so the labour supply will turn to the informal sector, which offers lower rates of income (Maloney and Nuñez Men-dez, 2004). However, the empirical literature quoted by these authors shows mixed results concerning the impact of a minimum wage in the formal sector on informal sector incomes. It is likely that the lower incomes in the informal sector are reserva-tion wages (the minimum under which one would prefer not to work) under normal conditions. This “lighthouse effect” of the minimum wage beyond the segment of the labour market that it is meant to benefit was highlighted by Souza and Baltar (1979) in the case of Brazil, and many other empirical studies have confirmed the impact of the minimum wage on the informal sector (Harrison and Leamer, 1997; Khamis, 2008). Since the minimum wage in Vietnam is set at a low level, it should impact the reserva-tion wage.5 In other words, the minimum wage for formal workers impacts income in the informal sector. The results shown below give substance to this hypothesis. The literature is unclear about what the comparison between wages in the formal and informal sectors represents: only wage workers in the informal sector, the only category for which a strict comparison is possible, or HBs owners whose income is the profit? Wage workers comprise only a small portion of the workers in the informal sec-tor. As seen in Chapter 4, wage workers at HBs, and in the informal sector in particular, receive, on average, a wage significantly higher than the minimum wage.
Around half of the informal HB owners and one quarter of the formal ones yield a profit that is below the minimum wage in their respective region. These proportions are very similar in all four regions defined above, despite the utilisation of different thresholds (see Table 6.2).
Moreover, HBs that make a profit that is below the minimum wage are most often owned by people who work part time. Nearly four out of ten owners who make a profit that is below the minimum wage work part time, which is twice as many as those who earn more than the minimum wage. In addition, many of them (around one third) have a second job. All in all, more than half (55 per cent) of the HBs that make a profit that is below the minimum wage are in one of these two situations or both.
TaBle 6.2.
medIan monThlY profIT of hBs compared To The mInImum waGe
(THOUSAND VND)
Informal hBs formal hBs
minimum median profit % above median profit % above
wage minimum minimum
2014 wage wage Region I 2,700 3,200 55.6 6,600 80.2 Region II 2,400 2,700 52.5 6,000 73.5 Region III 2,100 2,300 56.6 3,800 74.6 Region IV 1,900 1,900 49.5 4,000 82.6 Total 2,300 52.8 4,300 79.3
These results do not allow deciding which theoretical view of the informal sector better applies to the Vietnamese case. The fact that half of the informal HBs make a profit that is below the minimum wage may be interpreted as support for the dualistic view of the informal sector. Moreover, our analysis is based on the profit made by HBs, but if we also count the employees, a large share of the workers in the informal sector earn less than the minimum wage. However, we can also see that half of the HBs in the informal sector generate a profit that is above the minimum wage. This can be interpreted as an indication that the informal sector is not mainly a refuge for those who cannot find a job in the formal sector, or that income opportunities are not less attractive in this sector. This hypothesis is further explored in Chapter 11.
0 10 20 30 40 70 50 90 100 80 60 Informal HB HB owner is a part-time worker HB owner has a 2nd job Yes
Makes a profit below the minimum wage No
HB owner is a part-time worker
or has a 2nd job
Read as follows: 94 per cent of the HBs that make a profit that is below the minimum wage in their region are informal, while 65 per cent of those that make a profit that is above the minimum wage are informal.
Source: 2014/15 HB&IS survey, VASS-CAF & IRD-DIAL; authors’ calculations. fIGure 6.1.
characTerIsTIcs of hBs BY level of profIT relaTed To The mInImum waGe
2.
HOUSEHOlD BUSINESSES aRE HIgHly HETEROgENEOUS
IN TERmS Of pERfORmaNCE
Average values of value added, profit and productivity hide important differences between household businesses. The informal sector and, to a lesser extent, formal household businesses are highly heterogeneous in terms of performance. The high heterogeneity of the HBs also contributes to not reducing the informal sector to a sector where workers are confined because of their lack of skills and opportunities to get a better job.
2.1. heterogeneity of the performances of household businesses
The distribution of performance in the informal sector is extremely unequal. Half of the HBs have value added that is less than 3 million VND per month, while a few of them (2 per cent) have value added that is over 50 million VND per month. Household businesses in the formal sector, where the value added is twice as high on average than among informal HBs, are a bit less unequal. In the informal sector, the largest 10 per cent of the HBs generate value added that is 22 times higher than the value added generated by the smallest 10 per cent of the HBs, and in the formal sector the largest 10 per cent of the HBs generate value added that is 19 times higher than the value added by the smallest 10 per cent of the HBs.
In the informal sector, the distribution is more unequal in the manufacturing and construction sector than in the other economic sectors. More than one third of the informal HBs in the manufacturing sector generate value added of less than 1.5 mil-lion VND per month. These are mainly small garment makers or individuals working in food and beverage processing and in basketry. They are found in rural as well as in urban areas in similar proportions. At the top of the ladder, 17 per cent of the informal HBs in the manufacturing and construction sector have value added of over 10 mil-lion VND per month, especially furniture makers and construction HBs, but also some successful tailors or HBs in the food processing sector (see Table 6.3).
Formal businesses have on average a higher level of operation, although one third of them generate value added of less than 3 million VND per month. However, 30 per cent of the formal household businesses have value added of over 10 million VND per month.
The value added is above all correlated with the number of workers. While 60 per cent of the self-employed who work alone generate value added of less than 3 million VND per month, more than 95 per cent of the HBs with more than five workers (including the owner, the spouse, family workers and hired workers) generate value added of over 10 million VND per month. HBs with more than five workers only represent 2 per cent of all the HBs, and most of them are formal (see Figure 6.2).
TaBle 6.3.
dIsTrIBuTIon of The monThlY value added BY secTor and reGIsTraTIon
sTaTus (PERCENTAGE)
Informal hBs formal hBs
manuf. Trade service manuf. & Trade service
& constr. constr.
< 1 million 18.3 20.7 16.8 4.8 6.4 5.7 1 to < 3 million 33.7 36.8 40.0 19.0 27.8 16.0 3 to < 6 million 19.7 22.0 25.1 13.7 26.2 26.8 6 to < 10 million 11.1 9.2 8.2 18.7 18.3 21.2 >= 10 million 17.2 11.2 9.9 43.8 21.4 30.3 Total 100 100 100 100 100 100
Source: 2014/15 HB&IS survey, VASS-CAF & IRD-DIAL; authors’ calculations
0 % 10 % 20 % 30 % 40 % 50 % 60 % 70 % 100 % 80 % 90 % >= 10 million 6 to < 10 million < 1 million 1 to < 3 million 3 to < 6 million
1 worker 2 workers 3-5 workers 6-18 workers
Source: 2014/15 HB&IS survey, VASS-CAF & IRD-DIAL; authors’ calculations fIGure 6.2.
dIsTrIBuTIon of hBs BY caTeGorY of monThlY value added and ToTal
More specifically, HBs which have wage workers are more likely to generate more va-lue. This is not surprising as those HBs must generate enough value added to pay their wage workers. Nearly half of the informal HBs and two thirds of the formal ones with wage worker generate value added of over 10 million VND per month. Among those which have no wage workers, only 11 per cent of the informal HBs and 23 per cent of the formal ones generate value added of over 10 million VND per month.6
2.2. distribution of hBs by profit
The value added tells us about the performance and the size of the businesses. The profit is rather an indicator of profitability and above all of the income of the owner of a HB and his or her family. Although the profit has on average a value amounting to 86 per cent of the value added, it is more unequally distributed than the value added. Around one third of the informal HBs yield a profit of less than 1.5 million VND per month (14 per cent of the formal HBs) (see Figure 6.3). At the other end of the scale, 11 per cent of the informal HBs and twice as many of the formal HBs generate a profit of over 10 million VND per month. The distribution of HBs per category of profit is similar in rural and urban areas. There are slightly more low-profit HBs in rural areas, but many of them have another source of income. The distribution is more unequal in the manufacturing and construction sector.
Looking at the quintiles of profit, the poorest 20 per cent of the informal HBs make a monthly profit of less than 500,000 VND (less than 1 million VND for the formal ones). These values can be compared to the poverty line,7 which was 400,000 VND per per-son per month in rural areas and 500,000 VND in urban areas in 2014 (Demombynes and Vu, 2015). For households of four to five persons, the poverty line is 1.6 to 2 mil-lion VND in rural areas and 2 to 2.5 milmil-lion VND in urban areas. Thus, following this hypothesis about household size, one third (34 per cent) of all the HBs in rural areas generate a profit below the poverty line (1.8 million VND per month per household), and the proportion is the same in urban areas (below 2.2 million VND).8 In addition to
6. Only 5 per cent of the informal HBs and 12 per cent of the formal ones have at least one wage worker. 7. There are two official poverty lines in Vietnam: the GSO-WB poverty line, which is used to compare
the level of poverty throughout time and with other countries, and the Ministry of Labour, Invalids and Social Affairs (MOLISA) poverty line, which is used to define the beneficiaries of social programmes. The poverty line used here is the MOLISA poverty line, which is lower than the GSO-WB poverty line. 8. Let us recall that profit is not necessarily the individual or household income, and it cannot be strictly
compared with individual monetary measurements of poverty. Businesses that generate a low profit can be temporarily in a bad situation. In addition, their profit may constitute only one of several sources of income for the owner and his/her family.
the poor HBs, there is a large group of near-poor and lower-middle-income HBs. At the country level, this category is largely represented in the informal sector. Moreover, as these people “are not eligible for social assistance and yet also cannot access social insurance” (UNDP 2015), they are particularly vulnerable. As their income fluctuates, they may fall back into poverty.
There is a segment of well-off HB owners, primarily among the formal HBs. Interestin-gly, there are more of them in rural areas among informal businesses. Here again, the reason might be that registration is easier to avoid in rural areas: The biggest informal HBs in rural areas would probably be formal if they were located in urban areas.
0 5 10 15 25 30 35 20 < 1.5 million 1.5 to < 3 million 3 to < 6 million Informal HBs Formal HBs 6 to < 10 million >= 10 million
Read as follows: 32 per cent of the informal HBs make a monthly profit of less than 1.5 million, and 15 per cent of the formal HBs make a monthly profit of less than 1.5 million.
Source: 2014/15 HB&IS survey, VASS-CAF & IRD-DIAL; authors’ calculations fIGure 6.3.
dIsTrIBuTIon of Informal and formal hBs BY caTeGorY of monThlY
2.3. second job and other sources of income
The secondary activity provides HB owners and their families with a non-negligible complement of income. The range of income generated by a secondary activity is smaller than the range of income generated by HBs. For those who make a small pro-fit and have a low income, the secondary activity doubles their income on average, while for the biggest HBs, the additional income is a more marginal complement. Thus, the secondary activity reduces the variance of incomes in the informal sector and more generally among all HBs (see Figure 6.4).
This result softens the conclusions above. Around one quarter of the HBs which generate a profit under the poverty line have another activity and another source of income. Nevertheless, the number of HBs which can be considered poor or near poor remains high. 0 2 000 4 000 6 000 8 000 12 000 16 000 18 000 14 000 10 000 0 5 10 20 25 30 15 < 1.5 million 1.5 to < 3 million 3 to < 6 million Median profit of the HB Median secondary activity income 6 to < 10 million >= 10 million % that have a 2nd activity (right scale)
Source: 2014/15 HB&IS survey, VASS-CAF & IRD-DIAL; authors’ calculations fIGure 6.4.
medIan profIT of The hBs and secondarY acTIvITIes BY caTeGorY of monThlY profIT
3.
CapITal aND INVESTmENT
Detailed questions were asked about the assets and the purchase of equipment (investment). Assets are divided into five categories (machines, tools, vehicles, furni-ture and land/premises). For each of these categories, it was possible to list up to three items, and for each of them questions were asked about their cost and other maintenance expenses for the past twelve months, their present value, and also the ownership and the way the expenses are paid. This allows a more accurate recons-truction of the capital and investment expenditures of HBs than through a unique question.
Capital is a main factor of production, but its importance for small, and especially informal, businesses cannot be analysed in the same way as for large enterprises. The amounts of capital declared by the owners are very small, and the main factor of production is undoubtedly labour. Thus, capital is significant only for the higher segment of HBs.
3.1. a small stock of capital on average
To define the stock of capital, we excluded land and premises from the analysis be-cause only a small share of the HBs (12 per cent of the informal HBs and 27 per cent of the formal ones) declared land and/or premises as capital for their business. This un-derdeclaration of land and premises as capital in our survey comes from the difficulty of distinguishing this kind of HB capital from what is owned as individual property, especially when HBs operate out of their home (41 per cent of the HBs, see Chapter 3). When they declared land and/or premises as part of their capital, the value was huge compared with other elements of capital. For informal HBs, the average value of land and premises used for their business, when they declared an amount, was 192 million VND, or 84 per cent of their capital. For formal businesses it was 1,350 million VND, or 95 per cent of their capital. For this reason, land and premises are not considered as capital in this analysis.
A small share of the HBs (8 per cent of the informal and 5 per cent of the formal HBs) stated that they had no capital at all. It is true that some activities require no equip-ment, or only tools that are counted as raw materials when they last less than one year. Moreover, the respondents were asked to state the market value of their equipment and assets, and several stated that their equipment had no more value on the market.
The amount of capital is generally very small. Excluding those who stated they had no capital, the median value of the capital without land and premises is 4 million VND. It is around twice as high for formal HBs and even higher for formal manufacturing and service HBs (see Table 6.4). Nevertheless, many formal HBs, especially in the trade sector, have very limited assets.
The distribution of assets among all the HBs is extremely unequal, more than what we have seen with the value added and the profit. One third of the formal HBs and nearly half of the informal ones evaluate their assets at less than 3 million VND (see Figure 6.5). However, a portion of the HBs have a significant amount of capital: 35 per cent of the formal HBs and 14 per cent of the informal HBs declared a capital over 50 million VND.
TaBle 6.4.
medIan and mean asseTs BY maIn secTor (THOUSAND VND)*
Informal hBs formal hBs Total
median mean median mean median mean
Manuf. & constr. 7,200 26,000 34,350 91,000 9,300 39,000
Trade 1,762 24,000 3,030 22,000 2,300 23,000
Service 3,170 44,000 13,650 107,000 4,040 57,000
Total 3,020 33,000 7,050 61,000 4,000 40,000
* Excluding HBs which declared no capital; land and premises not included. Source: 2014/15 HB&IS survey, VASS-CAF & IRD-DIAL; authors’ calculations
The structure of the capital, i.e. the proportion of physical capital items such as machines, furniture, vehicles or tools, is presented in Figure 6.6. The capital is mostly used for machines in the manufacturing and construction sector among both formal and informal HBs. In the trade and service sectors, the structure of the capital among formal HBs differs from the structure of the capital among informal HBs. Informal HBs in the trade and service sectors use their capital mostly for transportation. The use of furniture, machines and tools is negligible. Among formal HBs in these sectors of activity, machines, furniture and tools constitute more than half of their capital. This reflects the different mode of production at informal and formal HBs in the trade and service sectors, where formal HBs use more advanced technologies than informal HBs.
0 % 10 % 20 % 30 % 40 % 50 % 60 % 70 % 100 % 80 % 90 % > 50,000 > 10,000 & <= 50,000 > 0 & <= 500 0 (no assets) > 500 & <= 3,000 > 3,000 & <= 10,000 Informal HBs Formal HBs
* Land and premises not included.
Source: 2014/15 HB&IS survey, VASS-CAF & IRD-DIAL; authors’ calculations fIGure 6.5.
Most of the equipment, tools, machines, vehicles and furniture were purchased by the owner. In a few cases, equipment was inherited (2 per cent) or was given to them by someone (3 per cent). Rental or loans of equipment are rare (2 per cent of the assets). HBs, both formal and informal, almost never resort to loans or the leasing of machines or vehicles. They do not gain access to physical capital such as machines or vehicles in this manner, and that may hinder the development of their business.
3.2. Initial capital
The informal sector has often been defined as a sector with no entry barrier (Sethura-man, 1976). Among the barriers, one of the greatest is the amount of capital needed to start a business. The average amount of initial capital needed depends on the type of activity. It is negligible for street vendors (1.6 million VND on average), but it can be rather significant for some manufacturing activities, e.g. a median initial capital of 30 million VND for the manufacturing of metal products or furniture, and around 300 million VND for high-tech industries.
0 % 20 % 40 % 60 % 100 % 80 % Manuf & constr.
Trade Service Manuf &
constr.
Trade Service
Tools Vehicles Furnitures Machines
Informal hBs formal hBs
* Land and premises not included.
Source: 2014/15 HB&IS survey, VASS-CAF & IRD-DIAL; authors’calculations fIGure 6.6.
sTrucTure of capITal amonG hBs BY formalITY sTaTus and secTor
Some of the HBs interviewed in the 2014/15 HB&IS survey have been around for over three decades and it is thus difficult to compare the value of the initial capital of HBs created recently with those created earlier. In order to make the values comparable, we applied a deflation rate that was calculated after the inflation rate was calculated. However, we did not apply the calculation to HBs older than 16 years because changes in the price structure made the deflation rate less accurate as we went back in time (and also because the respondents’ statements are less reliable for expenditures made such a long time ago).
Less than 5 per cent declared that they had no initial capital (this includes non-answers), so there is nearly always a barrier, however small, to setting up an informal HB. Nearly no informal HB can be started without a minimum of funds.9 However, these funds did not exceed 1 million VND for one fifth of the informal HBs, regardless of the sector of activity. The median initial capital of 9.7 million VND represents four times the median monthly profit made by informal HBs (see Tables 6.2 and 6.5). However, 55 per cent of the informal HBs started their activity with a capital of over 5 million VND, which is a non-negligible amount as more than half of the informal HBs stated that they are not able to borrow this amount within a week (see Chapter 10). Thus, the entry barrier is low, but for a small segment of the informal sector only.
The median initial capital is higher in the manufacturing sector and lower in the trade sector. In the service sector, the amount of initial capital differs across industries: Trans-portation HBs need a large amount of initial capital, while for some repair HBs a set of tools is sufficient. For restaurants, the amount of capital varies greatly depending on how the HB is operated. A street restaurant that only serves soup can be operated with very little capital, while a restaurant that has a dedicated premises is much more expensive to run.
This diversity is rendered by a comparison of the initial capital that informal and for-mal businesses have at their disposal. Very often, for the same activity, the difference in the amount of initial capital is great. In the service sector, for example, the median initial capital for formal businesses is 5 times greater than the initial capital for informal businesses (see Table 6.5).
9. The question was about the amount of money needed to set up the HB. It is broader than capital in the form of equipment, tools or furniture, as it included a revolving fund and the constitution of stocks.
When comparing initial capital with the stock of actual capital, one can see that two thirds of the HBs have a lower value of capital now than when they started their business. This proportion is similar for formal and informal businesses. This indicates that many businesses do not intend to expand their business after its creation. This characteristic is not related to the year of creation of the business. We found similar proportions of businesses whose current assets have a lower value than their initial capital among businesses created recently and others created more than a decade ago. These businesses do not invest more capital to expand their business but only maintain or replace equipment when necessary. Meanwhile, one third of the businesses have increased their capital. This is consistent with other indicators of the dynamism of HBs (see section 4).
3.3. Investment
In the previous chapter we looked at investment made by HBs from a macroeco-nomic point of view and showed that investment in the HB sector is very low. This section details investment at the HB level.
It is difficult to define investment in such a survey with the precision of an accountant. We consider here as investment all expenses related to assets, i.e. the purchase (in most cases), repair and maintenance of machines, furniture, vehicles or tools in the past 12 months. Here again, we exclude investment in land and premises.
More than one third of the HBs do not invest at all. When excluding those that do not invest, the median level of total investment was 1.4 million for informal HBs and 3 mil-lion VND for formal HBs for the year 2014. These are very small values. Only 15 per cent
TaBle 6.5.
medIan value of InITIal capITal of hBs BY economIc secTor
(THOUSAND VND)
Informal hBs formal hBs Total
median mean median mean median mean
Manuf. & constr. 14,600 34,600 81,100 141,000 18,300 53,500
Trade 5,200 28,500 30,700 163,000 10,200 79,500
Service 12,200 61,400 76,700 323,400 15,200 117,400
Total 9,700 43,300 43,200 207,000 14,400 87,200
* Excluding HBs created more than 16 years ago, HBs with zero initial capital and no answers; 2014 prices. Source: 2014/15 HB&IS survey, VASS-CAF & IRD-DIAL; authors’ calculations
of the informal HBs and 24 per cent of the formal HBs invested more than 5 million VND during the previous year. Only one third of the HBs with a yearly profit of over 50 million VND invested more than 5 million VND. This share is higher for the largest HBs but it remains small. It is remarkable that one third of the formal businesses which generate a high profit do not invest at all (see Figure 6.7).
For formal HBs, investment is poorly correlated with the value added and the profit of the business, meaning that the larger HBs in terms of value added or those which gene-rate more profit are not necessarily those that invest the most. Moreover, the investment rate (the share of value added that is invested) is not at all related to the amount of value added. Small businesses which invest small amounts may, however, invest a large share of their profit, while businesses that make a large profit do not necessarily invest a large share of their profit.
0 % 20 % 40 % 60 % 100 % 80 % < 10 million10 to < 25 M.25 to < 50 M.50 to < 100 M.>= 100 M. < 10 million10 to < 25 M.25 to < 50 M.50 to < 100 M.>= 100 M.
> 5 million VND 1 to < 5 million VND < 1 million VND No investment Yearly investment
Yearly profit
Informal hBs
Yearly profit
formal hBs
* Investment for the year 2014, only if investment >0, land and premises are excluded. Source: 2014/15 HB&IS survey, VASS-CAF & IRD-DIAL; authors’ calculations
fIGure 6.7.
dIsTrIBuTIon of hBs BY caTeGorY of profIT and InvesTmenT
The levels of investment differ greatly across sectors of activity. Manufacturing and construction is the most dynamic sector in that aspect. Only 27 per cent of the HBs in this sector do not invest at all. 44 per cent of the HBs in the trade sector and 31 per cent in the service sector do not invest at all. The median value of investment among HBs that invest is 2.7 million VND in the manufacturing and construction sector, and that is almost three times higher than the amount of investment in the trade sector (1 million VND) and twice the median value of investment in the service sector (1.5 million VND).
The structure of investment also differs by economic sector, with the bulk of investment being made in machines and tools for manufacturing activities (see Figure 6.8). In the service sector, more than half of the investment is spent on vehicles, mainly motorcycles purchased by informal HBs. This is due to the weight of motorbike taxis, which are in-formal. Among formal services, the main investment is in furniture (at restaurants and hotels) but also personal services such as hairdressers (salons) and computer services. Most of the investment is financed by a household’s own savings. Nevertheless,
bor- 0 % 20 % 40 % 60 % 100 % 80 % Manuf & constr.
Trade Service Manuf &
constr.
Trade Service
Tools Vehicles Furnitures Machines
Informal hBs formal hBs
* Investment for the year 2014, only if investment >0, land and premises are excluded. Source: 2014/15 HB&IS survey, VASS-CAF & IRD-DIAL; authors’ calculations
fIGure 6.8.
dIsTrIBuTIon of InvesTmenT BY TYpe of InvesTmenT and secTor*
rowing from a bank or other formal institution occurs in some cases, but only for small amounts (see Figure 6.9).
The 2014/15 HB&IS survey captures many more HBs in Hanoi and Ho Chi Minh City which have invested than the 2007 survey did. In 2014, two thirds of the HBs stated that they had invested, and only one out of six stated that they had invested in 2007. Although figures on investment have to be taken cautiously, this shows that the 2014/15 survey captured the amount of investment fairly well and that the rate of those which do not invest reflects the reality of the situation. As seen in the previous chapter, the investment rate (investment divided by the value added) is low at the macro level when taking the sum of investment of all the HBs into account.
Capital and investment among household businesses is difficult to measure for two main reasons. First, it is not always easy to say when assets are the capital of the HB and when they belong to the family. This is the case mainly for premises, but also for vehicles and some other assets. Second, as HBs do not calculate depreciation, the net carrying amount of capital goods is difficult to estimate. Moreover, many HBs use secondhand and old equipment for which the book value is meaningless.
savings Gift Inheritance family loan
customer / supplier loan usurer
Bank
microfinance institution Other & no answer
73% 4% 10% 13% 7% 59% 6% 27% Informal hBs formal hBs
Source: 2014/15 HB&IS survey, VASS-CAF & IRD-DIAL; authors’ calculations fIGure 6.9.
HBs do not invest much, and most of them, especially the informal ones, have a very small amount of capital. In these conditions, the usual indicators, e.g. the rate of return on investment and the productivity of capital, cannot be calculated or are meaningless.
4.
gROwTH Of HOUSEHOlD BUSINESSES
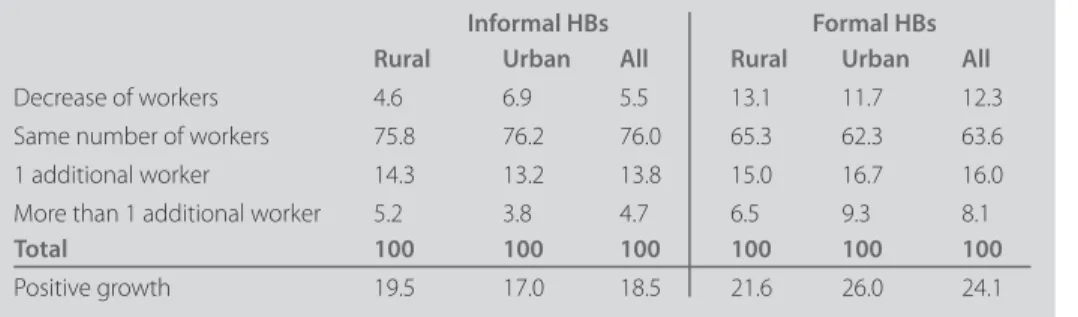
This lack of dynamism is also rendered by the evolution of the HBs through time in terms of employment. Three quarters of the informal HBs have not changed size in terms of workers since their creation. This proportion is lower for formal HBs (64 per cent).
Table 6.6 shows that HBs are more likely to experience growth than a downturn in their labour force: While 12 per cent of the HBs had to decrease the number of workers between the start of their business and 2014, around one quarter have been able to increase their manpower. This may be explained by the large proportion of owners who started their business without any additional workers (55 per cent).
A comparison of formal and informal businesses shows that formal HBs appear to expe-rience more fluctuation in their manpower than informal ones. Although they are more likely to expand their business, they are also more vulnerable to a downturn in their labour force. This could reflect the higher entrepreneurship of formal businesses going hand in hand with less risk aversion.
Growth of the businesses differs according to geographical area as well. Informal HBs in urban areas are more likely to reduce the size of their business than those in rural areas,
TaBle 6.6.
GrowTh sInce The sTarT of The BusIness In Terms of workers BY area and reGIsTraTIon sTaTus
Informal hBs formal hBs
rural urban all rural urban all
Decrease of workers 4.6 6.9 5.5 13.1 11.7 12.3
Same number of workers 75.8 76.2 76.0 65.3 62.3 63.6
1 additional worker 14.3 13.2 13.8 15.0 16.7 16.0
More than 1 additional worker 5.2 3.8 4.7 6.5 9.3 8.1
Total 100 100 100 100 100 100
Positive growth 19.5 17.0 18.5 21.6 26.0 24.1
and they also experience positive growth less often. This demonstrates that they face higher competition than their rural counterparts. As far as formal HBs are concerned, urban formal HBs seem to be more dynamic than rural ones because they are more likely to increase their labour force, and they are less likely to reduce it or keep it as it is, i.e. remain stable.
Looking at manpower growth across industries (see Figure 6.10), the manufacturing sector is the most vibrant sector, and opportunities for growth are more prevalent there. The highest rate of a decline for informal HBs is in the service sector, and the highest rate of decline for formal HBs is in the trade sector.
0 10 20 30 40 70 50 80 90 60 Decrease in workers Same number of workers More than 1 additional worker 1 additional worker
Manufacturing Trade Service
Source: 2014/15 HB&IS survey, VASS-CAF & IRD-DIAL; authors’ calculations fIGure 6.10.
CONClUSION
This chapter has highlighted the low level of performance of HBs as a whole. With a median value added of 2.6 million VND per month for informal HBs and 5.5 million VND for formal HBs, the creation of net wealth by HBs is weak, reflecting again a poor use of technology and low labour productivity. Around half of the informal HB owners and one quarter of the formal ones yield a profit that is below the minimum wage. One can roughly estimate that one third of the HBs generate a profit that is below the poverty line, although some of them only partially rely on their HB to make a living. The level of capital is generally very small, and significant investments are rarely made. Two thirds of the HBs do not invest in expanding their business with more capital but instead only maintain or replace equipment when necessary.
However, this global picture hides huge differences across sectors of activities and regis-tration status. The manufacturing and construction sector is the best performing sector, with the highest level of value added. It is also where the HBs are the largest in terms of labour, as shown in Chapter 3, and the performance of the HBs is highly correlated with labour. The HB sector is clearly labour intensive, with a higher value added among the HBs with more workers. Nevertheless, the manufacturing and construction HBs also have the highest level of capital and invest the most as well. The trade sector is definitely the least profitable sector, and it has the lowest level of capital and investment. In addi-tion, it is the sector with the lowest entry barrier: It is easy to start a business in the trade sector, but on average it provides less income than HBs in other sectors, partly because of high competition. As a consequence, the HB owners in the trade sector are more likely than the HB owners in other sectors to have started their business because they had no other choice (see Chapter 11).
Comparing formal with informal businesses, formal HBs are characterized by much higher performance than informal HBs. The value added they generate, the amount of capital they use and the amount they invest is on average twice as high as among informal HBs. Better performance among formal HBs, even when other characteristics of the business such as the size are controlled for, suggests a better use of production fac-tors and a different mode of production with greater use of technologies than among informal HBs.
The performance of HBs is extremely contrasted, not only between formal and infor-mal HBs, but inside each of these sectors. The inforinfor-mal sector and, to a lesser extent, formal household businesses are highly heterogeneous in terms of performance. In the
informal sector, the largest 10 per cent of the businesses generate value added that is 22 times higher than the smallest 10 per cent of the businesses. Around one informal HB out of ten generates a profit of over 10 million VND per month, and almost the same proportion has a capital of over 50 million VND. The high heterogeneity of the HBs also contributes to not reducing the informal sector to a sector where workers are confined because of their lack of skills or opportunities to get a better job.
Thus, as in other countries, the household business sector in Vietnam is highly heteroge-neous. A large segment is definitely living in poverty or at least is vulnerable. At the other end of the scale, around one third of the HBs are performant and dynamic: 19 per cent of the HBs make a monthly profit of over 50 million VND; 3 per cent of the HBs invest more than half of the total investment in the sector; and one third of the HBs have increased their capital since they started their activity. In between, there is a segment of low-and middle-income HBs which are very vulnerable, above all when they do not have a social safety net.
appENDIx
TaBle 6.a deTermInanTs of The (loG) value added (ols esTImaTIon)
characteristics of the hB
Assets (log) without land and premises 0.0399*** (0.00728) Value (log) of land and premises 0.0161** (0.00502)
Investment (log) 0.0219***
(0.00447) Number of workers (ref. 1 worker)
Two workers 0.190** (0.0474) 3-5 workers 0.805*** (0.0588) 6-18 workers 2.439*** (0.132) Premises (ref. no fixed premises)
Home -0.177*
(0.0668)
Professional premises 0.0449
(0.0921) Duration of the business (ref. 0-4 years)
5-9 years 0.372***
(0.0731)
10-16 years 0.231**
(0.0612)
More than 16 years 0.365**
(0.0947)
Formal HB 0.432***
(0.0657)
Urban 0.158**
(0.0386) Sector of activity (ref. Manufacturing)
Construction 0.377
(0.178)
Transport -0.0899
(0.128) Restaurant & Accommodation 0.125* (0.0514) Other service -0.135* (0.0564) Trade 0.150* (0.0587) Innovative HB 0.209** (Continue…) (0.0455)
characteristics of the hB owner
Female -0.395*** (0.0751) Kinh Hoa 0.200** (0.0706) Age 0.0104 (0.0144) Age2 -0.000286 (0.000149) Education level of the owner (ref. No diploma/certificate)
Primary 0.160* (0.0684) Lower secondary 0.118* (0.0519) Upper secondary 0.144* (0.0624) Superior 0.190 (0.129) Has a secondary activity -0.287***
(0.0428)
Constant 9.495***
(0.392)
Observations 3,381
R-squared 0.373
Note: Standard errors in parentheses. * p<0.1, ** p<0.05, *** p<0.01. Source: 2014/15 HB&IS survey, VASS-CAF & IRD-DIAL; authors’ calculations.