This is an author-deposited version published in:
http://oatao.univ-toulouse.fr/
Eprints ID: 10736
To link to this article: DOI: 10.1016/j.ijpsycho.2013.06.009
URL:
http://dx.doi.org/10.1016/j.ijpsycho.2013.06.009
To cite this version:
Scannella, Sébastien and Causse, Mickaël and
Chauveau, Nicolas and Pastor, Josette and Dehais, Frédéric Effects of the
audiovisual conflict on auditory early processes. (2013) International Journal
of Psychophysiology, vol. 89 (n° 1). pp. 115-122. ISSN 0167-8760
O
pen
A
rchive
T
oulouse
A
rchive
O
uverte (
OATAO
)
OATAO is an open access repository that collects the work of Toulouse researchers and
makes it freely available over the web where possible.
Any correspondence concerning this service should be sent to the repository
Effects of the audiovisual conflict on auditory early processes
Sébastien Scannella
a,b,⁎
, Mickaël Causse
b, Nicolas Chauveau
a, Josette Pastor
a, Frédéric Dehais
b aINSERM, UMRS 825, Université de Toulouse, UPS, CHU Purpan, Pavillon Baudot, 31024 Toulouse cedex 3, FrancebDMIA, ISAE, Université de Toulouse, 10 Avenue E. Belin 31055 Toulouse Cedex 4, France
a b s t r a c t
a r t i c l e
i n f o
Keywords: N100 Audiovisual conflict Early gating Aviation safetyAuditory alarm misperception is one of the critical events that lead aircraft pilots to an erroneous flying decision. The rarity of these alarms associated with their possible unreliability may play a role in this misperception. In order to investigate this hypothesis, we manipulated both audiovisual conflict and sound rarity in a simplified landing task. Behavioral data and event related potentials (ERPs) of thirteen healthy participants were analyzed. We found that the presentation of a rare auditory signal (i.e. an alarm), incongruent with visual information, led to a smaller amplitude of the auditory N100 (i.e. less negative) compared to the condition in which both signals were congruent. Moreover, the incongruity between the visual information and the rare sound did not significantly affect reaction times, suggesting that the rare sound was neglected. We propose that the lower N100 amplitude reflects an early visual-to-auditory gating that depends on the rarity of the sound. In complex aircraft environ-ments, this early effect might be partly responsible for auditory alarm insensitivity. Our results provide a new basis for future aeronautic studies and the development of countermeasures.
1. Introduction
In aeronautics, auditory alerts are known to offer various advantages in emergency situations. They provide information for pilots without requiring head/gaze movements (Edworthy et al., 1991) and are associ-ated with shorter reaction times than visual alerts (Stephan et al., 2003; Wheale, 1981). Yet, a review of air-safety reports reveals that a signifi-cant number of accidents are due to a lack of reaction to auditory alarms (Bliss, 2003). The startling, distracting and disturbing nature of auditory alarms may confuse the human operators who often try to find a way to reduce the noise rather than analyzing the meaning of the alert (Doll et al., 1984; Edworthy et al., 1991; Peryer et al., 2005).
A complementary explanation is to consider the properties of perceptual and attentional systems. Vision has been shown to be dominant over hearing in different experimental paradigms (Colavita and Weisberg, 1979; Sinnett et al., 2007; Yuval-Greenberg and Deouell, 2009). This dominance may be exacerbated under high visual load con-dition especially when the auditory stimulus is unattended (Macdonald and Lavie, 2011). Since visual activity is a key element of flying, visual information processing could interfere with concurrent appraisal of rare and unpredictable auditory alarms, especially when the messages from these two sensory inputs are incongruent. Indeed, a commonly suspected explanation is related to the unreliability of the alerting systems that is likely to induce the so-called ‘cry-wolf effect’ (Breznitz, 1984; Wickens et al., 2009), leading the pilot to mistrust alarms (Bliss
and Dunn, 2000; Song and Kuchar, 2001; Sorkin, 1988), especially under high workload situations (Bliss and Dunn, 2000). While cognitive neuroscience has investigated visual and auditory interactions for decades (Besle et al., 2009; Feng et al., 2008; Jacoby et al., 2012; Parasuraman, 1985; Parks et al., 2011), the impact of the incongruity between two signals simultaneously sent to two distinct sensory inputs in a high processing load context has been rarely addressed in human factors literature.
Event-Related Potentials (ERPs) have been widely used to study auditory and visual stimuli interferences during complex tasks, par-ticularly through the analysis of the N100 component of the ERPs. At the perceptual level, the N100 is the electrophysiological signal of the stimulus processing with maximum negative amplitude around 100 ms after the stimulus onset. On the one hand, the visual N100 generators seem to be located in the dorsal extrastriate cortex of the middle occipital gyrus and the parietal lobe (Di Russo et al., 2002) resulting in an occipito-temporal scalp topography with a max-imum amplitude around 170 ms. On the other hand, the auditory N100 generators have been shown to be located in the primary and associative auditory cortices, in the superior temporal gyrus and Heschl's gyrus (Zouridakis et al., 1998) resulting in a fronto-central topography and a maximum amplitude around 120 ms. It has been proposed that the auditory N100 amplitude increases with the occur-rence of low probability stimuli (Kramer et al., 1995). Reciprocally, the amplitude of the N100 initiated by a frequent sound decreases as the rate of presentation increases, which can be related to habitu-ation mechanisms (Kramer et al., 1995; Moura et al., 2010). More-over, this amplitude is an index of auditory-attention allocation (Hink et al., 1977). Many studies have revealed that the auditory
⁎ Corresponding author at: ISAE, Department of Human Factors, 10 avenue E. Belin, 31055 Toulouse Cedex 4, France. Tel.: +33 561339643.
N100 amplitude may be lowered in audiovisual tasks (Kramer et al., 1995; Singhal et al., 2002) compared to an auditory task alone. It has been proposed that the visual processing may have a distractive effect on the auditory perception (Oray et al., 2002). These auditory N100 modulations might be the consequence of a multicomponent sensory gating system (Boutros and Belger, 1999) and more precisely a visual-to-auditory sensory gating that may affect early auditory processes in the auditory cortex (Lebib et al., 2003).
1.1. Present study
These latter studies bring interesting evidence supporting our hypothesis that the visual modality may attenuate early auditory alarm processing. Nevertheless, these paradigms have investigated unimodal decision making and do not give conclusive results when decision making rules rely both on visual and auditory modalities that may conflict, as it is the case in aeronautics. Furthermore, few studies have examined the effects of the audiovisual congruency in a high processing load and dynamic context. In an attempt to repro-duce conditions that lead pilots to ignore rare auditory signals (i.e.
alarms), we adopted a neuroergonomics approach (Parasuraman
and Rizzo, 2006) in a controlled protocol inspired from cognitive neuroscience.
In a plausible aeronautical task, volunteers were asked to supervise an automated and simulated landing sequence. To do so, they had to consider both visual and auditory signals across various situations. To induce complexity and uncertainty in the decision making process, we created different levels of concordance across three visual instru-ments (i.e. all visual instruinstru-ments may not be in accordance). To fit with realistic conditions, and especially those in which mistrust in rare auditory signals has been mainly reported (Breznitz, 1984; Wickens et al., 2009), we designed an oddball-like paradigm. We used an auditory alarm that corresponded to a rare stimulus, as in real flight condition (Parasuraman and Riley, 1997), and a clearance sound that corresponded to a frequent stimulus. In addition, both the clearance and the alarm sounds were partly unreliable (i.e. 50% of time). Finally, this reliability was manipulated via the congruency between the information provided by a main visual instrument and the type of sound.
1.2. Hypotheses
Four main hypotheses were set within this ecological experiment. We expected that task performances (reaction times, accuracy) would be affected by 1) the rarity of the sound and 2) the audiovisual congru-ency, resulting in lower performance for alarms compared to clearance sounds and for audiovisual incongruent compared to congruent condi-tions. Additionally, according to the empirical observations mentioned in the pre-cited aeronautical literature, we expected that 3) the partic-ipants would tend to ignore incongruent alarms (i.e. a rare sound that is in contradiction with visual information). Consequently, we expected congruency effects with frequent sounds and not with rare sounds.
Finally, to support the hypothesis of the activation of a visual-to-auditory gating system, we predicted 4) an attenuation of visual-to-auditory processing for rare incongruent sounds compared to other stimuli. This could be demonstrated by a smaller N100 amplitude for the incongruent-rare sounds compared to the congruent ones.
2. Materials and methods 2.1. Participants
We recruited fourteen healthy volunteers, all alumni from the uni-versity of Toulouse (7 women, mean age: 25.6 ± 3.7). They gave their written informed consent to participate in this study; one volunteer was excluded because of noncompliance with the instructions. All
were right-handed, as measured by the Edinburgh Handedness Inventory (Oldfield, 1971) and native French speakers, with normal or corrected-to-normal vision and normal hearing. No participant had a history of neurological disease, psychiatric disturbance, substance abuse, or was taking psychoactive medications.
2.2. Task 2.2.1. Stimuli
For this study, we used videos of landing simulations performed with the flight simulator IL-2 Sturmovik software (Ubisoft®) and recorded with Snagit 9.0 (TechSmith®). Each video showed a cockpit view from an airplane on approach to landing on two possible run-ways. In the center of the video, a yellow navigation reticle informed the participants that the airplane was heading for the left or right run-way (Fig. 1a). In addition, three navigational instruments were presented, one at the bottom of the screen, which corresponded to the main instrument, and two on the lateral parts of the screen, at 15° from the foveal point. Each instrument had a green (“Land”) and a red (“Go around”) zone. The main instrument indicated which runway was clear for landing (the green one) and the lateral instruments corresponded to generic landing instruments. Simulta-neously to the visual instruments, a “clearance sound” (750 Hz tone at 78 dB SPL, in 75% of cases) or an “alarm sound” (1250 Hz tone at 78 dB SPL, in 25% of cases) was presented. Finally, a continuous soundtrack (60 dB white noise), simulating the permanent auditory stimulation in the cockpit, was presented throughout the video. 2.2.2. Videos description
Each video consisted of an alternation of 4 non-active (1.5 s of non-colored instruments) and 3 active (1.5 s of colored instruments cor-responding to a trial) phases (Fig. 2) depending on the visual instru-ments being switched ‘off’ or ‘on’. The video started and finished with a non-active phase. Sixteen different basic videos were used. During active phases, the position of the reticle on the runway (left or right) was glob-ally counterbalanced. During non-active phases, the position of the reticle randomly alternated between the two runways. Each video was presented 15 times resulting in a total of 720 random trials (i.e. 3 active phases × 16 videos × 15 presentations). This corresponded to 288 ‘clearance’ and 72 ‘alarm’ sound presentations for each congruent or in-congruent trial (see audiovisual congruency definition below,Section 2.2.4).
2.2.3. Plausible aeronautical instructions
The decision rules were inspired from standard aircraft proce-dures and focused on two main points. First, pilots often have the run-way in sight during the landing. Second, the navigation instruments are not absolutely reliable, meaning that different indicators may give inconsistent information on a given flight parameter (Orasanu and Martin, 1998; Song and Kuchar, 2001). Consequently, pilots have regularly to crosscheck different data to disambiguate the situa-tion. Participants had to decide to land or to perform a go-around according to both visual and auditory signals. They were instructed that they could consider landing if the bottom main instrument indi-cated that the runway the plane was heading for (indiindi-cated by the navigation reticle) was accessible and that they should trust this main instrument as long as it was consistent with at least one of the two lateral visual instruments. In these cases (Fig. 1a and b), the land-ing decision can be based on visual information only (i.e. the sounds can be neglected). When the bottom main instrument was inconsis-tent with both lateral instruments (Fig. 1c) the visual information could not be trusted anymore. In the latter situation, visual informa-tion was no more reliable and participants had to trust the sounds only: the clearance sound signaled that the landing could be achieved whereas the alarm signaled that a go-around had to be performed. Participants had to give their responses as soon as possible while
trying to be the more accurate, using a two-button mouse (Land or Go around). The response time window corresponded to the duration of an active phase (i.e. 1500 ms), time-locked to the active phase onset.
2.2.4. The audiovisual congruency
We defined the audiovisual congruency as a function of both the main instrument's status (‘green’ or ‘red’, bearing in mind the runway the plane was heading for) and the auditory information (‘clearance’ or ‘alarm’). Therefore, there were 50% congruent stimuli correspond-ing to a red runway/alarm sound or a green runway/clearance sound and 50% incongruent stimuli corresponding to a red runway/clearance sound or a green runway/alarm sound (seeFig. 3). This resulted in four
conditions: congruent and incongruent with a clearance sound; congruent and incongruent with an alarm sound.
2.2.5. Experimental procedure
Before the experiment, a 64-electrode cap was placed on each participant's head. Participants were then seated in a comfortable reclining armchair, placed in a dimly lit, sound-damped room. They were instructed to keep their forearms on the chair's arms, with the right forefinger and middle finger resting on the two-button mouse. Left and right response buttons were counterbalanced across the par-ticipants. Visual stimuli were presented on an ACER 17″ monitor placed one meter from the participants. All sounds were played through binaural inserted earplugs. The overall experiment was
Navigation reticle
1
2
3
left and right runways
Clearance or Alarm Clearance or Alarm
Visual-based responses Auditory-based responses Clearance or Alarm
b
a
c
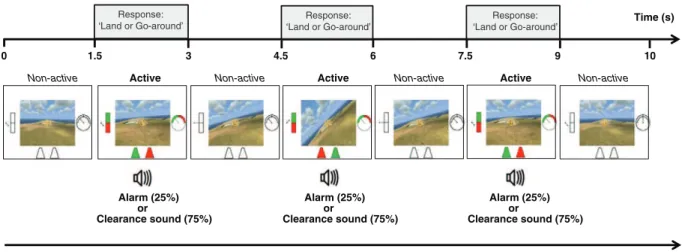
Fig. 1. The landing task. a. Two runways (left and right) are visible during the task. The yellow reticule indicates the runway that the plane is heading for (the right one in this example). Three visual flying instruments (numbered 1, 2 and 3 in gray) surround the central video. The instrument 1 is the main visual instrument and represents the two runway accessibility. The runway that is accessible for landing is in green and inaccessible in red. Instruments 2 and 3 are generic and are made of two zones: the green zone refers to ‘land’ and the red zone refers to ‘go-around’. The value of these instruments is pointed by the black arrow. In addition, two sounds are presented: a clearance sound (75% of overall sounds at 78 dB SPL) indicates that the landing is possible and an alarm sound (25% of overall sounds at 78 dB SPL) indicates that a go-around must be performed. a, b and c. The participants are instructed to decide whether the landing is possible or not according to the following audiovisual rule: if the main visual instrument and at least one of the two generic visual instruments provide the same information (‘land’ or ‘go-around’), the decision can be done according to this dominant visual parameters only (visual-based responses). If the main instrument provides an information inconsistent with both the two generic-instrument indication, visual instruments are considered as failing and the decision has to be done according to the auditory signal (clearance = ‘land’ and alarm = ‘go-around’; auditory-based responses). 4.5 1.5 3 6 0 7.5 9 10 Time (s) Response: ‘Land or Go-around’ Response: ‘Land or Go-around’ Response: ‘Land or Go-around’ Alarm (25%) or Clearance sound (75%) Alarm (25%) or Clearance sound (75%) Alarm (25%) or Clearance sound (75%)
Non-active Active Non-active Active Non-active Active Non-active
White noise (60 dB) Response: ‘Land or Go-around’ Response: ‘Land or Go-around’ Response: ‘Land or Go-around’
Fig. 2. Video sequence. A video lasts 10 s. It starts with a 1.5 non-active phase (all instruments turned ‘off’) then every 1.5 s, a 1.5 s active phase (instruments ‘on’) is presented for a total of 3 active phases per video. For each active phase the participant has to decide if he/she can land or not. The video is not influenced by the participant's responses. During the 10 s a white noise (60 dB) is continuously broadcasted.
completed for each participant in four 10-minute runs after they underwent training for half an hour to ensure that they all had reached the maximum level of performance.
2.3. EEG recordings and preprocessing
EEG data were recorded continuously with a BioSemi EEG system (BioSemi©, Amsterdam) from 64 ‘active’ (preamplified) Ag-AgCl scalp electrodes located according to the International 10/20 system, at a 512 Hz sampling rate and with a 0–104 Hz band-pass filter. The data were then re-referenced offline to the algebraic average of the left and right mastoids, down-sampled to 500 Hz, and filtered with a band-pass of 0.5–30 Hz. The trials containing artifacts (>500 μV) were automatically excluded (i.e. on average 3% of the trials). An
in-dependent component analysis using EEGlab (www.sccn.ucsd.edu/
eeglab) was performed to isolate and reject eye blinks and a visual inspection of the data was done to reject residual artifacts. Data were later segmented in 1700 ms epochs starting 200 ms before the onset of each active phase (baseline). Individual ERPs and grand averages were computed using SPM8 (The Wellcome Trust Centre for Neuroimaging, UCL).
2.4. Data analyses
All behavioral and EEG data were analyzed with Statistica 7.1 (StatSoft©). The Shapiro–Wilk test showed that the reaction times (RTs) were normally distributed. Therefore, a two-way ANOVA with within-subject factors: ‘Type of sound’ (clearance vs. alarm) and ‘Congruency’ (congruent vs. incongruent) was carried out on RTs for hits. Post-hoc analyses were done with the Tukey's HSD (Honestly Significant Difference) test. The Shapiro–Wilk test showed that the ac-curacy rate was not normally distributed even after trying to transform data (e.g. square root, log…). Therefore, we used non-parametric Wilcoxon Signed-rank tests to examine the effects of the 2 within-subjects factors on the percentage of hits.
The ERPs elicited by a condition were computed as the averaged electrophysiological responses to repeated presentations of that con-dition, locked to the stimulus onset for correct responses. The mean
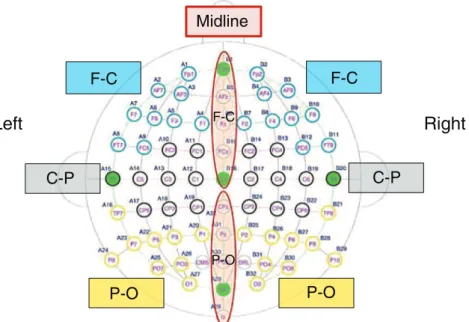
ERPs' amplitudes for the N100 analysis were calculated in a time win-dow from 100 to 200 ms after the stimulus onset, determined both from visual inspection and from results of consecutive analyses of 25-ms latency windows. Eight regions of interest (ROIs) were defined to identify the N100 topographic distribution. This was done by first separating the 64 electrodes into two groups: midlines (10) and laterals (54), and then defining subsets of electrodes for analysis. The midlines were divided into two ROIs: fronto-central (FPz, AFz, Fz, FCz and Cz) and centro-occipital (CPz, Pz, POz, Oz and Iz). The lateral elec-trodes were separated into six ROIs: left (FP1, AF7, AF3, F7, F5, F3, F1, FT7 and FC5) and right (FP2, AF8, AF4, F8, F6, F4, F2, FT8 and FC6) fronto-central; left (FC1, FC3, C1, C3, C5, T7, CP1, CP3 and CP5) and right (FC2, FC4, C2, C4, C6, T8, CP2, CP4 and CP6) centro-parietal, and left (TP7, P1, P3, P5, P7, P9, PO3, PO7 and O1) and right (TP8, P2, P4, P6, P8, P10, PO4, PO8 and O2) parieto-occipital (seeFig. 4). For the midline electrodes, within-subjects ANOVAs with factors ‘Type of sound’ (clearance vs. alarm), ‘Congruency’ (congruent vs. incongruent) and ‘ROI’ (fronto-central vs. parieto-occipital), were computed on the mean amplitudes of the ERPs. Similar ANOVAs were computed for the lateral electrodes, with ‘Type of sound’, ‘Congruency’, ‘Hemisphere’ (left vs. right), and ‘ROI’ (frontal vs. temporal vs. parietal) as factors. All p-values for ERP results were adjusted with the Greenhouse–Geisser correction for non-sphericity when necessary. HSD tests were used for post-hoc comparisons.
3. Results 3.1. Behavioral
The ANOVA on RTs revealed a main effect of the type of sound (F(1,12) = 7.33, p b .05, ηp2= .38) and the congruency (F(1,12) = 7.20, p b .05, ηp2= .38). These effects corresponded to longer RTs in response to alarm compared to clearance and in incongruent trials compared to congruent trials. A near-significant type of sound × congruency two-way interaction was observed (F(1,12) = 4.71, p = .051, ηp2= .28; seeFig. 5). To better understand this result, we looked at post-hoc tests. As expected, HSD post-hoc tests revealed that an audiovisual conflict effect (i.e. significant RT cost for
Clearance (75%)
Congruent (50%)
Type of sound
Alarm (25%)
Audiovisual congruency
Fig. 3. The audiovisual conflict. According to the type of sound (Alarm vs. Clearance sound) and the status of the main instrument (red vs. green), audiovisual presentations can be congruent or incongruent. For instance, the occurrence of an alarm when the main instrument indicates a possible landing constitutes an incongruent trial whereas the occurrence of a clearance sound with a clear runway refers to an audiovisual congruent trial.
incongruent trials in comparison to congruent ones) only occurred with clearance sounds (p b .001).
Concerning the accuracy (seeFig. 5), we found a conflict effect with-in the alarm condition (p b .05) correspondwith-ing to a better accuracy for congruent than for incongruent audiovisual presentations. On the contrary, no conflict effect was observed within the clearance condition (p = .97).
3.2. EEG
Results of ANOVAs on ERP data are presented inTable 1andFig. 6. The presentation of visual and auditory stimuli generated exogenous and endogenous separate ERPs. According to the latency and the to-pography, we observed a N100, with maximal amplitude in the central region around 130 ms post-stimulus onset. This N100 was consistent-ly followed by a P200, with maximal amplitude around 230 ms after the stimulus onset. Finally, a fronto-central P300 peaking around 380 ms was also induced. On the basis of visual analysis and our
working hypothesis, we focused on the N100 and determined a time window from 100 to 200 ms from the stimulus onset for analyses.
A significant main effect of the ROI over lateral and midline elec-trodes (seeTable 1) showed a maximal N100 amplitude in the central region (mean amplitude for lateral electrodes: FC = −3.26 μV; CP = −4.48 μV and PO = −4.34 μV; p b .01; for midline electrodes: FC = −4.24 μV and CO = −5.83 μV; p b .05). This typical central distribution with polarity reversal at mastoid electrodes (see Supple-mentary material for N100 scalp distribution) supported the fact that the N100 was largely related to the auditory stimuli; since visual N100 is more characterized by a maximum negativity in the occipito-temporal region and has longer latency. More interestingly, we found a significant main effect of the type of sound over the whole scalp. This was demonstrated by a larger N100 amplitude for the alarm sound than for the clearance sound (respectively − 4.51 μV vs. − 3.57 μV; p b .001; for the central electrodes, and − 4.46 μV vs. − 3.60 μV; p b .001; for lateral electrodes;Fig. 6a). The congruency also affected the N100 amplitude resulting in a larger
Left
F-C
Right
P-O
Midline
F-C
C-P
P-O
F-C
C-P
P-O
Fig. 4. Electrode groups for statistical analyses. The 64 electrodes are first divided in two groups: midlines and laterals. The midlines are then subdivided in two groups (red circles; FC: fronto-central; PO: parieto-occipital). The laterals are divided in two groups (left and right) and then in three groups (colored rectangles; FC: fronto-central; CP: centro-parietal; PO: parieto-occipital).
Congruent Incongruent Congruent Incongruent
900 1000 1100 1200 Reaction times (ms) 75 80 85 90 95 100 Accuracy (% correct)
Clearance
Alarm
NS*
NS*
Fig. 5. Behavioral results. Left: Mean reaction times as a function of the Type of sound and the Congruency. Error bars represent the standard error of the mean. Right: Accuracy as a function of the Type of sound and the Congruency. Error bars represent the quartile of the median. *: p b .05, NS: non-significant.
N100 for congruent than for incongruent trials over the lateral electrodes (respectively −4.26 μV vs. −3.80 μV; p b .05; Fig. 6b). Regarding the interaction effects, we found that the type of sound × congruency was significant (Fig. 6c). Post-hoc analyses revealed that the effect of the congruency over the N100 amplitude was only ob-served for the alarms over the whole scalp. This effect corresponded to a larger amplitude for congruent alarms than for all other conditions (for central electrodes: congruent alarm = −5.97 μV vs. incongruent alarm = −5.00 μV; p b .05 — for lateral electrodes: congruent alarm = −4.93 μV vs. incongruent alarm = −3.96 μV; p b .05). See alsoFig. 6d for ERP representation and Supplementary material for differential maps.
4. Discussion
The aim of this study was to analyze the effects of the audiovisual conflict on task performance and brain activity within the context of flying. Specifically, this study was made in an attempt to answer to the question: why do pilots ignore rare auditory alarms? Our main hypothesis was that the visual processing would be dominant over the rare auditory alarm processing in an audiovisual conflict situation, leading to an early visual-to-auditory gating and, consequently, to a decreased sensitivity to this specific sound. We designed a simplified aeronautical decision making task in which we manipulated the type of sound (rare alarms vs. frequent clearances) and the audiovisual congruency between the information provided by the main visual instrument and the sound meaning.
A first issue of this study was to ensure that our protocol could successfully generate particular attentional demands solicited during landings (Lee and Liu, 2003) and during the processing of the alarm (Bliss and Dunn, 2000). This was an important point as this study addressed a phenomenon that exists in real flying situations. The use of numerous visual and audiovisual combinations (i.e. different level of concordances) allowed us to generate difficult and realistic decision making conditions. Indeed, to make a correct landing deci-sion, participants had to analyze the configuration of the three visual instruments and to determine the type of sound. Our behavioral results tend to show that our task was difficult enough, particularly the incongruent/alarm condition, as indicated by the relative low accuracy and the rather high RTs (above 1100 ms) compared to conventional audiovisual tasks (Senkowski et al., 2006). Thus, our protocol was able to reproduce some processing load and conse-quently represents a relevant approach to study flying activity in a well-controlled environment.
In accordance with our hypotheses, the task performance was affect-ed by the rarity of the sound and by the audiovisual congruency. Our re-sults revealed a significant interaction effect between the congruency and the type of sound regarding behavioral and electrophysiological
measurements. Indeed, the behavioral data analyses showed that the audiovisual incongruity had a deleterious effect on the RTs during clear-ance sound presentation only. This increased RT arguably corresponded to the time needed to solve the audiovisual conflict between the main visual instrument (indicating that the runway was not accessible) and the clearance sound (indicating a possible landing). On the contrary, no increase of the RT was observed for the alarm sounds in the incon-gruent condition. In addition, we found that the accuracy was not diminished by the audiovisual conflict within the clearance sounds whereas this was the case within the alarm sounds. Taken together, these results suggest that the alarms were neglected when they were incongruent with the visual information. This possible lack of alarm per-ception provoked a lower accuracy when the sound had to be taken into account to make a correct decision (when the bottom main instrument was inconsistent with both lateral instruments, condition in which the visual information could not be trusted anymore). In parallel, electro-physiological results demonstrated that while the alarm sounds elicited a larger N100 amplitude than clearance sounds, this was no longer the case when the alarm was incongruent with the visual information. Indeed, in this case, the N100 amplitude went to the level observed for the clearance sound.
One could claim that these observed modifications of the alarm-related N100 amplitude could also be the result of an enhanced re-sponse due to concomitant compatible visual information (i.e. ampli-fication of the alarm-related N100 in congruent condition rather than a diminution of the alarm-related N100 in the incongruent condi-tion). This is an effect that we cannot totally exclude because only a control condition (i.e. unimodal sound presentations) could have specified the part of visual facilitation in the congruent condition. Nevertheless, according to various studies (Kramer et al., 1995; Lijffijt et al., 2009; Moura et al., 2010), the alarm-related auditory N100 is expected to be larger than the one elicited by the clearance sound due to its low frequency of occurrence (as it is shown by the main effect of the type of sound in the present study), which was no more the case in our incongruent condition. Therefore, while we assume that this smaller alarm-related auditory N100 amplitude was mostly the consequence of the incongruity, we do not exclude the possibility that the congruent situation had also a facilitating effect, triggering larger alarm-related auditory N100 amplitude.
Considering our assumption, the smaller alarm-related N100 within incongruent situations arguably relies on audiovisual interac-tions that could take place at the sensorial level (Kramer et al., 1995; Singhal et al., 2002) leading to lesser auditory-attention alloca-tion (Hink et al., 1977). Indeed, as suggested by different studies (Oray et al., 2002; Reale et al., 2007), the audiovisual incongruity may affect the auditory N100 via a distractive effect from visual infor-mation (i.e. the runway is accessible) over hearing (Oray et al., 2002). Particularly, it has been reported that an early attentional visual-to-auditory gating mechanism could take place between 30 and 130 ms post-stimulus, as described byLebib et al. (2003). It is very likely that the visual dominance present in our task with the rare and incongruent sounds may have been promoted by the high pro-cessing load and the instructions given to the participant (i.e. because the bottom visual main instrument was the most important indica-tor). Consequently, when decisions have to be taken according to audiovisual decision rules, the visual dominant information may modulate the contradictory and unpredictable auditory information at the sensorial level.
It is worth noting that the clearance-related N100 was not affected by the audiovisual congruency, allowing this auditory stimulus to in-teract at the behavioral level with contradictory visual information, certainly during post-perceptual processes (Botvinick et al., 2001; Wang et al., 2002). Regarding the identical occurrence probability of congruent and incongruent trials for both types of sound (i.e. 50%), a plausible explanation is that this effect is likely to be sensitive to the occurrence probability of the sounds. We postulate that the high
Table 1
Main ANOVA results on the mean N100 amplitudes. Time window 100–200 ms (N100)
Electrodes Effects F(df) Adjusted p (G–G) Epsilon (G–G) Partial η2 Midline Sound (1,12) = 29.57 ⁎⁎⁎ 1.00 0.71 Congruency (1,12) = 3.86 0.07 1.00 – Sound × congruency (1,12) = 5.35 ⁎ 1.00 0.31 ROI (1,12) = 6.34 ⁎ 1.00 0.35 Lateral Sound (1,12) = 44.26 ⁎⁎⁎ 1.00 0.79 Congruency (1,12) = 4.98 ⁎ 1.00 0.29 Sound × Congruency (1,12) = 7.04 ⁎ 1.00 0.37 ROI (2,24) = 8.09 ⁎⁎ 0.65 0.40
ROI (Region of Interest): fronto-central vs. centro-occipital for midline electrodes; fronto-central vs. centro-parietal vs. parieto-occipital for lateral electrodes.
⁎ p b .05. ⁎⁎ p b .01. ⁎⁎⁎ p b .001.
occurrence frequency of the clearance sound (75% of overall sounds) has made this sound a highly anticipated event that probably blurred the congruency effect over the related N100 amplitude. Thus, in our landing scenarios, the simultaneous occurrence of incongruity and rarity of the sound seemed to be mandatory for this early gating could take place.
The results presented in this study could appear in contradiction with other studies that did not reveal any effect of the vision on the auditory processes (Parks et al., 2011; Senkowski et al., 2007). According toBesle et al. (2009)this is probably due to differences in the paradigms used. Indeed, they showed that a larger number of crossmodal effects in sensory-specific cortices were found when the task required a detailed analysis of the sensory features of the stimu-lus (such as in our task), than when a superficial stimustimu-lus analysis was necessary to perform the task. They proposed that the partici-pants are likely to be “auditory dominant” in a superficial analysis task, because of faster auditory detection for simple stimuli (Fort et al., 2002; Molholm et al., 2002). This may explain why in detection tasks, modality-specific interaction effects were observed only in the visual cortex. Finally, the use of different stimuli across studies limits the extent to which we can compare different experiments. Our task presented complex and dynamic stimuli and generated a high processing load, very likely to affect the processing of additional
auditory stimuli. Accordingly, the conclusion made in this study probably applies to complex task only.
5. Conclusion
This study provides a new electrophysiological insight into a pi-lots' tendency of favoring visual perception to the detriment of critical auditory information such as rare and unexpected alarms. It also em-phasizes the interest of merging cognitive neuroscience with cogni-tive ergonomics (Sarter and Sarter, 2003) within a neuroergonomics approach (Parasuraman and Rizzo, 2006) to refine the underlying mechanisms of human error (Fedota and Parasuraman, 2010). This work is the first step in the understanding of the processes involved in the pilot auditory insensitivity. It opens the way to new paradigms using electrophysiological measurements and developing new proto-cols with real pilots and co-pilots in a motion flight simulator (Dehais et al., 2012). The current study has some limitations that should be taken into account in the generalization of our conclusion. First, the rather small sample size (n = 13) may have resulted in identification of effects specific to this particular cohort and lower statistical power; therefore statistical analyses are more likely to identify only strong task effects. Second, due to the difficulty of recruiting experienced pilots, our participants were non-pilots. However, we assume that
0 200 400 600 800 -10 -5 0 5 10
Time from stimulus onset (ms)
µV
channel Cz
Type of Sound Congruency
Clearance Alarm -6,0 -5,5 -5,0 -4,5 -4,0 -3,5 -3,0 -2,5 µV Congruent Incongruent -6,0 -5,5 -5,0 -4,5 -4,0 -3,5 -3,0 -2,5 µV
***
*
a
b
d
Type of Sound x Congruency
Congruent Incongruent -6,0 -5,5 -5,0 -4,5 -4,0 -3,5 -3,0 -2,5 µV NS
*
c
Clearance Alarm Clearance Congruent Clearance Incongruent Alarm Congruent Alarm Incongruent*
Fig. 6. ERP analyses. a. The N100 is significantly larger for the alarm than for the clearance sound. b. A main effect of the congruency leads to lower N100 amplitude for audiovisual incongruent situations. c. In addition, the congruency effect on the N100 is present within the alarm presentation whereas there is no significant difference within the clearance-related N100. d. ERP graphical representation for all conditions over the Cz electrode shows a congruency effect on the alarm-related N100 only. Results for main and interaction effects are shown for the averaged lateral electrodes. *: p b .05, ***: p b .001.
our results emphasize that the audiovisual conflict effect applies to all people. Third, regarding the central N100 topography with polarity reversal at mastoids and considering the control of potential stimulus confounds, the contribution of visual stimuli to N100 effects has to be considered as minimal. In addition, we did not fully reproduce the po-tential high stress that may weigh on the pilots during the landing phase essentially because the go-around maneuver is quite rare (around 3 out of 1000 landings); thus we do agree that our experi-ment does not totally fit reality on this point. However, for statistical reasons, this low proportion of go-around was not reproducible in an EEG experiment. Finally, a control condition could have specified the part of visual facilitation in the alarm congruent condition (versus lower alarm-related N100 caused by the incongruity). However, from a cockpit design point of view, both explanations lead to conclude that the concomitant occurrence of conflicting visual and auditory alarms disrupts the processing of information. On the other side, compatible visual and auditory information seems advantageous and may also enhance the brain response. This latter point will be addressed in a future study.
Despite their limitations, our electrophysiological and behavioral data provides additional evidence that visual information could impact auditory processes at an early stage, before any high level pro-cess may have occurred. This seems to result in an auditory blunting, provided that the auditory signal is rare and incongruent with visual dominant information.
Supplementary data to this article can be found online athttp:// dx.doi.org/10.1016/j.ijpsycho.2013.06.009.
Acknowledgments
The authors thank C. Blanchard and V. Duflot for their technical support, J.F. Gagnon for helpful corrections and Kristin Beach for the English proofreading. This study was supported by the Midi-Pyrénées Regional Council grants 05006110 and R07054BB, and DGA-MRIS. References
Besle, J., Bertrand, O., Giard, M.H., 2009.Electrophysiological (EEG, sEEG, MEG) evi-dence for multiple audiovisual interactions in the human auditory cortex. Hearing Research 258 (1–2), 143.
Bliss, J.P., 2003.Investigation of alarm-related accidents and incidents in aviation. The International Journal of Aviation Psychology 13 (3), 249–268.
Bliss, J.P., Dunn, M.C., 2000. Behavioural implications of alarm mistrust as a function of task workload. Ergonomics 43 (9), 1283–1300.http://dx.doi.org/10.1080/ 001401300421743.
Botvinick, M.M., Braver, T.S., Barch, D.M., Carter, C.S., Cohen, J.D., 2001.Conflict monitoring and cognitive control. Psychological Review 108 (3), 624–652.
Boutros, N.N., Belger, A., 1999.Midlatency evoked potentials attenuation and augmenta-tion reflect different aspects of sensory gating. Biological Psychiatry 45 (7), 917–922. Breznitz, S., 1984.Cry Wolf: The Psychology of False Alarms. Lawrence Erlbaum Associates. Colavita, F.B., Weisberg, D., 1979.A further investigation of visual dominance. Perception
& Psychophysics 25 (4), 345–347.
Dehais, F., Causse, M., Regis, N., Menant, E., Labedan, P., Vachon, F., Tremblay, S., 2012. Miss-ing critical auditory alarms in aeronautics: evidence for inattentional deafness. Paper Presented at the Human Factors and Ergonomics Society Conference, Boston, USA. Di Russo, F., Martínez, A., Sereno, M.I., Pitzalis, S., Hillyard, S.A., 2002.Cortical sources of
the early components of the visual evoked potential. Human Brain Mapping 15 (2), 95–111.
Doll, T.J., Folds, D., Leiker, L.A., 1984.Auditory information systems in military aircraft: current configurations versus the state of the art. Final Report, 1 May-30 Sep. 1983 Georgia Inst. of Tech., Atlanta. Systems Engineering Lab., 1.
Edworthy, J., Loxley, S., Dennis, I., 1991.Improving auditory warning design: relation-ship between warning sound parameters and perceived urgency. Human Factors: The Journal of the Human Factors and Ergonomics Society 33 (2), 205–231. Fedota, J.R., Parasuraman, R., 2010.Neuroergonomics and human error. Theoretical
Issues in Ergonomics Science 11 (5), 402–421.
Feng, T., Qiu, Y., Zhu, Y., Tong, S., 2008.Attention rivalry under irrelevant audiovisual stimulation. Neuroscience Letters 438 (1), 6–9.
Fort, A., Delpuech, C., Pernier, J., Giard, M., 2002.Dynamics of cortico-subcortical cross-modal operations involved in audio–visual object detection in humans. Cerebral cortex (New York, NY: 1991) 12 (10), 1031.
Hink, R.F., Van Voorhis, S.T., Hillyard, S.A., Smith, T.S., 1977.The division of attention and the human auditory evoked potential. Neuropsychologia 15 (4–5), 597–605.
Jacoby, O., Hall, S., Mattingley, J., 2012.A crossmodal crossover: opposite effects of visual and auditory perceptual load on steady-state evoked potentials to irrelevant visual stimuli. NeuroImage 61 (4), 1050.
Kramer, A.F., Trejo, L.J., Humphrey, D., 1995.Assessment of mental workload with task-irrelevant auditory probes. Biological Psychology 40 (1–2), 83–100.
Lebib, R., Papo, D., de Bode, S., Baudonniere, P.M., 2003.Evidence of a visual-to-auditory cross-modal sensory gating phenomenon as reflected by the human P50 event-related brain potential modulation. Neuroscience Letters 341 (3), 185–188. Lee, Y.H., Liu, B.S., 2003.Inflight workload assessment: comparison of subjective and
physiological measurements. Aviation, Space, and Environmental Medicine 74 (10), 1078–1084.
Lijffijt, M., Lane, S.D., Meier, S.L., Boutros, N.N., Burroughs, S., Steinberg, J.L., Swann, A.C., 2009.P50, N100, and P200 sensory gating: relationships with behavioral inhibi-tion, atteninhibi-tion, and working memory. Psychophysiology 46 (5), 1059–1068. Macdonald, J.S., Lavie, N., 2011. Visual perceptual load induces inattentional deafness.
Attention, Perception, & Psychophysics 73 (6), 1780–1789.http://dx.doi.org/ 10.3758/s13414-011-0144-4.
Molholm, S., Ritter, W., Murray, M., Javitt, D., Schroeder, C., Foxe, J., 2002.Multisensory auditory–visual interactions during early sensory processing in humans: a high-density electrical mapping study. Brain Research. Cognitive Brain Research 14 (1), 115. Moura, G.S., Trinanes-Pego, Y., Carrillo-de-la-Pena, M.T., 2010. Effects of stimuli intensity
and frequency on auditory p50 and n100 sensory gating. Advances in Experimental Medicine and Biology 657, 5–17.http://dx.doi.org/10.1007/978-0-387-79100-5_1. Oldfield, R.C., 1971.The assessment and analysis of handedness: the Edinburgh
inven-tory. Neuropsychologia 9 (1), 97–113.
Orasanu, J., Martin, L., 1998.Errors in aviation decision making: a factor in accidents and incidents. Paper Presented at the Human Error Safety System Development (HESSD), Seattle, Washington, USA.
Oray, S., Lu, Z.L., Dawson, M.E., 2002.Modification of sudden onset auditory ERP by involuntary attention to visual stimuli. International Journal of Psychophysiology 43 (3), 213–224.
Parasuraman, R., 1985.Event-related brain potentials and intermodal divided attention. Paper Presented at the Proceedings of the Human Factors and Ergonomics Society Annual Meeting.
Parasuraman, R., Riley, V., 1997.Humans and automation: use, misuse, disuse, abuse. Human Factors: The Journal of the Human Factors and Ergonomics Society 39 (2), 230–253.
Parasuraman, R., Rizzo, M., 2006.Neuroergonomics. The Brain at Work, vol. 195177614. Oxford University Press, USA.
Parks, N., Hilimire, M., Corballis, P., 2011.Steady-state signatures of visual perceptual load, multimodal distractor filtering, and neural competition. Journal of Cognitive Neuroscience 23 (5), 1113.
Peryer, G., Noyes, J., Pleydell-Pearce, K., Lieven, N., 2005.Auditory alert characteristics: a survey of pilot views. The International Journal of Aviation Psychology 15 (3), 233–250.
Reale, R., Calvert, G., Thesen, T., Jenison, R., Kawasaki, H., Oya, H., Brugge, J., 2007. Auditory–visual processing represented in the human superior temporal gyrus. Neuroscience 145 (1), 162–184.
Sarter, N., Sarter, M., 2003.Neuroergonomics: opportunities and challenges of merging cognitive neuroscience with cognitive ergonomics. Theoretical Issues in Ergonom-ics Science 4 (1–2), 142–150.
Senkowski, D., Molholm, S., Gomez-Ramirez, M., Foxe, J.J., 2006.Oscillatory beta activity predicts response speed during a multisensory audiovisual reaction time task: a high-density electrical mapping study. Cerebral Cortex 16 (11), 1556–1565. Senkowski, D., Saint-Amour, D., Kelly, S., Foxe, J., 2007.Multisensory processing of
natu-ralistic objects in motion: a high-density electrical mapping and source estimation study. NeuroImage 36 (3), 877.
Singhal, A., Doerfling, P., Fowler, B., 2002.Effects of a dual task on the N100–P200 complex and the early and late Nd attention waveforms. Psychophysiology 39 (2), 236–245. Sinnett, S., Spence, C., Soto-Faraco, S., 2007.Visual dominance and attention: the
Colavita effect revisited. Perception & Psychophysics 69 (5), 673–686.
Song, L., Kuchar, J.K., 2001.Describing, predicting, and mitigating dissonance between alerting systems. Paper Presented at the 4th International Workshop on Human Error, Safety, and System Development, Linköping, Sweden.
Sorkin, R.D., 1988.Why are people turning off our alarms. Journal of the Acoustical Society of America 84 (3), 1107–1108.
Stephan, K.L., Smith, S.E., Parker, S.P.A., Martin, R.L., McAnally, K.I., 2003.Auditory warnings in the cockpit: an evaluation of potential sound types. Innovation and Consolidation in Aviation 231–241.
Wang, Y., Wang, H., Cui, L., Tian, S., Zhang, Y., 2002.The N270 component of the event-related potential reflects supramodal conflict processing in humans. Neuroscience Letters 332 (1), 25–28.
Wheale, J.L., 1981.The speed of response to synthesized voice messages. British Journal of Audiology 15 (3), 205–212.
Wickens, C.D., Rice, S., Keller, D., Hutchins, S., Hughes, J., Clayton, K., 2009.False alerts in air traffic control conflict alerting system: is there a “cry wolf” effect? Human Factors 51 (4), 446–462.
Yuval-Greenberg, S., Deouell, L.Y., 2009. The dog's meow: asymmetrical interaction in cross-modal object recognition. Experimental Brain Research 193 (4), 603–614. http://dx.doi.org/10.1007/s00221-008-1664-6.
Zouridakis, G., Simos, P., Papanicolaou, A., 1998.Multiple bilaterally asymmetric cortical sources account for the auditory N1m component. Brain Topography 10 (3), 183.