HAL Id: hal-02270767
https://hal.archives-ouvertes.fr/hal-02270767
Submitted on 3 Nov 2020
HAL is a multi-disciplinary open access
archive for the deposit and dissemination of
sci-entific research documents, whether they are
pub-lished or not. The documents may come from
teaching and research institutions in France or
abroad, or from public or private research centers.
L’archive ouverte pluridisciplinaire HAL, est
destinée au dépôt et à la diffusion de documents
scientifiques de niveau recherche, publiés ou non,
émanant des établissements d’enseignement et de
recherche français ou étrangers, des laboratoires
publics ou privés.
Revealing the Reactivity of the Iridium Trioxide
Intermediate for the Oxygen Evolution Reaction in
Acidic Media
Paul Pearce, Chunzhen Yang, Antonella Iadecola, Juan Rodríguez-Carvajal,
Gwenaelle Rousse, Rémi Dedryvère, Artem Abakumov, Domitille Giaume,
Michaël Deschamps, Jean-marie Tarascon, et al.
To cite this version:
Paul Pearce, Chunzhen Yang, Antonella Iadecola, Juan Rodríguez-Carvajal, Gwenaelle Rousse, et
al.. Revealing the Reactivity of the Iridium Trioxide Intermediate for the Oxygen Evolution Reaction
in Acidic Media. Chemistry of Materials, American Chemical Society, 2019, 31 (15), pp.5845-5855.
�10.1021/acs.chemmater.9b01976�. �hal-02270767�
doi.org/10.26434/chemrxiv.8040380.v1
Revealing the reactivity of the Iridium trioxide intermediate for the oxygen
evolution reaction in acidic media
Paul Pearce
,
Chunzhen Yang
, Antonella Iadecola, Juan Rodriguez-Carvajal, Gwenaëlle Rousse, Rémi
Dedryvère, Artem M. Abakumov, Domitille Giaume, Michael Deschamps, Jean-Marie Tarascon, Alexis
Grimaud
Submitted date:
25/04/2019
•
Posted date:
29/04/2019
Licence:
CC BY-NC-ND 4.0
Citation information:
Pearce, Paul; Yang, Chunzhen; Iadecola, Antonella; Rodriguez-Carvajal, Juan; Rousse,
Gwenaëlle; Dedryvère, Rémi; et al. (2019): Revealing the reactivity of the Iridium trioxide intermediate for the
oxygen evolution reaction in acidic media. ChemRxiv. Preprint.
We report a strategy to isolate IrO3 as an intermediate for the oxygen evolution reaction (OER). Its reactivity is
studied using X-ray absorption spectroscopy, X-ray and neutron diffraction and X-ray photoelectron
spectroscopy. Its stability is assessed by using on-line mass spectroscopy and inductively coupled plasma
optical emission spectroscopy and presented herein. Upon reaction with water in acidic conditions, we could
observe the formation of a new protonated iridate phase of composition H2IrO3. Coupling OER measurements
and dissolution rate determination, we could show that its activity and stability are governed by a yet
ill-described charge compensation mechanism enlisting reversible bulk proton insertion inside the catalyst
structure. This singular property enables an enhanced activity and stability towards dissolution compared to
the stellar IrOx/SrIrO3 catalyst. Such a finding opens the route towards the design of new OER catalysts
enlisting proton insertion that could be competitive for water splitting in acidic media.
File list
(2)
download file
view on ChemRxiv
Pearce et al - main - ChemRxiv.pdf
(1.48 MiB)
download file
view on ChemRxiv
1Chimie du Solide et de l’Energie, UMR 8260, Collège de France, 11 Place Marcelin Berthelot, 75231 Paris Cedex 05, France
2 Sorbonne Université, 4 place Jussieu, Paris, France 3
Réseau sur le Stockage Electrochimique de l’Energie (RS2E), CNRS FR 3459, 33 rue Saint Leu, 80039 Amiens Cedex, France
4Institut Laue-Langevin, 71 Avenue des Martyrs, CS 20156, 38042, Grenoble, Cedex 9, France.
5IPREM - UMR 5254 CNRS, Université de Pau et des Pays de l’Adour, Hélioparc, 2 Avenue Pierre Angot, 64053 Pau Cedex 9, France
6
Skoltech Center for Energy Science and Technology, Skolkovo Institute of Science and Technology, Moscow 121205, Russian Federation
7Paris Tech, PSL Research University, CNRS Institut de Recherche de Chimie-Paris (IRCP), 75005 Chimie-Paris, France
8CNRS, CEMHTI UPR3079, Universite d’Orleans, 1D avenue de la recherche scientifique, 45071 Orleans Cedex 2, France
9
ALISTORE-European Research Institute, FR CNRS 3104, 80039 Amiens, France #
Co-first authors
*Correspondence to: alexis.grimaud@college-de-france.fr
Revealing the reactivity of the Iridium trioxide intermediate for the oxygen
evolution reaction in acidic media
Paul E. Pearce,#1,2,3 Chunzhen Yang,#1,3 Antonella Iadecola,3 Juan Rodriguez-Carvajal,4 Gwenaëlle Rousse,1,2,3 Rémi Dedryvère,3,5 Artem M. Abakumov,6 Domitille Giaume,3,7 Michael Deschamps,3,8 Jean-Marie Tarascon1,2,3,9 and Alexis Grimaud*1,3
The development of efficient water splitting heterogeneous catalysts in acidic media is largely hampered by both the slow kinetics of the oxygen evolution reaction (OER) and the limited stability of the electrocatalyst under these harsh working conditions. At the origin of both the activity and the instability of iridium oxides used as OER catalysts in acid conditions is the formation of high valence IrOx intermediates such as IrO3. Nevertheless, owing to its reactivity with water, this intermediate was never stabilized and its electrochemical/chemical behavior was never studied in depth. Here we report a strategy to stabilize this elusive IrO3 intermediate. Furthermore, we demonstrate that upon reactivity with water, gaseous oxygen is generated while the intermediate is protonated following the reaction IrO3 + x H2O → H2xIrO3 + x/2 O2. The resulting hydrated iridium oxide H2IrO3 which possesses three dimensional proton intercalation/de-intercalation channels can be considered as an enlightening OER model electrocatalyst in acidic media. Owing to its unique proton insertion ability, we could study a yet ill-described charge compensation mechanism upon OER relying on the bulk reversible exchange of protons, which shows remarkable performances and stability. Indeed, enhanced OER is measured, with a dissolution rate lower than the one measured for the “stellar” IrOx/SrIrO3 catalyst. Such a finding opens the route towards the design of new catalysts enlisting proton insertion that could be competitive for water splitting in acidic media.
Introduction
Water splitting, the reaction which is at the heart of electrolyzers, plays a key role in renewable energy technologies,1,2 but the slow kinetics of the anodic oxygen evolution reaction (OER) largely limits the performances achieved by such energy storage device.3,4 Although various transition metal-based oxides and oxyhydroxides have been developed as efficient electrocatalysts for the OER in neutral and alkaline pH,5–10 these catalysts seriously corrode in acidic solutions.11–14 Hence, to date, iridium oxide (IrOx) and ruthenium oxide (RuOx) electrocatalysts are widely considered as the best catalysts to work in these harsh conditions.15–18 However, they still suffer from substantial dissolution and surface instabilities, making them poor choices for long-term use.11,19,20 This calls for the rationalization of the science at play in order to develop new strategies targeting high activity, long-term stability and limited metal dissolution in acidic media.
Indeed, most materials explored so far as water oxidation electrocatalysts in acidic environment such as Au, IrO2, RuO2 or perovskite materials, have demonstrated instability and the formation of an amorphous hydrated MOx surface layer after prolonged OER tests.21–29 This phenomenon, which is sometimes referred to as self-passivation, is accompanied by cation dissolution.12,30 Hence, to suppress the dissolution of precious metals such as Ir, a promising strategy previously investigated is to develop a durable protective surface layer with the formation of a hydrated IrOx layer. For example, in a co-catalyst system (IrNiOx), Ni was adopted as a sacrificial metal to be selectively dissolved from the matrix and form an amorphous IrOx surface layer.31–33 In another catalyst, namely SrIrO3 with the perovskite structure, Sr2+ was selectively dissolved during an activation step thus triggering the formation of a core-shell IrOx/SrIrO3 structure.34
At the origin of this phenomenon, recent studies revealed the existence of a common intermediate responsible for both the enhanced OER activity for iridium-based catalysts as well as their relative instability: high valence IrO3 formed upon deprotonation/oxidation and which possesses electrophilic oxygen serving as active sites for water to react.35–39 These electrophilic oxygen species are highly reactive and undergo nucleophilic attack from water to form O-O bonds, step usually considered as the rate limiting one for OER catalysts.40 Therefore, their formation was proposed to be at the origin for the high OER activity measured for hydrated iridium oxide surfaces. Nevertheless, increasing the surface reactivity of oxygen ligands towards water leads to oxygen vacancies formation on the surface of the catalyst and a decrease in the coordination number of the surface transition metals, hence promoting their dissolution into the electrolyte presumably into the form of IrO42- species.36,41,42 Thus, owing to the
2
reactivity of this high valence IrO3 intermediate with water, it could never be isolated and its electrochemical properties studied independently, preventing us from designing new approaches in order to control its activity and stability.
In this work, we have designed a strategy in order to stabilize the IrO3 intermediate and to study its chemical reactivity. For that, the β-Li2IrO3 compound previously described as a model Li-ion battery electrode material43 was used as a precursor. Electrochemical oxidation/delithiation was then carried out in organic solvent to isolate the fully delithiated β-IrO3 phase, allowing us to study for the first time its chemical reactivity with water as well as its stability. Finally, we demonstrate that a hydrated iridate catalyst (β-H2IrO3) is eventually formed upon reaction of β-IrO3 with water, which upon bulk proton de-intercalation triggers the oxygen redox activity of the catalyst, thus reforming electrophilic oxygens which chemically react with water. This new finding helps us unravel the complex OER mechanisms44 for the yet ill-understood amorphous hydrated IrOx surface layers.
Results and discussion
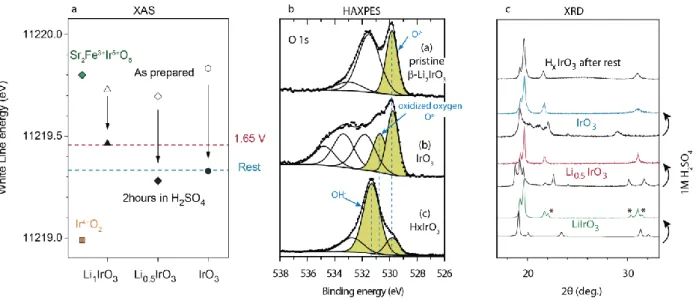
We first prepared different iridium oxide intermediates β– LiyIrO3 (with y being 1, 0.5 and 0) by the electrochemical delithiation of β–Li2IrO3 in Li-ion half-cells. Indeed, this electrochemical preparation was conducted in organic electrolytes containing no water thus allowing for the formation of these intermediates that could never be stabilized in aqueous conditions. The Ir oxidation states of these phases was first studied by ex situ X-ray absorption spectroscopy (XAS) at the Ir L3-edge (Figure 1a). While an increase of the white line (WL) energy would indicate the oxidation of iridium upon delithiation, as expected for a classical oxidation event counterbalanced by a cationic redox active center, we instead observed no increase of the WL energy which stays close to the one of Sr2FeIrO6 used as Ir5+ reference.42 These XAS measurements at the Ir L-edge were
then complemented by ex situ O 1s X-ray photoelectron (XPS) measurements (Figure 1b) which show, in agreement with previous operando results for IrOx catalysts,37 the formation of oxidized “On-“ species after complete delithiation and the formation of β-IrO3. These results indicate that the oxidation of β–Li2IrO3 is counter-balanced by the redox activity of the oxygen ligand and the oxidation of O2- to “On-“ species for β– LiyIrO3 with y ≤ 1, following the so-called anionic redox mechanism.43 We can therefore confirm that the oxidation of the β–Li2IrO3 precursor leads to the formation of electrophilic oxygen species.
The reactivity of the different intermediates β–LiyIrO3 (with y = 1, 0.5 and 0) with water was then studied upon exposure to a degassed 1M H2SO4 solution. Analyzing the exposed samples by X-ray diffraction (XRD) (Figure 1c), β-IrO3 and β-Li0.5IrO3 are found to be fully transformed into a new phase. Concomitantly, similar energies of the WL at the Ir L3-edge and therefore similar oxidation states comprised between Ir5+ and Ir4+ (Ir4+O2) were found by XAS after exposure to H2SO4 for these two samples (Figure 1a), indicative of their spontaneous reduction when in contact with acidic media. Furthermore, this chemical reactivity is dependent on the oxidation state of the catalyst and β-Li1IrO3 was found by XRD to be only partially transformed into this new phase (Figure 1c) while its oxidation state was found greater than the one measured for β-IrO3 and β-Li0.5IrO3 after soaking (Figure 1a). Finally, XPS analysis shows after reacting β-IrO3 with H2SO4 the apparition of a new O 1s peak at 531.4 eV which corresponds to the formation of OH -species (Figure 1b).37,41,45 Note that the O/Ir ratio is constant for β-Li2IrO3, β-IrO3 and β-IrO3 exposed to H2SO4 if we take into account only the colored O 1s components, which proves that these colored components are due to oxygen atoms bound to iridium while the others are surface species. Therefore, while the presence of residual On- oxygen cannot be excluded in β-IrO3 after exposure to H2SO4 due to energy resolution of the spectrum, their overall weight has largely decreased upon reduction, suggesting their participation to the charge balance process.
3 While the oxidized active form of the catalyst is reduced in
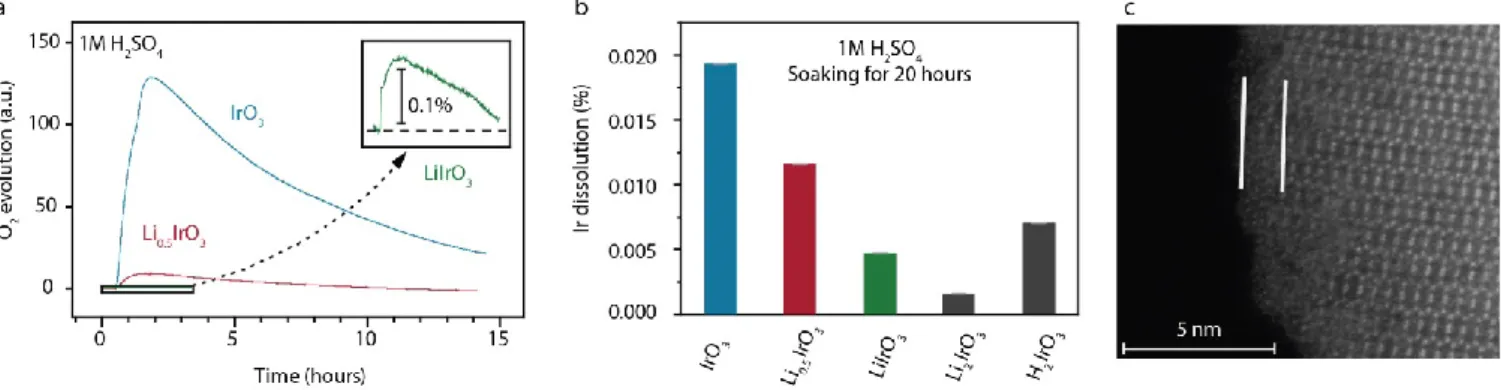
contact with acid, we could demonstrate using online mass spectrometry (OMS) that this reduction is concomitant with the oxidation of water. Indeed, when exposing β-IrO3 and β-Li0.5IrO3 to 1M H2SO4, gaseous oxygen is found to be chemically evolved (Figure 2a). Interestingly, the amount of oxygen evolved is dependent on the oxidation state of the iridium oxide, with the more oxidized form of the catalyst (β-IrO3) generating the most oxygen. Almost no oxygen is evolved when exposing β-Li1IrO3 to H2SO4. This observation can be rationalized when observing that the redox potentials for the formation of β-IrO3 and β-Li0.5IrO3 (respectively 4.55 and 4.4 V vs. Li+/Li) are above the reversible potential for water oxidation at pH 0 (4.27 V vs. Li+/Li, Figure S1). In contrast, the redox potential for β-Li1IrO3 is below the OER potential at pH 0 (3.4 V vs. Li+/Li, Figure S1) and therefore it does not chemically oxidize water. Hence, β-IrO3 and β-Li0.5IrO3 are unstable in acidic conditions, therefore acting as an oxidizing agent while H2O acts as a reducing agent, giving the overall reaction: IrO3 + H2O H2IrO3 + ½ O2 (see discussion below for the formation of H2IrO3). The amount of oxygen generated during this chemical redox reaction is governed by the oxidizing power of the iridium oxide, which is function of the oxidation state and the concentration of active form of the catalyst itself given by the amount of protons in the phase. In other words, the difference between the redox potential of the iridium oxide and E(O2/H2O) acts as the driving force for the water oxidation. Bearing in mind that electrophilic “On-” oxygen species were previously reported to be responsible for both the activity and the instability of Ir-based oxides used as OER catalysts,25,37 we then measured by inductively coupled plasma - optical emission spectrometry (ICP-OES) the amount of
Ir-leached out during the chemical reactivity of each intermediate with a solution of 1 M H2SO4 (Figure 2b). For the pristine β-Li2IrO3 compound, a negligible amount of Ir was found leached out during soaking in acid and this amount is found to increase when oxidizing the material from β-Li2IrO3 to β-IrO3. Hence, combining these results with the OMS results previously discussed, we can confirm that the formation of electrophilic “On-“ oxygen species results in an increased reactivity of the surface and the dissolution of iridium. Moreover, we could relate this iridium dissolution to the surface instability often observed on the surface of crystalline iridium-based oxides using high resolution transmission electron microscopy (HR-TEM). Indeed, the HRTEM images of β-IrO3 exposed to a 1M H2SO4 solution revealed the presence of a thin amorphous surface layer (Figure 2c). In summary, electrophilic “On-“ oxygen species are formed by the electrochemical oxidation of the iridium oxide catalyst before being consumed by the chemical reaction with H2O, leading to the formation of hydroxyl groups, as observed by XPS (Figure 1b). This protonation reduces the oxidation state of the iridium oxide and reduces the dissolution of iridium, as the ICP-OES results reveal when comparing the dissolution rate found for β-IrO3 and β-H2IrO3 (Figure 2b).
In order to better understand the bulk phase transformation previously spotted by ex situ XRD (Figure 2c), operando XAS and XRD measurements were employed to monitor the electrochemical oxidation of β-Li2IrO3 in 1M H2SO4. Starting from β–Li2IrO3, several redox processes can be observed below the OER potential (below ≈ 1.55 V vs. RHE, Figure 3a). A chemometric approach based on Principal Component Analysis (PCA) and Multivariate Curve Resolution Alternating Least Squares (MCR-ALS)46,47 was applied to the whole XAS data collected during the anodic scan (Figure 3b,
Figure 1Chemical reactivity of oxidized β-Li2IrO3 with acid. a) Evolution of the WL energy position of the Ir L3-edge XAS for the different compounds before (open symbols) and
after acid treatment (filled symbols). IrO2 (orange square) and Sr2FeIrO6 (green diamond) are shown as references for Ir+IV and Ir+V, respectively. b) O 1s X-ray photoelectron spectra
with the pristine β-Li2IrO3 phase (top), the fully delithiated IrO3 phase (middle) and IrO3 after exposure to 1M H2SO4 solution (bottom). The stars indicate surface adsorbed or
deposited species. Colored areas indicate oxygen atoms bound to iridium. In order to decrease the intensity of surface components, spectrum (b) was recorded with 6900 eV photon energy on the GALAXIES beamline at the SOLEIL synchrotron (multiplying the probe depth by 4.5). Other spectra were recorded with 1487 eV (standard XPS). c) XRD
4
middle). Four components are necessary in order to fully describe the oxidation process as suggested by PCA; the evolution of their concentration profiles was obtained by MCR-ALS method and is given in Figure 3b. First, the pristine β-Li2IrO3 phase disappears below 1.4 V vs. RHE while a second component appears. This second component then disappears between 1.4 and 1.65 V vs. RHE where a third one grows. Finally, when holding the electrode at 1.65 V for an hour, a fourth and final component is completely formed. Since no appropriate XAS references were found to assign these phases, operando XRD was then performed under the same conditions (Figure 3b, right). Analyzing the structural modifications, the second phase can be attributed to the partially delithiated β– Li1IrO3 phase, while the third phase does not correspond to the β–Li0.5IrO3 normally formed when oxidizing β–Li1IrO3 in organic electrolyte.43 Finally, a final phase grows when holding the electrode at 1.65 V vs. RHE. During the second anodic scan, the oxidation events previously observed below the OER potential are drastically modified while the OER activity is found stable (Figure 3a), indicating that a stable regime is reached. Overall, this investigation confirms that the high valence IrO3 intermediate cannot be isolated in aqueous solution and reveals that the whole bulk of β–LiyIrO3 is transformed concomitantly with the OER process.
To single out the phase newly formed by reaction of delithiated β-LiyIrO3 (y ≤ 0.5) with acid, β-Li2IrO3 was reacted under hydrothermal conditions in 1 M H2SO4 at 120°C (see methods). Doing so, a phase with a similar XRD pattern when compared to the phase previously observed after reaction of β-LiyIrO3 (y ≤ 0.5) with acid (Figure 1c and Figure 3b) is formed, confirming that both reaction pathways lead to the formation of a similar phase. The structure of the as-synthetized compound was first refined by synchrotron XRD and found to possess a 3D β-IrO3 scaffold with the Fddd space group similar to its lithium parent phase43 (Figure 4a and 4b and Table S1 of the supplementary information). In order to determine the chemical composition of the as-prepared phase, thermogravimetric analysis (TGA) was carried out, in which two significant mass losses can be observed (Figure 4d). The first process starting at around 300°C is associated with a 7.3 w% loss. Coupling TGA with mass spectrometry, this loss could be attributed to the removal of H2O and the formation of IrO2, as deduced by ex situ XRD (Figure 4e). Starting at 900°C, a second mass loss (≈ 13 w%) corresponding to the release of O2 and the formation of metallic Ir is observed. From these measurements, the composition for the newly formed phase
can be determined to be β-H2IrO3 and the presence of protons in the bulk of the phase was further confirmed by 1H solid state nuclear magnetic measurements (Figure S2). Finally, the positions of structural protons were determined by refining the neutron powder diffraction (NPD) pattern using the Rietveld method (Figure 4c and Table S2). Two different positions were found: one forming hydroxyl groups with an O-H bond length of 1.091(6) Å and the other forming O-H2O groups with an O-H bond length of 1.043(11) Å and an H-O-H angle of 103.3(6)°, close to that of free water (Figure 4f).
Having established that β-LixIrO3 transforms into a new protonated phase β-H2IrO3 during oxidation in acidic conditions, the question then arises regarding the redox and structural activity of this protonated phase during OER. To track down the structural evolution of the β-H2IrO3 phase upon OER, operando XRD was carried out during the anodic scan in 1
Figure 2 Chemical reactivity of different oxidized β-Li2IrO3 intermediates with acid. a) On-line mass spectrometry for β-IrO3, β-Li0.5IrO3 and β-LiIrO3 upon chemical exposure to 1M
H2SO4. b) Ir dissolution measured by ICP-OES after soaking the different intermediate phases in a solution of 1M H2SO4. c) HAADF-STEM image along the [110] zone axis of the
resulting protonated iridate phase.
Figure 3a) Cyclic voltammetry for the β-Li2IrO3 in 1 M H2SO4 (orange) with subsequent
anodic scan (blue) compared to the cyclic voltammogram of the β-H2IrO3 catalyst (red).
(b) Electrochemical profile during anodic scan starting from β-Li2IrO3 (left),
concentration profiles from the chemometric approach on the operando XAS data (center) and the operando XRD under the same conditions (right).
5 M H2SO4 solution (Figure 5a and b). Scanning from the OCV to
1.65 V vs. RHE at 0.2 mV/s, no drastic structural evolution is observed with the exception of a slight shift of the (004) Bragg diffraction peak to lower angle. This is consistent with the low amount of protons extracted during the three redox processes below the OER region (See calculation in Figure S3). Nevertheless, when holding the potential in the OER region at 1.65 V vs. RHE over 30 minutes, a structural change occurs with the disappearance of the (004) Bragg peak at 19.3° concomitant with the apparition of a new peak at higher angle (≈19.45°) (arrows in Figure 5b) and a shift of the main (111) diffraction peak to greater angle. This new phase can be described in the same space group as the pristine β–H2IrO3, with nevertheless a modification of the lattice parameters and especially a reduction of the c parameter from 18.523(2) Å to 18.403(3) Å. This observation implies that a structural transformation happens upon the course of the anodic process and shows that the deprotonation/oxidation process occurs during oxidation not only on the surface but also in the bulk of the hydrated Ir oxide phase.
Operando XAS measurements at the Ir L3-edge using an
operando cell shown in Figure S4, were then performed to track down changes in bulk oxidation state of the protonated iridium catalyst during OER (Figure 5c and d). The experiment consists in stepping every five minutes the potential from open circuit voltage (OCV) to 1.65 V vs. RHE while monitoring for each step changes of the WL energy for the Ir L3-edge (see the full cycle and XANES data in Figure S5). During this procedure, a shift of the WL position at higher energy is observed, indicative of the bulk oxidation of the phase all along the pre-OER region as well as when entering into the pre-OER potential. Nevertheless, when resting the catalyst at the end of the anodic scan at 1.65 V vs. RHE, not only is the potential found to decay towards a value close to 1.3 V vs. RHE, but a continuous and slight shift of the WL towards lower energy is recorded. This behavior is indicative of the reactivity of the intermediate phase generated at high potential (1.65 V vs. RHE) during OER which is slowly reduced when left in contact with the acidic solution via either proton insertion or decomposition, the former being the most likely owing to the evidences of structural transition as demonstrated below.
These two measurements demonstrate that while the amorphous layer formed on the surface of β-H2IrO3 is presumably responsible for the electrocatalytic behavior of this new catalyst (Figure 2c), the bulk participates to the overall charge balance process. Indeed, the β-H2IrO3 phase is gradually deprotonated and oxidized before to reach the OER potential. In fact, our operando measurements reveal that the bulk participates to the overall charge balance upon OER with proton diffusing in and out of the phase to counter balance the reactivity of the surface with water in acidic conditions. 80 85 90 95 100 0 400 800 1E-11 1E-10 1E-9 20 30 40 50 60 70 20 40 60 80 100 120 140 7.3% M a ss loss (% ) < 1% 13.3% QM ID ( A ) m/z = 32 [O2+] Temperature (°C) m/z = 18 [H2O+] f c e b d 1.091 Å 1.043 Å Ir IrO2 RT 2 (°, Cu K) H2IrO3 1000°C 700°C 103.3° a a = 5.40106(12) Å b = 9.0442(2) Å c = 18.4976(4) Å 2 (deg.) - = 1.542 Å Neutron diffraction DxIrO3 - F d d d 5 10 15 20 a = 5.39605(7) Å b = 9.07170(16) Å c = 18.5488(2) Å Synchrotron XRD H2IrO3 - F d d d 2 (deg.) - = 0.413 Å
Figure 4 Crystallographic structure of the β-H2IrO3 catalyst. (a) Rietveld refinement of
synchrotron XRD data for β-H2IrO3 with in red the experimental points, in black the
calculated pattern, in blue the difference between observed and calculated and the blue ticks are the Bragg reflections. (b) View of the structure along the [110] axis. (c)
Rietveld refinement of the neutron powder diffraction data of β-H2IrO3 with in red the
experimental points, in black the calculated pattern, in blue the difference between observed and calculated and the blue ticks are the Bragg reflections. (d) Thermogravimetric analysis with mass spectrometry data during TGA showing the
evolution of m/z = 18 and 32 corresponding to H2O (orange) and O2 (blue) respectively.
(e) X-ray diffraction patterns of β-H2IrO3 pristine (in black), after heating to 700°C
under Ar (in orange) and after heating to 1000°C under Ar (in blue). (f) A close up view
of an IrO6 octahedra with the two proton positions (H1 in blue and H2 in green).
Figure 5 Oxidation process for β-H2IrO3. a) time dependence and b) structural evolution
as characterized by operando XRD during OER with corresponding electrochemical curve t = f(I). c) Applied potential steps during XAS measurement starting at OCV.The first three steps correspond to the redox peak potentials and from 1.4 V to 1.65 V, the steps are evenly spaced by 50 mV. d) The evolution of the WL energy position of the Ir
6
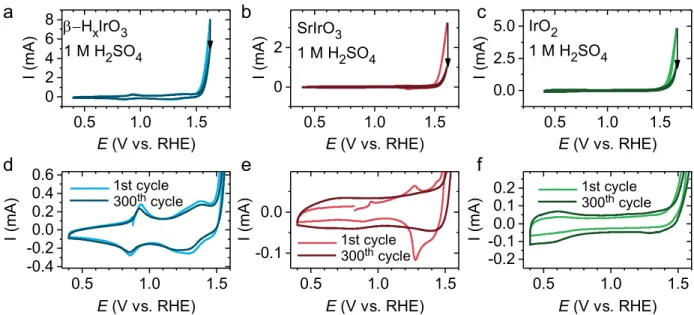
Having determined that structural protons are reversibly exchanged between β-H2IrO3 and the electrolyte during 1) the pre-activation step consisting of the deprotonation of the catalyst and 2) the chemical reaction of the active form of the catalyst with water, the electrochemical OER activity of β-H2IrO3 was then compared with the state-of-the-art IrO2 and IrOx/SrIrO3 electrocatalysts (Figure 6a and b). When normalized by the oxide surface area, the β-H2IrO3 demonstrates a large OER activity with an overpotential as low as ~345 mV at a current density of 10 mA/cm2oxide in 1.0 M H2SO4 (see BET results in Table S3). These metrics outperform the ones measured for micron- (this work, Figure 6b) and nano-sized IrO2 15 as well as for La2LiIrO6 35 or Ba2PrIrO6 48 perovskites and nearly approach the initial activity of today’s “stellar” IrOx/SrIrO3 catalyst. This is well in line with previous attributions of high activity to surface Iridium hydroxide species.26,49 We should however note that in its powder form, IrOx/SrIrO3 catalyst quickly deactivates and finally β–H2IrO3, which activity remains relatively stable upon cycling, is found to possess a slightly better OER activity after 300 cycles (Figure 6b). Moreover, when normalized by the mass of iridium, β-H2IrO3 shows better OER performances than IrOx/SrIrO3, making this phase very promising as OER catalyst in acidic conditions.
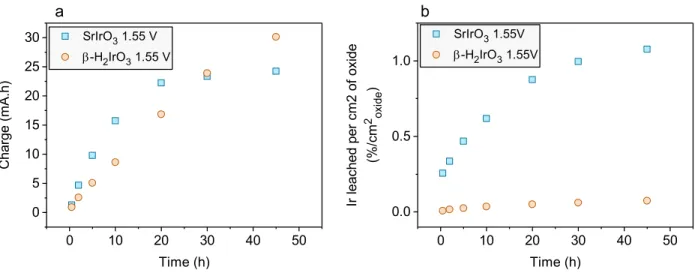
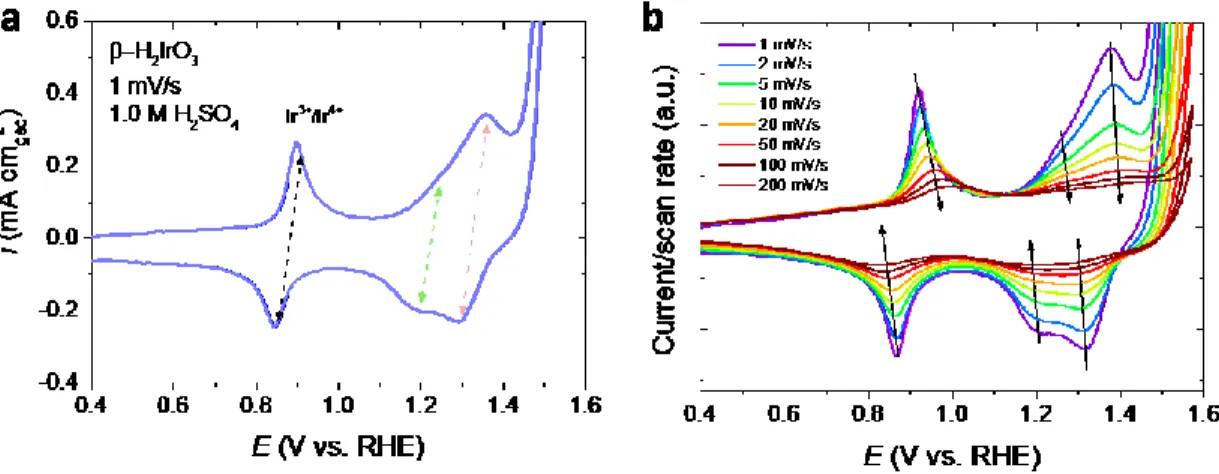
To assess the electrochemical stability of the β-H2IrO3 catalyst, ICP-OES measurements were performed over 50 h at a constant potential of 1.55 V vs RHE and the results are compared with IrOx/SrIrO3 (Figure 6c). Interestingly, the dissolution rate is found drastically reduced for β-H2IrO3 when compared to IrOx/SrIrO3. Indeed, less than 0.2 % Ir was found dissolved after 50 hours, while ≈ 0.45 % Ir were detected in solution for IrOx/SrIrO3. This relative stability is further illustrated by the retained electrochemical signature for the potentials below the OER in which three reversible redox peaks at 0.9 V, 1.25 V and 1.35 V vs. RHE corresponding to the bulk oxidation/deprotonation previously discussed are observed (Figure 6d and Figure S7). Such observation indicates that the bulk retains its proton exchange properties and that no significant increase of the active surface area or obvious modification of the surface chemistry occurs upon cycling (Figure 6d). This is in direct contrast with previous reports correlating the changes in the capacitive signature of transition metal oxides to surface modifications.50 Furthermore, the amorphous layer formed on the surface of the particles during the initial protonation (Figure 2c) shows little to no thickness increase during OER, even after 300 CV cycles as evidenced by HAADF-STEM images of ex situ samples (Figure S8). Overall, this low dissolution rate and limited surface reconstruction is quite surprising considering the high surface area which, intuitively, should show opposite trends. On the other hand, SrIrO3 initially displays several sharp redox peaks below 1.5 V, presumably related to a dissolution/re-precipitation process, which quickly disappear after a few cycles to leave only a capacitive current corresponding to the signature of the IrOx shell (Figure S7).
Altogether, these results highlight that during the OER the bulk of the protonated iridium oxide catalyst is involved into a reversible charge balance process. Indeed, upon anodic polarization corresponding to the OER conditions, the protonated iridium oxide is oxidized (deprotonated), as we
uncovered by bulk sensitive operando XAS (Figure 5d). The de-intercalation of protons from the bulk of the particles raises the redox potential of the catalyst above the one of water, thus creating a driving force for the surface to react with water. As we previously described, this 3D iridium oxide possesses an electronic structure in which non-bonding O 2p levels are redox active and account for the charge balance upon delithiation for y ≤ 1.5 in β-AyIrO3.
43
Hence, upon oxidation electrophilic oxygen are created and serve as active sites for water oxidation, in agreement with previous results.25,37,51 Second, upon reactivity with water, proton intercalate from the solution into the bulk of β-HyIrO3 (Figure 5b); this charge balance mechanism helps stabilizing the catalyst and reduces the dissolution of iridium when compared to other iridium based oxides.
While we uncovered this mechanism for the β-H2IrO3 protonated catalyst, it is worth mentioning that this result is in line with observations previously made for state-of-the-art protonated IrOx catalysts or for more complex oxides such as perovskites. Indeed, Minguzzi et al. previously observed by
operando XAS for IrOx a first oxidation event up to Ir5+ prior to
reaching the OER potential, followed by a reduction of iridium when reaching a potential at which oxygen is generated in acidic environment.52 Similar reduction of the iridium oxidation state below 4+ was also observed after the OER for La2LiIrO6, this reduction being accompanied by the formation of IrOx-type particles.
35
Nevertheless, observations of this process was so far limited to surfaces while we found for β-H2IrO3 that when extended to the bulk of the particle it allows for stabilizing the catalyst in these strongly acidic conditions. Finally, this behavior contrasts with the one observed for the thermally prepared IrO2 catalyst which is found more stable but less active than its protonated IrOx counterpart.
53
Therefore, designing compounds with the ability to reversibly exchange protons can play a pivotal role in the development of active and stable OER catalysts in acid media. Nevertheless, the redox peaks observed for the initial delithiation of β–Li2IrO3 show greater intensities than those Figure 6 Comparison of the OER activities and stabilities in acid. (a) Cyclic
voltammograms of IrO2, β-H2IrO3 and SrIrO3 in 1M H2SO4 solution using a rotating disk
electrode. (b) Tafel plots of various electrocatalysts in acid media. (c) Ir dissolution
upon time normalized by the oxide surface area as measured by ICP-OES for β–H2IrO3,
SrIrO3, IrO2. (d) Enlarged CV curves depicting the evolution of capacitance regions for
β–H2IrO3 (blue) and SrIrO3 from this study (red) cycled in 1.0 M H2SO4 acidic solution for
300 cycles (~20 hours) at a scan rate of 10 mV/s (1st cycle in solid line and 300th cycle in
7 measured for the protonated β–H2IrO3 phase which
correspond to the deprotonation of 10% of the catalyst (Figure 3a). This observation suggests that while sufficient to stabilize the mechanism and avoid iridium dissolution, the proton diffusion in this 3D oxide framework is rather slow when compared to the lithium diffusion. This is confirmed by 7Li and 1
H NMR spectroscopy which shows fast exchange between the two Li sites while the chemical exchange between some protons sites were found extremely slow (Figure S2 and S9). With this in mind, strategies can be envisioned in order to design oxides with an enhanced proton affinity for OER active surfaces. The first one is the partial substitution of iridium (or ruthenium) by less electronegative 3d transition metals to create two populations of oxygen: 1) the oxygen ions covalently bonded to iridium and serving as OER active sites and 2) the oxygen ions more ionically bonded to metal cations such as titanium or vanadium and thus more basic, i.e. prone to protonation. Bearing in mind that, following the proposed mechanism, two protons must be exchanged per Ir in order to preserve the charge neutrality of the oxide catalyst upon chemical OER, bulk diffusion such as the one found for the β-H2IrO3 phase should be privileged compared to surface protonation which would certainly limit both the activity and the stability of the catalyst. Hence, the wise selection of transition metal cations will not be sufficient and it must be coupled with the use of adapted crystallographic structures in order to stabilize this mechanism.
Conclusions
In summary, we have confirmed by the isolation of the β-IrO3 intermediate that the formation of high valence iridium oxide intermediate is responsible for the high activity of iridium-based catalysts, as well as their limited stability. Coupling XAS and XPS spectroscopic tools, we observed that this activity/stability relationship is correlated with the formation of electrophilic “On-“ oxygen species which chemically react with water to generate gaseous oxygen, while being prone to dissolution, in agreement with previous discussions.35,25,36,37 Coupling these measurements with structural refinement, we demonstrated that upon chemical reactivity with water, protons are inserted into the structure of this intermediate to form a new protonated phase following the overall reaction IrO3 + H2O H2IrO3 + ½ O2. We could further demonstrate that the bulk of this protonated phase is then redox active upon OER and that protons are continuously exchanged with the solution, thus regenerating the catalyst and keeping its chemical integrity. Furthermore, this ability for the catalyst to accept protons by bulk insertion limits the dissolution of iridium cations which is usually encountered at high potential for iridium oxide OER catalysts. Finally, we believe that this discovery opens up new avenues for designing better and more stable OER catalysts for acidic environment by controlling 1) the protonation state of oxygen through a fine tuning of the iono-covalency of the metal-oxygen bond and 2) the bulk proton diffusivity with a wise choice of crystallographic structures.
Conflicts of interest
There are no conflicts to declare.
Acknowledgements
The authors would like to extend their appreciation to Manel Ben Osman for the BET measurements and to Christel Laberty for her cooperation. The authors would like to express their gratitude to Camille Douard, Fanch Guillou and Thierry Brousse from the Institut des matériaux Jean Rouxel in Nantes, France, for lending us the operando XAS cell used for this study. The authors would also like to thank Matthieu Courty from the Laboratoire de réactivité et chimie des solides in Amiens, France, for carrying out the TGA-MS measurements. This work is based on experiments performed on the D20 neutron diffractometer at the Institut Laue Langevin, Grenoble, France and on the ROCK beamline at Soleil synchrotron, France. J.-M.T. acknowledges funding from the European Research Council (ERC) (FP/2014)/ERC Grant-Project 670116-ARPEMA. The authors thank Stéphanie Belin for her assistance during beamtime at the ROCK beamline (financed by the French National Research Agency (ANR) as a part of the “Investissements d’Avenir” program, reference: ANR-10- EQPX-45; Rapid Access #20180904) and James Ablett and Jean-Pascal Rueff for their assistance during the HAXPES experiments on the GALAXIES beamline, SOLEIL Synchrotron, France. A.G. acknowledges financial support from the ANR MIDWAY (Project ID: ANR-17-CE05-0008).
Notes and references
1 N. S. Lewis and D. G. Nocera, Proc. Natl. Acad. Sci., 2006,
103, 15729–15735.
2 V. R. Stamenkovic, D. Strmcnik, P. P. Lopes and N. M. Markovic, Nat. Mater., 2017, 16, 57–69.
3 W. T. Hong, M. Risch, K. A. Stoerzinger, A. Grimaud, J. Suntivich and Y. Shao-Horn, Energy Environ. Sci., 2015, 8, 1404– 1427.
4 J. H. Montoya, L. C. Seitz, P. Chakthranont, A. Vojvodic, T. F. Jaramillo and J. K. Nørskov, Nat. Mater., 2017, 16, 70–81. 5 M. W. Kanan and D. G. Nocera, Science, 2008, 321, 1072– 1075.
6 A. Grimaud, K. J. May, C. E. Carlton, Y.-L. Lee, M. Risch, W. T. Hong, J. Zhou and Y. Shao-Horn, Nat. Commun., 2013, 4, 2439. 7 J. Suntivich, K. J. May, H. A. Gasteiger, J. B. Goodenough and Y. Shao-Horn, Science, 2011, 334, 1383–1385.
8 J. T. Mefford, X. Rong, A. M. Abakumov, W. G. Hardin, S. Dai, A. M. Kolpak, K. P. Johnston and K. J. Stevenson, Nat. Commun., 2016, 7, 11053.
9 E. Fabbri, A. Habereder, K. Waltar, R. Kötz and T. J. Schmidt, Catal. Sci. Technol., 2014, 4, 3800–3821.
10 E. Fabbri, M. Nachtegaal, T. Binninger, X. Cheng, B.-J. Kim, J. Durst, F. Bozza, T. Graule, R. Schäublin, L. Wiles, M. Pertoso, N. Danilovic, K. E. Ayers and T. J. Schmidt, Nat. Mater., 2017, 16, 925–931.
11 S. Cherevko, A. R. Zeradjanin, A. A. Topalov, N. Kulyk, I. Katsounaros and K. J. J. Mayrhofer, ChemCatChem, 2014, 6, 2219–2223.
12 S. Geiger, O. Kasian, M. Ledendecker, E. Pizzutilo, A. M. Mingers, W. T. Fu, O. Diaz-Morales, Z. Li, T. Oellers, L. Fruchter,
8
A. Ludwig, K. J. J. Mayrhofer, M. T. M. Koper and S. Cherevko, Nature Catalysis, 2018, 1, 508–515.
13 M. Pourbaix, Atlas of Electrochemical Equilibria in Aqueous Solutions, National Association of Corrosion Engineers, 1974. 14 J. W. D. Ng, M. García-Melchor, M. Bajdich, P. Chakthranont, C. Kirk, A. Vojvodic and T. F. Jaramillo, Nat. Energy, 2016, 1, 16053.
15 Y. Lee, J. Suntivich, K. J. May, E. E. Perry and Y. Shao-Horn, J. Phys. Chem. Lett., 2012, 3, 399–404.
16 P. Lettenmeier, L. Wang, U. Golla-Schindler, P. Gazdzicki, N. A. Cañas, M. Handl, R. Hiesgen, S. S. Hosseiny, A. S. Gago and K. A. Friedrich, Angew. Chem., 2016, 128, 752–756.
17 T. Reier, H. N. Nong, D. Teschner, R. Schlögl and P. Strasser, Adv. Energy Mater., 2017, 7, 1601275.
18 R. R. Rao, M. J. Kolb, N. B. Halck, A. F. Pedersen, A. Mehta, H. You, K. A. Stoerzinger, Z. Feng, H. A. Hansen, H. Zhou, L. Giordano, J. Rossmeisl, T. Vegge, I. Chorkendorff, I. E. L. Stephens and Y. Shao-Horn, Energy Environ. Sci., 2017, 10, 2626– 2637.
19 C. Spöri, J. T. H. Kwan, A. Bonakdarpour, D. P. Wilkinson and P. Strasser, Angew. Chem., Int. Ed. Engl., 2017, 56, 5994–6021. 20 P. Jovanovič, N. Hodnik, F. Ruiz-Zepeda, I. Arčon, B. Jozinović, M. Zorko, M. Bele, M. Šala, V. S. Šelih, S. Hočevar and M. Gaberšček, Journal of the American Chemical Society, 2017, 139, 12837–12846.
21 A. Grimaud, A. Demortière, M. Saubanère, W. Dachraoui, M. Duchamp, M.-L. Doublet and J.-M. Tarascon, Nat. Energy, 2016,
2, 16189.
22 T. Li, O. Kasian, S. Cherevko, S. Zhang, S. Geiger, C. Scheu, P. Felfer, D. Raabe, B. Gault and K. J. J. Mayrhofer, Nat. Catalysis, 2018, 1, 300–305.
23 O. Diaz-Morales, F. Calle-Vallejo, C. de Munck and M. T. M. Koper, Chem. Sci., 2013, 4, 2334.
24 M. Wohlfahrt-Mehrens and J. Heitbaum, J. Electroanal. Chem. Interfacial Electrochem., 1987, 237, 251–260.
25 V. Pfeifer, T. E. Jones, J. J. Velasco Vélez, R. Arrigo, S. Piccinin, M. Hävecker, A. Knop-Gericke and R. Schlögl, Chem. Sci., 2017, 8, 2143–2149.
26 D. F. Abbott, D. Lebedev, K. Waltar, M. Povia, M. Nachtegaal, E. Fabbri, C. Copéret and T. J. Schmidt, Chem. Mater., 2016, 28, 6591–6604.
27 A. Minguzzi, C. Locatelli, O. Lugaresi, E. Achilli, G. Cappelletti, M. Scavini, M. Coduri, P. Masala, B. Sacchi, A. Vertova, P. Ghigna and S. Rondinini, ACS Catal., 2015, 5, 5104–5115.
28 D. Weber, L. M. Schoop, D. Wurmbrand, S. Laha, F. Podjaski, V. Duppel, K. Müller, U. Starke and B. V. Lotsch, Journal of Materials Chemistry A, 2018, 6, 21558–21566.
29 K. Klyukin, A. Zagalskaya and V. Alexandrov, The Journal of Physical Chemistry C, 2018, 122, 29350–29358.
30 C. Costentin and D. G. Nocera, Proc. Natl. Acad. Sci., 2017,
114, 13380–13384.
31 T. Reier, Z. Pawolek, S. Cherevko, M. Bruns, T. Jones, D. Teschner, S. Selve, A. Bergmann, H. N. Nong, R. Schlögl, K. J. J. Mayrhofer and P. Strasser, J. Am. Chem. Soc., 2015, 137, 13031– 13040.
32 H. N. Nong, H.-S. Oh, T. Reier, E. Willinger, M.-G. Willinger, V. Petkov, D. Teschner and P. Strasser, Angew. Chem., Int. Ed. Engl., 2015, 54, 2975–2979.
33 H. G. Sanchez Casalongue, M. L. Ng, S. Kaya, D. Friebel, H. Ogasawara and A. Nilsson, Angew. Chem., 2014, 126, 7297– 7300.
34 L. C. Seitz, C. F. Dickens, K. Nishio, Y. Hikita, J. Montoya, A. Doyle, C. Kirk, A. Vojvodic, H. Y. Hwang and J. K. Norskov, Science, 2016, 353, 1011–1014.
35 A. Grimaud, A. Demortiere, M. Saubanère, W. Dachraoui, M. Duchamp, M.-L. Doublet and J.-M. Tarascon, Narue Energy, 2, 16189.
36 O. Kasian, J.-P. Grote, S. Geiger, S. Cherevko and K. J. J. Mayrhofer, Angew. Chem., Int. Ed. Engl., 2018, 57, 2488–2491. 37 V. A. Saveleva, L. Wang, D. Teschner, T. Jones, A. S. Gago, K. A. Friedrich, S. Zafeiratos, R. Schlögl and E. R. Savinova, J. Phys. Chem. Lett., 2018, 9, 3154–3160.
38 E. Willinger, C. Massué, R. Schlögl and M. G. Willinger, J. Am. Chem. Soc., 2017, 139, 12093–12101.
39 V. Pfeifer, T. E. Jones, S. Wrabetz, C. Massué, J. J. Velasco Vélez, R. Arrigo, M. Scherzer, S. Piccinin, M. Hävecker, A. Knop-Gericke and R. Schlögl, Chemical Science, 2016, 7, 6791–6795. 40 I. C. Man, H.-Y. Su, F. Calle-Vallejo, H. A. Hansen, J. I. Martínez, N. G. Inoglu, J. Kitchin, T. F. Jaramillo, J. K. Nørskov and J. Rossmeisl, ChemCatChem, 2011, 3, 1159–1165.
41 R. Kötz, H. Neff and S. Stucki, J. Electrochem. Soc., 1984, 131, 72–77.
42 R. Zhang, N. Dubouis, M. Ben Osman, W. Yin, M. T. Sougrati, D. A. D. Corte, D. Giaume and A. Grimaud, Angew. Chem., Int. Ed. Engl., 2019, 58, 4571–4575.
43 P. E. Pearce, A. J. Perez, G. Rousse, M. Saubanère, D. Batuk, D. Foix, E. McCalla, A. M. Abakumov, G. Van Tendeloo, M.-L. Doublet and J.-M. Tarascon, Nat. Mater., 2017, 16, 580–586. 44 M. G. Mavros, T. Tsuchimochi, T. Kowalczyk, A. McIsaac, L.-P. Wang and T. V. Voorhis, Inorg. Chem., 2014, 53, 6386–6397. 45 S. J. Freakley, J. Ruiz-Esquius and D. J. Morgan, Surface and Interface Analysis, 2017, 49, 794–799.
46 A. Iadecola, A. Perea, L. Aldon, G. Aquilanti and L. Stievano, J. Phys. D: Appl. Phys., 2017, 50, 144004.
47 G. Assat, A. Iadecola, C. Delacourt, R. Dedryvère and J.-M. Tarascon, Chem. Mater., 2017, 29, 9714–9724.
48 O. Diaz-Morales, S. Raaijman, R. Kortlever, P. J. Kooyman, T. Wezendonk, J. Gascon, W. T. Fu and M. T. M. Koper, Nat. Commun., 2016, 7, 12363.
49 X. Tan, J. Shen, N. Semagina and M. Secanell, Journal of Catalysis, 2019, 371, 57–70.
50 A. Grimaud, O. Diaz-Morales, B. Han, W. T. Hong, Y.-L. Lee, L. Giordano, K. A. Stoerzinger, M. T. M. Koper and Y. Shao-Horn, Nat. Chem., 2017, 9, 457–465.
51 D. N. Mueller, M. L. Machala, H. Bluhm and W. C. Chueh, Nat. Commun., 2015, 6, 6097.
52 A. Minguzzi, O. Lugaresi, E. Achilli, C. Locatelli, A. Vertova, P. Ghigna and S. Rondinini, Chem. Sci., 2014, 5, 3591–3597. 53 S. Geiger, O. Kasian, B. R. Shrestha, A. M. Mingers, K. J. Mayrhofer and S. Cherevko, J. Electrochem. Soc., 2016, 163, F3132–F3138.
download file
view on ChemRxiv
1
Supplementary Materials for
Revealing the reactivity of the Iridium trioxide intermediate for the oxygen
evolution reaction in acidic media
Paul E. Pearce,
#1,2,3Chunzhen Yang,
#1,3Antonella Iadecola,
3Juan Rodriguez-Carvajal,
4Gwenaëlle
Rousse,
1,2,3Rémi Dedryvère,
3,5Artem M. Abakumov,
6Domitille Giaume,
3,7Michael Deschamps,
3,8Jean-Marie Tarascon
1,2,3,9and Alexis Grimaud*
1,31 Chimie du Solide et de l’Energie, UMR 8260, Collège de France, 11 Place Marcelin Berthelot, 75231 Paris Cedex
05, France
2 Sorbonne Université, 4 place Jussieu, Paris, France
3 Réseau sur le Stockage Electrochimique de l’Energie (RS2E), CNRS FR 3459, 33 rue Saint Leu, 80039 Amiens
Cedex, France
4 Institut Laue-Langevin, 71 Avenue des Martyrs, CS 20156, 38042, Grenoble, Cedex 9, France
5 IPREM - UMR 5254 CNRS, Université de Pau et des Pays de l’Adour, Hélioparc, 2 Avenue Pierre Angot, 64053
Pau Cedex 9, France
6 Skoltech Center for Energy Science and Technology, Skolkovo Institute of Science and Technology, Moscow
121205, Russian Federation
7 Chimie-Paris Tech, PSL Research University, CNRS Institut de Recherche de Chimie-Paris (IRCP), 75005 Paris,
France
8 CNRS, CEMHTI UPR3079, Universite d’Orleans, 1D avenue de la recherche scientifique, 45071 Orleans Cedex 2,
France
9 ALISTORE-European Research Institute, FR CNRS 3104, 80039 Amiens, France # Co-first authors
2
Figure S 1 Galvanostatic charge-discharge profile showing the delithiation potential of β-Li
2IrO
3in
Li-ion battery using LP100 electrolyte. The dashed black line corresponds to the OER potential at
pH 0, E = 1.23 V vs. NHE. The blue, red and green dashed lines correspond to the potential for
compositions x = 0, 0.5 and 1 respectively.
3
Figure S 2 H NMR. a) 1D 1H MAS-NMR Hahn echo spectrum of -H
2IrO
3recorded at 4.7 T and a 64
kHz MAS rate, with below the 2D Hahn echo spectrum obtained after the real Fourier transform
against the echo time in the indirect dimension and the corresponding fit in blue(obtained with
dmfit
1). The 9 detected environments with their respective weights in the 1D spectrum are shown
at the bottom, and the T
2’s ranged between 2 and 4 ms, except for the broad peak in the center,
which has a T
2= 0.06 ms; b)-c) atomic environments for H1 (pink) and H2 (blue), where H1 sites
have a roughly a 50% occupancy and H2 sites a 25% occupancy. The disorder in H1/H2
occupancies give rise to the multiplicity of sites in the
1H spectrum. D) 2D-RFDR homonuclear
correlation spectrum obtained with a 2 ms dipolar recoupling using a XY-16 RFDR train of rotor
synchronized 180° pulses. All the peaks belong to the same phase. e) and f) EXSY spectra obtained
with a mixing time of 1 rotor period (15.6 s) -in blue- compared with a 5 ms mixing time (e) and
50 ms mixing time (f), both in red.
4
Capacity of the redox processes under the OER potential
The capacity of the processes was determined by integrating the area under the peaks below the
OER potential. This was done on a curve obtained at 1mV/s scan rate in 1M H
2SO
4solution in order
to neglect the capacitive current. Multiple curves were integrated and the values differ only slightly
and are around 25mA.h/g.
Figure S 3 Cyclic voltammogram of β-H
2IrO
3in 1M H
2SO
4solution at a scan rate of 1mV/s showing
the integrated area. The data is normalized by the mass of active material.
The theoretical capacity can be obtained by the following relation:
𝐶 =
26.8. ∆𝑥
𝑀
with C the capacity in A.h/g, ∆𝑥 the number of e
-exchanged and M the molar mass of the compound.
The theoretical capacity for 1H
+is therefore 110 mA.h/g.
5
Figure S 4 Operando XAS data treatment and experimental setup. (a) Derivative of the normalized
absorption spectra with the binding energy for which the curve is equal to zero (WL energy)
indicated by a green circle. Below is the measured XANES spectra (blue circles), the fitted Gaussian
(orange) and the arctan function (back) used to fit the step in absorption. The WL area corresponds
to the area between the Gaussian and the arctan functions (hashed). (b) Picture of the home-made
electrochemical cell for operating operando XAS experiments, using carbon paper loaded with 5-8
mg/cm
2geoof β-H
2IrO
3catalyst as working electrode, porous graphitic carbon rod as counter
electrode, and Ag/AgCl (KCl sat.) as reference electrode.
6
Figure S 5 (a) Concentration profile of components extracted by PCA on the XAS data from the
operando experiment for β-Li
2IrO
3, (b) the white line energy evolution and (c) the corresponding
electrochemical curve. (d), (e) and (f) are the normalized XANES spectra for each portion of the
experiment.
7
Figure S 6 Comparison of the OER activities normalized by Ir mass. (a) Cyclic voltammograms of
IrO
2, β-H
xIrO
3and SrIrO
3in 1M H
2SO
4solution using a rotating disk electrode. The current is
normalized by Ir mass loaded on the electrode. (b-d) SEM micrographs of β‒H
2IrO
3, IrO
2and SrIrO
3catalysts, respectively.
8
Figure S 7 Comparison of the electrochemical stabilities of (a) β–H
xIrO
3, (b) SrIrO
3, and (c) IrO
2cycled in 1.0 M H
2SO
4acidic solution for 300 cycles for ~20 hours at a scan rate of 10 mV/s.
Enlarged CV curves depicting the evolution of capacitance regions are shown in (d), (e) and (f),
respectively.
Figure S 8 HAADF-STEM of β-H
2IrO
3after 300 cycles to 1.65 V vs RHE in 1M H
2SO
4solution.
0.5
1.0
1.5
0.0
2.5
5.0
0.5
1.0
1.5
0
2
4
6
8
0.5
1.0
1.5
0
2
0.5
1.0
1.5
-0.4
-0.2
0.0
0.2
0.4
0.6
0.5
1.0
1.5
-0.1
0.0
0.5
1.0
1.5
-0.2
-0.1
0.0
0.1
0.2
IrO
21 M H
2SO
4I
(mA)
E (V vs. RHE)
H
xIrO
31 M H
2SO
4I
(mA)
E (V vs. RHE)
SrIrO
31 M H
2SO
4I
(mA)
E (V vs. RHE)
I
(mA)
E (V vs. RHE)
300th cycle 1st cycleI
(mA)
E (V vs. RHE)
300th cycle 1st cyclef
e
d
c
b
I
(mA)
E (V vs. RHE)
300th cycle 1st cyclea
9
Figure S 9 Li NMR. a)
7Li MAS-NMR spectrum of β-Li
2IrO
3recorded at 4.7 T and 64 kHz MAS,
featuring the environments of the two lithium sites (blue) in term of oxygen (red) and iridium
(green) atoms; b) 2D-RFDR spectrum, using a 4 ms long XY-16 RFDR train of rotor synchronized
180° pulses for dipolar recoupling, showing the proximity in space of the two detected sites; c)
2D-EXSY experiment with the reference spectrum (1 rotor period mixing time) in blue and the 2D 2D-EXSY
obtained with 5 ms mixing time in red, displaying weak cross-peaks indicating an exchange
between the two sites; d) measuring the ratio between the areas of the cross peak and the diagonal
peak leads to the exchange rate constant, measured at 1.19 s
-1at 60-70°C.
10
Figure S 10 a) Graph showing the charge delivered by electrodes of SrIrO
3(blue) and H
2IrO
3(orange) during the potential hold for ICP-OES measurements. b) Percentage of Ir leached during
potential hold at 1.55 V vs RHE in 1M H
2SO
4normalized by the BET surface area.
Figure S 11 Electrochemical stability of the β–H
2IrO
3catalyst. The electrode was applied with a
constant current of 2 mA cm
-2oxidein O2-saturated 0.1 M H
2SO
4solution for 15 hours then in
O2-saturated 1.0 M H
2SO
4solution for 14 hours.
0 10 20 30 40 50 0 5 10 15 20 25 30 0 10 20 30 40 50 0.0 0.5 1.0