HAL Id: hal-00574290
https://hal-mines-paristech.archives-ouvertes.fr/hal-00574290
Submitted on 7 Mar 2011
HAL is a multi-disciplinary open access
archive for the deposit and dissemination of
sci-entific research documents, whether they are
pub-lished or not. The documents may come from
teaching and research institutions in France or
abroad, or from public or private research centers.
L’archive ouverte pluridisciplinaire HAL, est
destinée au dépôt et à la diffusion de documents
scientifiques de niveau recherche, publiés ou non,
émanant des établissements d’enseignement et de
recherche français ou étrangers, des laboratoires
publics ou privés.
A complete method for rheological characterization of
steel at high temperature
Christophe Pradille, Michel Bellet, Yvan Chastel
To cite this version:
Christophe Pradille, Michel Bellet, Yvan Chastel. A complete method for rheological characterization
of steel at high temperature. 14th International Conference on Experimental Mechanics (ICEM 14),
Jul 2010, Poitiers, France. article number 17001 - 7 p., �10.1051/epjconf/20100617001�. �hal-00574290�
A
COMPLETE METHOD FOR RHEOLOGICAL CHARACTERIZATION OF STEEL AT HIGH TEMPERATUREC. Pradille
a, M. Bellet
band Y. Chastel
cMINES-ParisTech, CEMEF, UMR CNRS 7635, Sophia Antipolis, France
achristophe.pradille@mines-paristech.fr, bmichel.bellet@mines-paristech.fr, c
yvan.chastel@mines-paristech.fr
Abstract:
For finite elements modelling of industrial process, like welding solidification or heat treatment, a good knowledge of behaviour at high temperature is crucial. In this paper, in one hand a coupled electrical thermal and mechanical is proposed and in other hand strain field measurement with non intrusive techniques is needed in order to characterize the behaviour of steels at high temperatures and when subjected to small displacements. The displacement field measurement is based on laser produced speckles coupled with a cross correlation cross spectrum method. And the finite element model is able to modelize a resistance heating tensile test. Application on two different steel grades is considered. Numerical model has been compared with electrical and thermal measurements. The proposed method can be used to define the optimal sample geometry and as an important achievement, can be viewed for further inverse modelling identification methods.Introduction
The hot tearing phenomena are one of principal surface defect that can affect a large part of steel production obtained by ingot or continuous casting way. Those affected products should be machined or remelted. The understanding of solidification crack phenomena is a challenge. On the one hand, industrial concerns are considerable in terms of productivity and product quality. On the other hand, physical mechanisms of hot tearing are far from being well understood, which makes it a scientific challenge. The action of the solid part on the liquid part explains the solidification’s defaults. Indeed during solidification a liquid film might be trapped between solid parts. The liquid film acts like a weak zone when the material is submitted to mechanical solicitations. In fact when this interdendritic film is not supplied with liquid, cavities appears and possibly causes cracks. These complex phenomena depend on the ability of liquid to flow through the dendritic structure to feed the volumetric shrinkage. Several different criteria have been developed to predict hot tears from thermal mechanical analysis [1]. But a predicted numerical simulation of these phenomena based only on hot tearing criteria issued from experimental characterization is not sufficient [2]. The knowledge of précised behaviour laws is necessary to be closer to experimental conditions, which means high temperatures (900°C to solidus temperature], very low strain rates (103 104s1) and very small strains (on the order of 1 per cent) For this highly multiphysics problem, one of the main difficulties lies in the rheological characterization of metallic alloys, at high temperature and in the semi solid state. Actually, there is only few data for constitutive laws of industrial steel for solidification conditions (ie high temperature and very low strain and strain rate). Rheological characterization under tensile conditions has been carried out using a direct resistance heating machine named Taboo. The Taboo set up allows cyclic loadings at very low strain rate (103104s1) between 900°C and the solidus temperature. A problem with resistance heating techniques is the significant thermal gradient along the sample, which causes heterogeneous strains. Due to the spatial heterogeneity of the strain field, the displacement field needs to be known on the entire sample. The speckle correlation photography has several advantages like full field and non destructive measurement. However, this method is classically limited in temperature (around 900°C). The reason for this is that the speckle is usually produced with painting [3]. Furthermore, at high temperatures these methods based on optical measurements are also very sensitive to the visible spectrum, in particular in the red wave length. All these limitations lead us to develop a new method based on laser produced speckles. Since, as for steel the radiation is absent in the green wave length around 1500°C, a green laser is used. In this work we also present a technique of image analysis based on a cross spectrum method. This method proves more accurate than cross correlation technique for small displacement and more efficient for quickly analysing two pictures within only a few milliseconds. Consequently combined electrical thermal and mechanical software have been performed to simulate the entire tensile test. The use of direct resistance heating simulation can be a first step in optimizing the global process and in designing optimal sample geometry in order to minimise the temperature gradients. Indeed, for a subsequent analysis, it is preferable that the deformed are be as homogeneous as possible in terms of temperature. Then to develop a predictive numerical model to simulate the complete tensile test and to identify mechanical parameters from full field measurement by inverse analysis
Experimental Set-up
Taboo Tensile Test Machine.
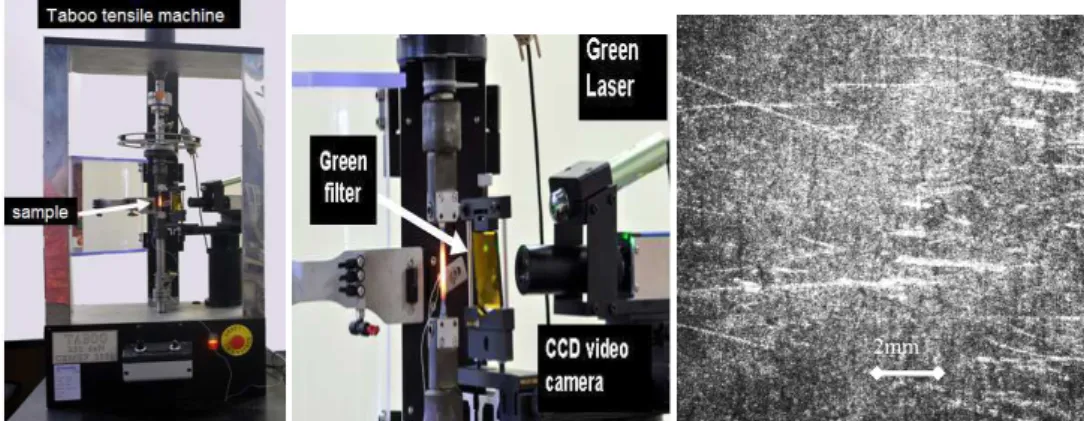
The "Taboo" machine (Fig. 1) is a thermo mechanical simulator which has been developed at Cemef to investigate the behaviour of steels at very high temperature up to the solidus temperature and possibly in the semi solid state. Before applying the loading cycle, © Owned by the authors, published by EDP Sciences, 2010
DOI:10.1051/epjconf/20100617001 EPJ Web of Conferences 6, 17001 (2010) 6
follows. A thermocouple is welded in the middle of the specimen. During the heating and loading phases of the test, the current intensity is dynamically controlled in order to prescribe a desired temperature. An alternative monitoring procedure consists in using a thermal camera to measure the temperature field on the specimen surface. During the heating stage, the mobile grip displacement is monitored in order to apply no external force onto the specimen. Once the desired temperature is reached, the mechanical test starts and the tensile force is measured by a load cell. The measurement of force vs displacement curves requires a high temperature extensometry technique. For that purpose, a non contact method has been developed and is presented in the next section.
Fig. 1: "Taboo" tensile machine (left), laser speckle equipment (centre) and a typical laser speckle pattern (right).
Speckles Set-up.
A laser is projected on the area in which the displacement field needs to be measured. The laser beam is enlarged by a microscope lens that allows illuminating a large area on the central part of the tensile sample (typically 10 x 6 mm, the specimen being 90 mm long and 6 mm wide). Speckle images arising from local interference phenomena due to surface roughness are captured by a CCD camera and are simultaneously transferred to a computer. The size of analysed pattern areas is 1920x1080 (about 2 Mpixels). Each pixel can store a grey scale 8 bit value ranging from 0 to 255. During the experiment, a series of patterns can be either collected for post treatment later on or correlated and analysed for the control loop. The correlation between initial and current speckle patterns provides the displacement, as explained in the next section.
Image Correlation Techniques
The surface is considered to change relatively slowly during the experiment. Consequently, over a small time step, strains are low and the observed images are simply translated. In the following paragraph a technique of image analysis based on a coupled cross correlation / cross spectrum technique is presented. This technique is used to obtain the displacement field from two images. This coupled method allows characterizing the displacement within a few milliseconds with a sub pixel resolution for a large range of displacement (from less than 1 pixel to 20 or more pixels).
The cross spectrum and the cross correlation methods have different advantages. Cross correlation method is less accurate for small displacements and less rapid than cross spectrum method but it is more accurate for large displacement.
The Cross-spectrum Method
[4].
Consider a plane surface covered by a speckle pattern where the image intensity at time t0is defined by
f
(
x
,
y
)
. The Fouriertransform
F
( v
u
,
)
is defined as:}
{
f
x
y
=
F
u
v
=
∫∫
f
x
y
e
− +dxdy
TF
2i (ux vy))
,
(
)
,
(
)
,
(
π . (1)Consider now a second image where the intensity at time t1= t0+ t is defined as
g
(
x
,
y
)
. If the functiong
(
x
,
y
)
is written as atranslation of
f
(
x
,
y
)
:g
(
x
,
y
)
=
f
(
x
−
x
0,
y
−
y
0)
, and defining the cross spectrumI
( v
u
,
)
as the multiplication ofF
( v
u
,
)
by the complex conjugate of
G
( v
u
,
)
(denotedG
*
(
u
,
v
))
, we get:) ( 2 ) ( 2 0 0
(
,
)
²
0 0)
,
(
*
)
,
(
)
,
(
*
)
,
(
)
,
(
u
v
F
u
v
G
u
v
F
u
v
F
u
v
e
i ux vyF
u
v
e
i ux vyI
=
=
π +=
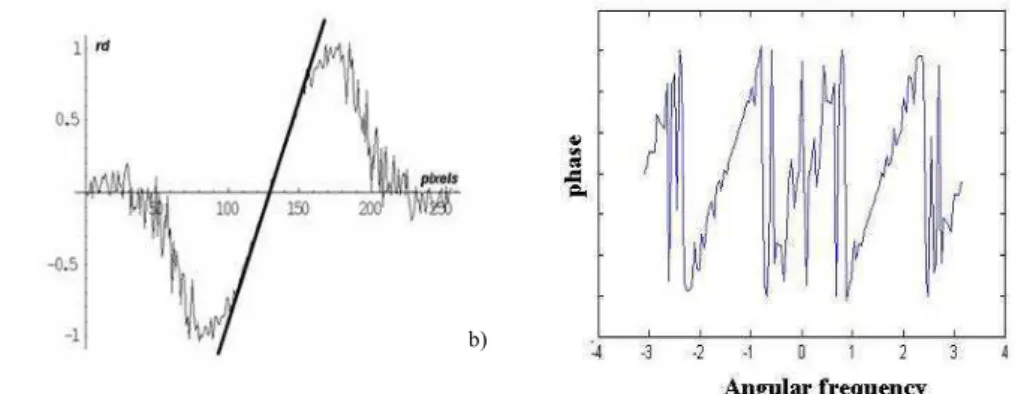
π + . (2)Eq. 2 shows that the displacement can be expressed according to two components corresponding to two different directions. The phase can consequently be decomposed into two expressions. The displacement is obtained from a linear fit of the expression of the
2mm
phase (Fig. 2a). It seems quite simple to obtain a measure of the displacement between two different pictures with a cross spectrum method. But, at high spatial frequencies, the noise and/or a bad sampling can lead to a zero value of the phase instead of showing the expected random variation (between π and +π). Moreover, fitting the phase slopes is not precise when the displacement is larger than 1 pixel. In fact, in this case the phase varies between π and +π. A displacement can not be accurately determined when a poor sampling is added to a slope of the phase, as illustrated in Fig. 2b.
Fig. 2: a) Example of displacement calculations. The phase falls down to 0 for high spatial frequencies; b) Example of the phase for a displacement larger than 1 pixel.
The Cross-correlation Method.
In most papers dealing with field measurement (e.g. [5, 6]), the cross correlation technique is reported to be used. In practice, from the Wienner Kinchine theorem, the cross correlation can be written as the inverse Fourier transform of Eq. 2 and these two functions contain equivalent information. However, it is more convenient to use the cross spectrum method to measure very small displacements (smaller than pixel). Defining the Fourier transform of
I
( v
u
,
)
asI
(
ξ
,
η
)
, we write:∫∫
=
∫∫
=
−
−
=
+ − + −)
,
(
²
)
,
(
)
,
(
)
,
(
0 0 )) ( ) ( ( 2 ) ( 2dudv
F
u
v
e
0 0I
x
y
e
v
u
I
I
ξ
η
iπξuηv iπuξ x vη yξ
η
. (3)A Coupled Cross-correlation - Cross-spectrum Technique.
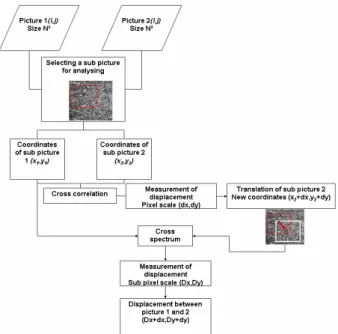
As mentioned above and shown in Fig. 2, for a large displacement (over 10 pixels), the use of the cross spectrum method becomes inappropriate. Moreover, a shear mode might be difficult to analyse. Indeed, a minor displacement in the non longitudinal direction creates a noise for the phase in the principal direction. In this case, it is suggested to use a coupled cross correlation cross spectrum technique (CC CS). The principle of the method is presented in Fig. 3. As shown is this figure, a cross correlation is first used to determine a displacement of the order of one pixel. One of the two images is shifted about one pixel and a cross spectrum analysis is then used to determine the sub pixel scale displacement. Finally, the displacement between two images is calculated by summing the displacements obtained by the two methods. In the technique presented here, a single image is divided into a grid of sub pictures. Their size varies between 8x8 and 256x256 pixels. The algorithm is then applied to each couple of sub pictures to determine the local displacement field between them. Therefore, the size and number of sub pictures give the maximum spatial resolution of the displacement field. Sub elements can be perfectly placed side by side or overlapped.
Fig. 3: Schematic algorithm of the coupled cross correlation cross spectrum (CC CS) technique.
Rigid body translation
The sample is placed on a translation table with a micrometer indicator. A laser beam is projected in order to produce a laser speckle pattern. The minimum displacement authorized is 0.5 Hm. We have realised different tests, from a displacement of 2 Hm to a displacement of 20 Hm and from 60 Hm to 1.5mm. The correlated displacement calculated using the hydrid CC CS method are presented in fig . For small displacement, the test was rum with translation of 0.26 to 2.6 pixels. The correlated displacement is within good accuracy. For a 20 Hm imposed translation, the displacement field after analysis is shown in fig . as we can see the displacement throughout the specimen is quite uniform.
Figure 1: results for small uniform translation a) and for large uniform translation b)
Application to a Real Tensile Test
A notched thin sample (25 mm wide, 120 mm long, 1 mm thick) is subjected to a tensile load. One side of the specimen is illuminated by the laser, while the other side is covered by a speckle like pattern created using black and white spray paints. All images are recorded on both sides of the sample using two cameras. Fig. 5a presents both speckle patterns. Different comparisons are applied on the captured images, first for different correlation algorithms, and second for different types of speckles.
Comparison of Results Obtained on the Painted Surface
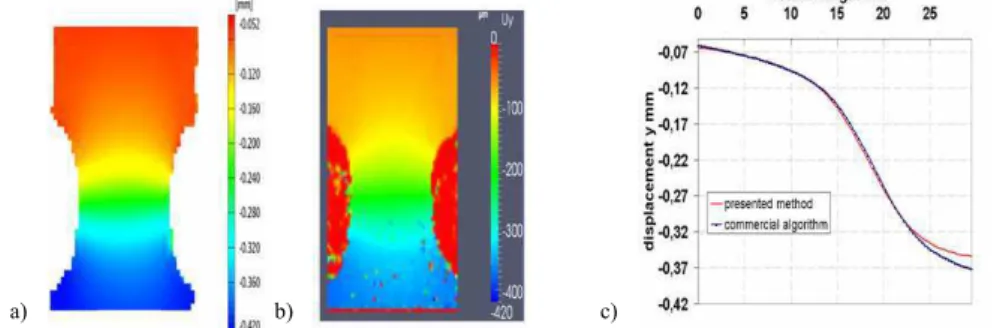
.The presented algorithm and a commercial algorithm are both used to determine displacement fields on the painted surface of the sample. Fig. 4a and b show a comparison of the fields determined by two different algorithms, and Fig. 4c presents more precisely a displacement curve along the Y transverse axis. In the two cases the results are similar.
Fig. 4: Distribution of vertical displacement component, as determined by ARAMIS*(a) and the hybrid algorithm (b) on the painted
face. On the right (c), comparison between displacement curves.
Comparison of Displacement Obtained with the Two Methods.
The analysed area is not the same on the two faces of the sample; only a quarter of the sample is analysed. Fig 5b shows the comparison of displacement curves obtained with the laser speckle method and the painted speckle.
Fig. 5: a) Black and white painting on the sample surface, and the equivalent area on the other face over which the laser is projected. b) Comparison of displacements obtained with the two techniques on the two faces of the sample.
Application to Hot Tensile Test
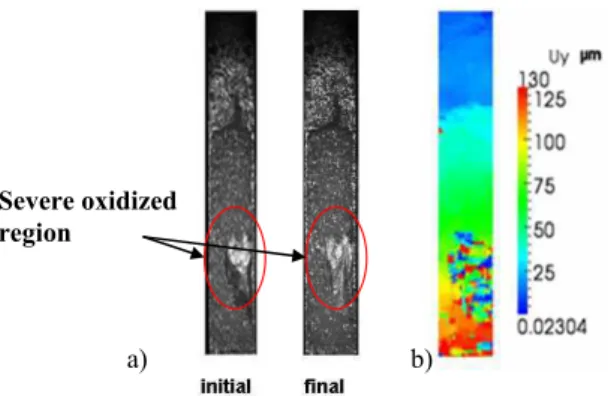
Following previous validations, the hybrid CC CS technique is now applied to tests performed at high temperature (1200°C). Fig 7 shows the analysis of a laser speckle pattern in order to determine a displacement field. As shown in Fig 6b, accurate correlation is possible except in areas exposed to severe oxidation (red circle area). As expected, the method remains reliable for high temperature except in the region where the surface aspect changes notably between two shots. Therefore, a careful protection against oxidation like argon gas or argo hydrogen along the surface is necessary. During a first test with an argon hydrogen protection, oxidation has completely disappeared. Another concern at very high temperature remains thermal gradients in gas boundary layers, or thermal plume detachment that could affect the accuracy of the speckle method. It can be thought that using such argon protection, such problems could be avoided, but this needs to be confirmed.
a) c)
a) b)
a)
b)
Fig. 6: a) Example of speckle pattern on a hot sample (1200°C). b) Measured vertical displacement field.
Numerical modelling of taboo tensile tests
A finite element model able to simulate the entire Taboo heating and tensile load procedure has been developed. This model is based on the work of Bay & al [7]. This electrical thermal and mechanical simulation of a tensile test with use of direct resistance heating can be adapted to model multi physics phenomena involved in such mechanical testing. This numerical model has been used first to design optimal sample geometry in order to minimise the temperature gradients throughout the samples. In fact, for subsequent analysis, it is preferable that the deformation be as homogeneous as possible in terms of temperature. Moreover, the numerical model is able to simulate the complete tensile test (including the heating with a temperature control by a numerical PID regulation).
Application on stationary and non stationary test:
First considering a stationary test (without tensile load) allows determining the values of the thermal emissivity
ε
r, the heat transfer coefficient h and also the electrical conductivity. To compare the thermal field issue of the numerical model and the experiment, a thermal camera is used. This camera allows obtaining full thermal field measurement and comparing the temperature gradients throughout the sample. The camera is used on a sample heated up to 900°C and kept at this temperature. As shown in fig 7the numerical temperature profile has a great accordance with the experimental measures.Fig. 7: comparison between thermal camera measurement and Forge simulation
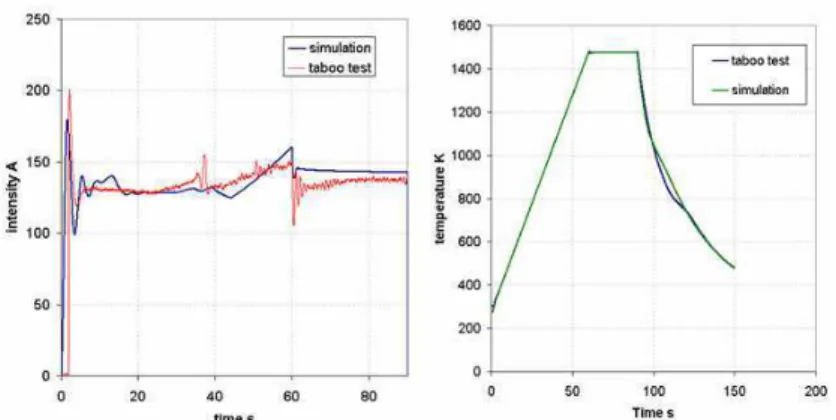
In a second step we have preceded to comparisons in a non steady state conditions in order to determine all thermo physical properties including the value of specific heat Cp. A comparison between the injected electrical intensity in the numerical and in the experimental case allows first validating the electrical conductivity and the specific heat. As shown in fig 7 similar variations of intensity can be observed in the two cases. Then, a comparison between the simulated temperature and the real temperature allows validating the exchange parameters as well as the Cp. A good accordance between the two temperatures can be observed except around the phase change, probably due to a high time step for the calculation around the peak of Cp.
Fig. 8: comparison between simulation and taboo test: injected electrical intensity (left) and temperature in the centre of specimen (right)
Conclusion
This paper presents the study of tensile tests for high temperature and low strain rate. First a non contact method using laser speckles to evaluate the displacement field during a mechanical test. Different tools were presented to characterize the behaviour of steel in these conditions As shown, the method was validated on virtual and real tensile tests. Moreover an original algorithm based on a coupled correlation cross spectrum method proves efficient for sub pixel scale measurement and faster than algorithms commonly used. Then a finite element method able to simulate the entire tensile test with joule effect heating is presented. Moreover, designing the best sample geometry was facilitated by the finite element model which was validated with the experiment. At present, software for inverse analysis is being developed to identify the rheoligical parameters of different steel grades. The newly determined parameters will be used in a finite element software able to simulate casting process.
Acknowledgement
This study has been conducted in the framework of the cooperative project “Cracracks” supported by the French Agence Nationale de la Recherche (ANR).
*ARAMIS is a registered trademark of GOM GmbH (http://service.gom.com)
References
1. M. Bellet, Metal Mater Trans A Vol 30, p 2705,(2009) 2. O. Cerri PhD thesis, MINES ParisTech, (2007) 3. R. Knockaert, PhD thesis, MINES ParisTech, (2001)
4. C. Grec, C. Aime, M. Faurobert, G. Ricort, F. Paletou, A&A, Vol. 463, p. 1125 1136, (2006) 5. L. Chevalier, S. Calloch, F. Hild, Y. Marco, Eur J mech A/solids, Vol. 20, p.169 187, 6. H.J. Huan, A. Waas, Optical Eng., Vol. 46, p. 051005, (2007)