HAL Id: hal-01414195
https://hal.inria.fr/hal-01414195
Submitted on 12 Dec 2016
HAL is a multi-disciplinary open access
archive for the deposit and dissemination of
sci-entific research documents, whether they are
pub-lished or not. The documents may come from
teaching and research institutions in France or
abroad, or from public or private research centers.
L’archive ouverte pluridisciplinaire HAL, est
destinée au dépôt et à la diffusion de documents
scientifiques de niveau recherche, publiés ou non,
émanant des établissements d’enseignement et de
recherche français ou étrangers, des laboratoires
publics ou privés.
Network-Based UE Mobility Estimation in Mobile
Networks
Dalia-Georgiana Herculea, Majed Haddad, Veronique Capdevielle, Chung
Shue Chen
To cite this version:
Dalia-Georgiana Herculea, Majed Haddad, Veronique Capdevielle, Chung Shue Chen. Network-Based
UE Mobility Estimation in Mobile Networks. S3 ’15 Proceedings of the 2015 Workshop on
Wire-less of the Students, by the Students, & for the Students , Sep 2015, Paris, France. pp.1 - 3,
�10.1145/2801694.2801704�. �hal-01414195�
Network-Based UE Mobility Estimation in Mobile Networks
Dalia-Georgiana Herculea
1, Majed Haddad
2, Veronique Capdevielle
3, and Chung Shue Chen
11
Alcatel-Lucent Bell Labs, 2 University of Avignon, 3 Alcatel-Lucent
1,3
Centre de Villarceaux, Route de Villejust, 91620 Nozay, France
2
Rue Louis Pasteur, 84000 Avignon, France
INRIA-Alcatel-Lucent Bell Labs Joint Research Center, France
{dalia-gerogiana.herculea, veronique.capdevielle, cs.chen}@alcatel-lucent.com
majed.haddad@univ-avignon.fr
ABSTRACT
The co-existence of small cells and macro cells is a key feature of 4G and future networks. This heterogeneity, together with the increased mobility of user devices can generate a high handover frequency that could lead to unreasonably high call drop probability or poor user experience. By performing smart mobility management, the network can pro-actively adapt to the user and guarantee seamless and smooth cell transitions. In this work, we introduce an algorithm that takes as input sounding reference signal (SRS) measurements available at the base station (eNodeB in 4G systems) to estimate with a low computational requirement the mobility level of the user and with no modification at the user device/equipment (UE) side. The performance of the algorithm is showcased using realistic data and mobility traces. Results show that the classification of UE speed to three mobility classes can be achieved with accuracy of 87% for low mobility, 93% for medium mobility, and 94% for high mobility, respectively.
Categories and Subject Descriptors
C.2.3 [Computer-Communication Networks]: Network Operations - network monitoring, network management.
General Terms
Algorithms, Management, Measurement, Performance, Design.
Keywords
Mobile networks; Heterogeneous cellular networks; User mobility estimation; Time-based spectral spreading method.
1. INTRODUCTION
Future cellular networks will consist of dense small cells overlaid by macro cells. With the deployment of heterogeneous networks (HetNets), a mobile user will switch from one cell to another whereas the network must ensure continuous service and high quality user experience. Supporting service continuity is especially challenging due to potentially high handover frequency and the future requirement of ultra low latency. However, if the UE mobility information is available, then the network can
pro-actively adapt to the user and guarantee seamless and smooth UE handover with optimal cell selection such that a UE could always experience maximum throughput [1].
For example, if the UE is classified as having low mobility, it may be more appropriate to attach him/her to a small cell so he/she can benefit from higher link capacity. Also, the network can decide to use such a UE for device-to-device (D2D) communications, multiple-input-multiple-output (MIMO) or other techniques that require a certain network topology for relatively long period. On the other hand, if the UE is classified as having a high mobility, the network may attach him/her to a macro cell to minimize the handover rate and maintain service continuity.
Several methods have been proposed in the literature to estimate the UE speed in specific use cases, e.g., crossing level based methods [2], covariance based methods [3-4], maximum likelihood (ML) based methods [5], and power spectrum based methods. The main drawback of these methods is that they do not cope with the large periodicity of SRS measurements as they aim at analyzing the speed dependent fast fading and Doppler characteristics of the signals. Due to large sampling period of sounding reference signal (SRS), the Nyquist frequency for avoiding spectrum aliasing will be reduced, which limits the maximum observable Doppler frequency and thus decreases the maximum observable speed. Furthermore, it is known that crossing level based methods are less efficient than covariance methods for small observation windows. Both techniques are sensitive to noise for small Doppler spreads. The ML based methods could provide near optimal performance but would need to know the signal-to-noise-ratio (SNR) and the Gaussian noise and have high implementation complexity.
In this paper, we propose a new method by defining a novel metric that is a function of the auto-correlation of the SRS measurements. This metric depends on the ratio of the UE speed to the decorrelation distance. Given this dependency, we can estimate the UE mobility by lookup in a reference data basis providing a one-to-one mapping between the metric and the UE speed, for a given decorrelation distance. The algorithm has low complexity. Meanwhile, simulation results using realistic data and mobility traces from the city of Cologne [6] show that the proposed method can determine the user mobility with high accuracy.
2. TIME-BASED SPECTRAL SPREADING
METHOD (TSSM)
Shadowing is a spatial correlated process. The correlation between shadow fading at two points separated by a distance will decrease with the increase of their distance. This property is
This paper has been accepted in ACM MobiCom'15 Poster Session and invited by ACM S3’15 Workshop for presentation. Permission to make digital or hard copies of part or all of this work for personal or classroom use is granted without fee provided that copies are not made or distributed for profit or commercial advantage and that copies bear this notice and the full citation on the first page. Copyrights for third-party components of this work must be honored. For all other uses, contact the owner/author. Copyright is held by the owner/author(s).
S3'15, September 11, 2015, Paris, France
© 2015 ACM. ISBN 978-1-4503-3701-4/15/09. DOI: http://dx.doi.org/10.1145/2801694.2801704
notably captured by Gudmundson’s correlation model for shadowing [7]:
where is a Gaussian random process, and in decibel are its shadowing fading mean and standard deviation values, is the UE’s speed while is the time variable, and D is the decorrelation distance at which the signal autocorrelation equals to 1/e of its maximum value [8].
Since , where and are the speed and time, our purpose is to find a metric that would vary proportionally with the speed. By applying the Fourier transform of the auto-correlation function [9], the power spectral density of the shadowing process gives a Lorentzian function with frequency
which is to say that there exists a spread in spectrum under the effect of velocity. However, the Fourier transform is computationally expensive. Therefore, we will derive in time-domain a method to capture this behavior.
It is of interest to observe that when computing the second derivative of the autocorrelation function of the shadowing:
where is the received signal amplitude. The relationship between the speed and the derivative of the SRS measurement can be thus expressed as:
. (4)
This implies that the standard deviation of the derivative of the measurements is a linear function of
.
Now, we define the TSSM metric as:
(5)
which is equal to
and corresponds to the spectrum spreading of the received signal amplitude. This leads to the following estimate approximation of the speed as a function of the received signal amplitude:
.
(6)
3. ALGORITHM AND SYSTEM MODEL
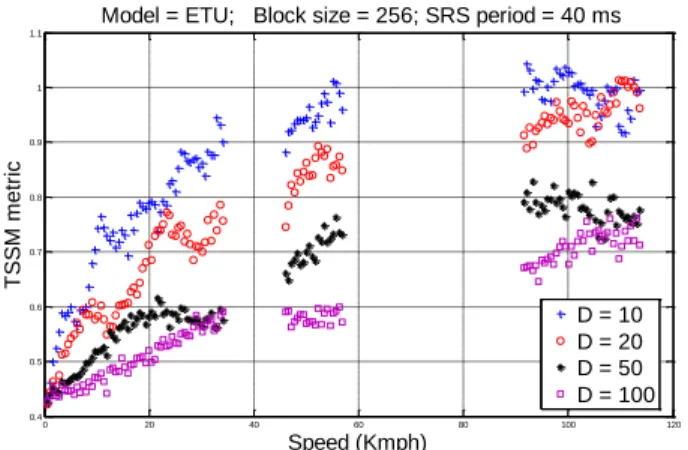
The speed dependent spread of the power spectral density is detected in time by exploiting the variance of the temporal derivative of the SRS signal. Figure 1 shows the TSSM metric as a function of the speed and decorrelation distance. As expected, the metric is increasing with the increase of speed and with the decrease of the decorrelation distance.
Given this observation, we build a database that maps the TSSM metric function of user speed for different values of the decorrelation distance. This database is stored at the eNodeB. The
only prior knowledge necessary for the algorithm is the decorrelation distance corresponding to the environment. Its value can be determined through an initial learning phase. Once the database is built offline, the speed estimation is done online, for UE. The algorithm consists of the following steps illustrated in Figure 2.
Figure 1. TSSM metric as a function of UE speed for different decorrelation distance D.
Figure 2. Per block implementation of the TSSM algorithm. Taking blocks of samples of SRS measurements, denoted by [Xi+1, …, Xi+N], the signal is first normalized:
.
(7)
Next, derivatives are computed over the temporal blocks. This operation enables to smooth the signal, thus reduces fast fading and Doppler variations, for capturing only the slow variations of shadowing. Here,
(8)
where is the delay between two points of derivatives and is the measurements sampling period.
Then, the TSSM metric is computed per block from the set of all derivatives as follows:
(9)
where is the number of derivatives computed on block and is the mean value over these derivatives.
The above estimated metric in (9) is compared to the database that provides a one-to-one mapping between the speed and the TSSM metric, given shadowing decorrelation distance . The speed that
0 20 40 60 80 100 120 0.4 0.5 0.6 0.7 0.8 0.9 1 1.1 Speed (Kmph) T S S M m e tr ic
Model = ETU; Block size = 256; SRS period = 40 ms
D = 10 D = 20 D = 50 D = 100 Blocki= [Xi+1,…,Xi+N] Database Normalization Derivative Comparison to database Speed (estimated) TSSM metric
corresponds to the closest dispersion from this database is outputted as the estimated UE speed.
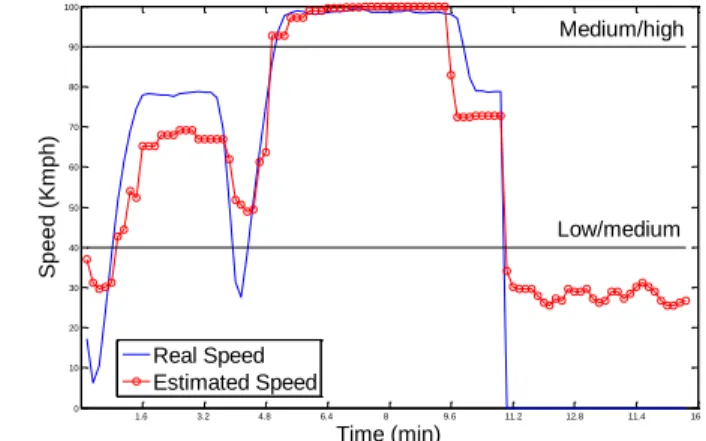
For 4G (3GPP-LTE) cellular networks, we consider three classes of UE mobility: low mobility class for speeds below 40 Kmph, medium mobility class for speeds between 40 and 90 Kmph, and high mobility class for speeds above 90 Kmph. The estimated speed will be compared to the above thresholds and then classified accordingly.
4. EXPERIMENTAL EVALUATION
We use signal measurements provided by Alcatel-Lucent eNodeB to test our algorithm. The SRS signals are sampled with a period of 80 ms, proving a proper resolution. For the mobility, we use real world vehicular traces provided by Kolontrace project that comprise recordings of user speeds in the city Cologne [6]. 3GPP extended typical urban (ETU) channel model is considered with 4G (3GPP-LTE) carrier frequency of 1.9 GHz. We build 160 minutes of signal measurements.
The normalization of the SRS signals is performed on blocks of size signal samples. After taking derivatives, we compute the TSSM metric. By searching the nearest value to our TSSM metric in the database, the estimated speed is found by performing the one-to-one mapping. Figure 3 shows an example of the real trace of the speed of one user in the experiment in comparison to the estimated speed by the proposed algorithm.
Figure 3. Example of real speed versus the estimated speed. The above result is then classified into different classes by comparing to previously defined thresholds. These operations can be done in an adaptive manner. The estimation can be done not by blocks of samples but by using a moving time window. The percentages of correct classification in our experiment of 160 minutes are summarized in Table 1. These percentages offer a good accuracy in determining the speeds of mobile users in today’s 4G (3GPP-LTE) networks.
Table 1. The percentages of correct classification of UE speed Low mobility class Medium mobility class High mobility class Probability of correct classification 87% 93% 94%
For implementation and practical considerations, in Table 2, we list the key operations and computation requirements due to the proposed TSSM method in order to highlight its possible impacts to the eNodeB CPU and memory.
Table 2. Key operation and characteristics in TSSM Main Functional
Elements
• Normalization operation • Derivative computation • Variance computation To eNodeB CPU Around 10 operations per UE
speed estimation
To eNodeB Memory Circular buffer of 15 samples
5. CONCLUSION
In this paper, we have presented a new method to estimate the user mobility for LTE and future networks. TSSM method exploits shadow fading effects, taking advantage of the existence of SRS measurements at the network side, and provides a method of low (CPU) computation and memory requirement. Our evaluation studies based on real data and mobility traces show success rates of 87% for low mobility class, 93% for medium mobility class, and 94% for high mobility class, and indicate a high-accuracy implementable solution with low complexity.
6. ACKNOWLEDGMENTS
This work was partially supported by ANR project IDEFIX under grant number ANR-13-INFR-0006. A part of the work was carried out at LINCS (www.lincs.fr). We would like to thank Frederic Ratovelomanana and Nidham Ben Rached of Alcatel-Lucent and Eitan Altman of INRIA for their valuable discussion and continuous supports in this work.
7. REFERENCES
[1] Nguyen, V. M., Chen, C. S., and Thomas, L. 2013. A unified stochastic model of handover measurement in mobile networks. IEEE/ACM Transactions on Networking.
[2] Zhang, H. and Abdi, A. 2004. Mobile speed estimation using diversity combining in fading channels. IEEE Globecom. [3] Holtzman, J. M. and Sampath, A. 1995. Adaptive averaging
methodology for handoffs in cellular systems. IEEE
Transactions on Vehicular Technology.
[4] Zheng, R. Y. and Xiao, C. 2009. Mobile speed estimation for broadband wireless communications over Rician fading channels. IEEE Transactions on Wireless Communications. [5] Braun, M., Sturm, C., and Jondral, F. K. 2010. Maximum
likelihood speed and distance estimation for OFDM radar.
IEEE Radar Conference.
[6] http://kolntrace.project.fr
[7] Gudmundson, M. 1991. Correlation model for shadow fading in mobile radio systems. Electronics Letters.
[8] Marsan, M., Hess, G. C., and Gilbert, S. S. 1990. Shadow variability in an urban land mobile radio environment.
Electronics Letters.
[9] Haddad, M., Capdevielle, V., Altman, E., and Feki, A., Method and system for user speed estimation in wireless networks. Filed patent 813871-EP-EPA.
1.6 3.2 4.8 6.4 8 9.6 11.2 12.8 11.4 16 0 10 20 30 40 50 60 70 80 90 100 Time (min) S p e e d ( K m p h ) Low/medium Medium/high Real Speed Estimated Speed