HAL Id: inserm-00109455
https://www.hal.inserm.fr/inserm-00109455
Submitted on 27 Jun 2007
HAL is a multi-disciplinary open access
archive for the deposit and dissemination of
sci-entific research documents, whether they are
pub-lished or not. The documents may come from
teaching and research institutions in France or
abroad, or from public or private research centers.
L’archive ouverte pluridisciplinaire HAL, est
destinée au dépôt et à la diffusion de documents
scientifiques de niveau recherche, publiés ou non,
émanant des établissements d’enseignement et de
recherche français ou étrangers, des laboratoires
publics ou privés.
A surface registration approach for video-based analysis
of intraoperative brain surface deformations
Perrine Paul, Aurélie Quere, Elise Arnaud, Xavier Morandi, Pierre Jannin
To cite this version:
Perrine Paul, Aurélie Quere, Elise Arnaud, Xavier Morandi, Pierre Jannin. A surface registration
ap-proach for video-based analysis of intraoperative brain surface deformations. Oct 2006, pp.0.
�inserm-00109455�
A surface registration approach for video-based analysis of intraoperative
brain surface deformations
Perrine Paul∗
Unit/Projet Visages U746 Medtronic SNT, FRANCE
Aurelie Quere
Unit/Projet Visages U746, FRANCE
Elise Arnaud
DISI, Slip Guru group , ITALY
Xavier Morandi†
Unit/Projet Visages U746 CHU Pontchaillou Rennes, FRANCE
Pierre Jannin‡
Unit/Projet Visages U746, FRANCE
ABSTRACT
Anatomical intra operative deformation is a major limitation of accuracy in image guided neurosurgery. Approaches to quantify these deforamations based on 3D reconstruction of surfaces have been introduced. For accurate quantification of surface deforma-tion, a robust surface registration method is required. In this paper, we propose a new surface registration for video-based analysis of intraoperative brain deformations. This registration method includes three terms: the first term is related to image intensities, the second to Euclidean distance and the third to anatomical landmarks continuously tracked in 2D video. This new surface registration method can be used with any cortical surface textured point cloud computed by stereoscopic or laser range approaches. We have shown the global method, including textured point cloud reconstruction, had a precision within 2 millimeters, which is within the usual rigid registration error of the neuronavigation system before deformations.
Keywords: image-guided neurosurgery, intra operative brain
sur-face deformation, video analysis
1 INTRODUCTION
Anatomical intra operative deformation is a major limitation of ac-curacy in image guided neurosurgery. Image guided surgery (IGS) is based on the registration between preoperative images and the patient in his/her surgical position. This registration relies on a rigid transform assumption, which is not verified during some neu-rosurgical procedures. For lesion removal surgery with craniotomy, many parameters are related to the brain deformation, e.g. gravity, lesion size, loss of cerebro-spinal fluid, resection [4]. The ampli-tude of these deformations can be up to 2cm as shown in [8] and their principal direction is not always the gravity direction. Ap-proaches to update preoperative images according to deformation tend to use intraoperative imaging (e.g. 3D ultrasound, surface ac-quisition [17],[12], interventional MRI [3]), with or without biome-chanical or predictive models. These approaches did not solve all issues concerning brain deformations yet. Since brain deformation is a complex spatio-temporal phenomenon, there are still some is-sues relative to real time aspects and to the need for the development of light, easy to use and not cumbersome solutions. In our opinion,
∗e-mail: [email protected]
†e-mail:[email protected] ‡e-mail:[email protected]
the most promising approach should cope with intraoperative in-formation, both volumic and surface and with a priori information regarding the brain shift phenomenon. Surfacic information is one interesting solution for being able to address the issues emphasized above. Video images are a light and low cost solution for this prob-lem. Approaches based on 3D reconstruction of surfaces have been introduced. For accurate quantification of surface deformation, a robust surface registration method is required. Previous solutions are mostly based on iterative closest point algorithm (ICP) or mu-tual information (MI) based matching. Assumptions required for such solutions are not perfectly verified in this context. Surgical tools may occur the operative field of view (FOV). Deformations imply non linear displacements of anatomical landmarks in any di-rection. Since the quantification of surface deformations is strongly related to the surface registration step, accurate surface matching is required. This method has to be adapted to the specificities of these video surgical images.
In this paper, we propose a new surface registration for video-based analysis of intraoperative brain deformations. This registra-tion method includes three terms: the first term is related to im-age intensities, the second to Euclidean distance and the third to anatomical landmarks continuously tracked in 2D video.
In the next sections, we describe the computation of surfaces of the operative field using stereoscopic reconstruction, the continuous tracking of anatomical landmarks in the video sequence between two reconstructed surfaces and the surface registration method for matching both reconstructed surfaces. We have shown in [15] that the accuracy of our reconstruction method was sufficient to do quantification of surface deformation. Performance evaluation of video tracking is described. Performance of the proposed surface registration method is compared to usual method (i.e., ICP).
2 MATERIAL ANDMETHODS
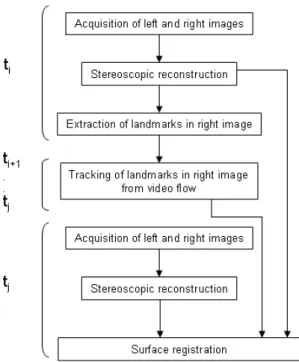
The image acquisition and registration workflow, repeated each time we wish to estimate deformations, is now described. As shown on figure 1, at surgical time ti, a pair of video static images, as seen through surgical microscope binoculars, were acquired. Stereo-scopic reconstruction methods were applied on these images and provided a 3D surface of the operative field as explained in section 2.2. At time ti, anatomical landmarks were automatically extracted from the right image as explaine in subsection 2.3.1. Video flow from the right ocular was continuously acquired from tito tj. The extracted anatomical landmarks were continuously tracked in im-ages, in 2D, from the video flow using the method described in subsection 2.3.2. At time tj, a new pair of video images was ac-quired and a new surface was reconstructed. Matching both tiand
tjsurfaces was performed using the proposed surface registration method, descibed in section 2.4, taking into account new locations of tracked anatomical landmarks.
HAL author manuscript inserm-00109455, version 1
HAL author manuscript
Figure 1: Image acquisition and registration workflow
2.1 Acquisition
A stereovision system (Zeiss 3-D Compact Video Camera S2, Carl Zeiss, Germany) was set up between the NC4 surgical microscope and the binocular tube (as shown in figure 2). Images from these analogical cameras have been acquired using a video acquisition card PICOLO, Euresys, Belgium.
Each acquisition consisted of:
- At time ti, one static pair of images from both left and right surgical microscope oculars, along with position and settings of the microscope,
- A 2D video flow from the right ocular, whose first frame is the static right image at tiand last frame is the static right image at time tj,
- At time tj, one static pair of images from both left and right surgical microscope oculars, along with position and settings of the microscope,
Positions and settings of the microscope were obtained using the neuronavigation system StealthStation, Medtronic SNT, USA and a communication library called StealthLink, Medtronic SNT, USA.
2.2 Surface mesh reconstruction
Cortical surfaces were computed by dense reconstruction of micro-scope stereoscopic images as explained in [15]. Relation between a 3D point from the stereoscopic surface mesh and a pixel in the right image was known. We sum up the method here.
2.2.1 Stereoscopic cameras calibration
The first calibration step consisted of finding intrinsic and extrinsic parameters for each camera using a calibration grid. To avoid up-dating calibration every time the microscope moved, extrinsic and intrinsic parameters were expressed in the microscope coordinate
Figure 2: Clinical setting: a stereovision system (in RED, cameras and cables) was set up between the NC4 surgical microscope and the binocular tube.
system.The second step was to compute the rectification matrices of the stereovision system. In a stereovision system, a point in the left image and its corresponding point in the right image lie in conjugated epipolar lines. Rectification consisted of projecting onto a common plane in order to make the conjugated epipolar lines collinear and parallel to the horizontal image axis. Calibration was performed for the minimum and maximum focal length values and the results were subsequently available for use in all surgical pro-cedures. No additional calibration was required.
2.2.2 3D surface Reconstruction
During surgery, each new image pair was rectified. Owing to recti-fication, a pixel of coordinate (u, v) in the rectified left image cor-responded to the pixel of coordinate (u + d, v) in the rectified right image where d denotes the disparity.
The disparity value was estimated by point matching based on max-imization of the zero-mean normalized sum of squared differences criteria. A surface mesh was computed, composed of triangles for which each vertex had been computed from the disparity map. 2.2.3 Textured surface
Each surface mesh was textured by mapping the right image. In-deed, for each vertex of the surface mesh, the corresponding pixel in the disparity map and consequently in the right rectified image was known. Then, the corresponding pixel in the right image was computed using the inverse rectification matrix.
2.3 Video-based anatomical landmarks matching
2.3.1 Anatomical landmarks extraction and segmentation of the operative field
The cerebral vessels were used as anatomical landmarks for the video tracker. These anatomical landmarks were automatically identified [Fig. 6. The automatic extraction algorithm is divided into three parts: preprocessing, segmentation and detection. We describe the algorithm applied to an image I.
A mathematical morphological opening was applied to I. Then I was filtered by Laplacian and Gaussian filters. The resulting image is called the preprocessed image Ip.
Anatomical landmarks lied on the cortex surface. Tissues must then be removed from our images. To segment the operative field, the binary image Ip was scanned horizontally from left to right then from right to left in order to locate 255-luminance-level pixels first met in each direction. These pixels defined the bends of the first mask. A new square mask of size 400 pixels was then defined. The center of this mask was defined as the gravity center of the first mask after a mathematical morphology opening. The convolution of this new mask and Ip was scanned as previously explained to segment the operative field. A mathematical morphology opening was then applied to the scanned image to obtain the final mask.
The landmarks extraction was performed on the result of the con-volution between the final mask and Ip, i.e., the segmentation step result. For extraction, Harris detector [7] was used. The landmarks extracted by this detector were defined as the local maxima of the operator R: R = det(M) −λTr2(M) with λ= 0.04 (1) where M = Ã (δδIx)2 (δI δx)(δ I δy) (δI δx)(δ I δy) (δδyI)2 ! (2)
det(M) and Tr(M) stand for the determinant and the trace of the
matrix M respectively; I stands for the convolution between the fi-nal mask and Ip, x and y are coordinates of pixels in I.
Among these local maxima, some points are extracted due to image specularities. Points with an intensity higher than 80% of the max-imal intensity of the image were rejected.
The result of this step was a file with the 2D coordinates of the landmarks in static right image. These anatomical landmarks were then tracked in the 2D video flow, as described in the following paragraph.
2.3.2 Tracker with an a priori evolution model
The introduction of an evolution model in the tracking procedure leads to consider the filtering algorithms family (e.g. Kalman filter [1], particle filters [6], etc.). Such algorithms are well-known for their simplicity and robustness in difficult situations such as occlu-sions, noise, and ambiguities generated by a cluttered background. The filtering methods consist in modeling the dynamic system to be tracked by a hidden Markov process. The goal is to estimate the values of the state xkfrom observations zkobtained at each instant. The system is described by a dynamic equation modeling the evolu-tion of the state and a measurement model that links the observaevolu-tion to the state. The unknown state of the system can be the feature lo-cation with possible additional information such as its velocity, or its intensity template.
Measurement model At time k, we assume that the observa-tion is the result of a matching process whose goal is to provide the point in image Ikthat is the most similar to the initial point x0. Sev-eral matching criteria can be used to quantify the similarity between the target point and the candidate points. The conservation of the intensity pattern assumption has simply brought us to consider the sum-of-squared-differences (SSD). The resulting linear observation equation is:
zk= H xk+ wk, (3) where H is the transformation matrix between the state space and the measurement space (H is the identity matrix if xkis simply the feature location) and wk is a zero-mean Gaussian white noise of covariance Rk. Although theSSDmay have some difficulties with illumination or geometric changes, this choice is justified by the fact that it makes possible an automatic evaluation of the confidence of the correlation peak (i.e. of Rk), taking into account the image
noise. To that purpose, theSSDsurface centered on zkis modeled as a probability distribution of the true match location. A Chi-Square “‘goodness of fit” test is realised, in order to check if this distri-bution is locally better approximated by a Gaussian or a uniform law. An approximation by a Gaussian distribution indicates a clear discrimination of the measure, and Rkis therefore set to the local covariance of the distribution. On the contrary, an approximation by a uniform distribution indicates an unclear peak detection on the response distribution. This may be due to an absence of correlation in presence of occlusions or noisy situations. In this case, the di-agonal terms of Rkare fixed to infinity, and the off-diagonal terms are set to 0. This estimation allows the tracker to be robust to oc-clusions. More details on this stage may be found in [2].
Once the measurement model is defined, an appropriate dynamic model has to be build.
Dynamic model In that case, models were defined according to the surgical procedure (i.e., different surgical steps). The state xk is then defined by (mk−1mknk−1nk)Twhere (mk, nk)T is the esti-mated feature location at time k. The following dynamic equations have been considered :
xk+1= Fixk+ bi+ vk (4) where vkis a zero-mean Gaussian white noise of covariance Qk fixed a priori, and i is the index of the process (F, b).
F1= 0 1 0 0 0 0 0 0 0 0 0 1 0 0 0 0 , b1= m0 m0 n0 n0 F2= 0 1 0 0 1 2 1 2 0 0 0 0 0 1 0 0 12 12 , b2= 0 0 0 0
F1lies on a stationary hypothesis and F2is a regressive process of 2th order. The resulting systems are linear and can be solved using
the Kalman filter [1].
2.4 Surface registration and cortical deformation estimation
The cortical deformation was estimated by a non linear geometrical transforamtion computed by registration between two reconstructed 3D surfaces. The surface registration method relies on relevant in-formation available at the different surgical steps. Consequently, a chronological description will be given in section 3. In this section, we describe the different stages of the image processing workflow. 2.4.1 First approximation of the surface deformation using
anatomical landmarks
The 3D location of each landmark at tiand tjwas known: the right image was related to the disparity map by rectification and the dis-parity map was related to each vertex of the 3D surface mesh. A sparse deformation field was then computed between 3D location of landmarks at times tiand tj.
From this sparse deformation field, a dense deformation field was computed by thin-plate-spline interpolation. This dense deforma-tion field was considered as a first approximadeforma-tion of the final com-puted deformation. In other words, anatomical landmarks are used as control points of the spline deformation.
2.4.2 Surface based registration
We propose a new surface registration method. The cost function includes three terms: the first is related to image intensities, the sec-ond to Euclidian distance between surfaces and the third to distance
between tracked landmarks. The objective of this method is to be able to deal with the different aspects of complexity encountered in the images all along the surgical procedure.
F =β(αA + (1 −α)B) + (1 −β)C (5) This equation is further described below.
A: Intensity term In our specific images, the luminance level
is strongly correlated with the green level. Since our image were acquired in RGB, green canal was directly used.
A(P0, P1) =
C3×21(Greenn) +C3×21(GradGreenn)(P0, P1)
2 (6)
with GradGreen = q
(Green(i, j − 1) + Green(i, j + 1))2+ (Green(i − 1, j) + Green(i + 1, j)2) where Green(i, j) is the green level of pixel which coordinates are
i, j. C3×21is the correlation coefficient computed 3 search windows of center p0and p1respectively, wihich are the pixels correspondid to the 3D points P0and P1 in 2D right images. If both intensities windows are identical, A(P0, P1) = 1.
B: Surface Euclidian distance term
B(P0, P1) =
D(P0, Pclosest)
D(P0, P1)
(7)
D(P0, P1) is the euclidean distance between 3D points P0 and P1.
Pclosest is the closest point of P0 in the target surface mesh (pre-computed by ICP). If P1is the closest point, then B(P0, P1) = 1.
C: tracked landmarks term
C(P0, P1) =ψ(P0)D(P1, P0interpolated) (8)
D(P0, P1) is the euclidean distance between 3D points P0and P1.
P0interpolated is the new location of point P0when the dense defor-mation field computed by thin plate spline using anatomical land-marks as control points was applied.
ψ(x) = N
∑
i=1 exp−kD(Ait0,x)σ(Ai t f) (9)Index 0 and t f indicates that the corresponding A are anatom-ical landmarks extracted in the first frame and the last frame respectively.x is one 3D point of a surface mesh. The function exp−kt is drawn in figure 3. It allowed to weight the importance of the dense deformation field computed from matched landmarks depending on the distance with the landmarks used to compute the deformation field.
In the varianceσ(xt fi ) is of the state estimate xt f in 2D.
Global Cost Function
F(PiS, PT j) =
β(αA(PiS, PT
j) + (1 −α)B(PiS, PTj)) + (1 −β)C(PiS, PTj) (10)
A, B, C are defined by equations 6,7 and 8 respectively. PSstands for a 3D point of the source surface mesh. PTstands for a 3D point of the target surface mesh.αandβdepends from the surgical step: when one of the surface to registered was acquired before opening the dura mater,α= 0 andβ= 1.
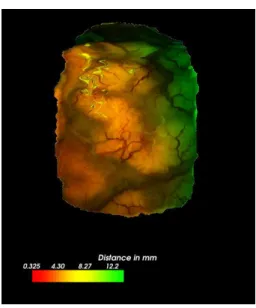
2.5 Deformation Visualization
The deformation field was visualized using a color map with a look-up table corresponding to each vector length. A bar was used to give the color scale in millimeters (see figure 8).
Figure 3: Method: Function u(t) = exp−kt used in equation 9 ofψ,
with k computed for u00(0) = 10
Table 2: Description of the performance evaluation procedure of our video tracking filter
Evaluation data sets 4 video sequences for 3 patients (see Table 1) Input parameters Surgical step, nature of feature
acquisition frequency
Reference Point trajectory acquired
manually by one observer Estimated error related to Error between 2 points identified the computation of reference 3 times by 2 observers
Evaluation metric Euclidean distance Discrepancy between tracked points Euclidean distance in pixel and reference
Quality indices Mina, 1stquartilea, mediana, meana, 3rdquartileamaxa, timeb ain pixel;bin second
2.6 Performance evaluation
In this paper, we present the performance evaluation of both video tracker algorithm and the global surface registration algorithm.
2.6.1 Video tracker performance evaluation
For the performance evaluation of the video tracker, four sequences from three clinical cases described in Table 1 have been studied. The first frame of each sequence is shown figure 4. A sequence was composed of about 50 RGB frames acquired in 768 × 576 pix-els with different acquisition frequency (from 1 to 5 frames per second). Tracking was done on grey images. In a first step, only video displaying the cortical surface, with no magnification, focus or camera position changes have been considered. The difficulties of these images are occlusions, specularities and deformations of the cortical surface. We evaluated the performance our tracking al-gorithm with an a priori evolution model depending of the step of the surgery. The evaluation has been done on 34 anatomical land-marks . It has been realized off-line simulating a video flow using four archived videos of three clinical cases.
A standardized framework, as suggested in [9], has been ap-plied to describe the performance evaluation procedure (see Table 2). The mean Euclidean distance between each point, manually se-lected when visible, and the position estimated by the tracker for that point was computed throughout the 4 sequences.
Table 1: Performance evaluation of the video tracking: short description of the video sequences. Patient 1 was a 44-years-old woman with a right frontal cavernoma, Patient 2 was a 29-years-old man with tumor located in the right inferior frontal gyrus and Patient 3 was a woman with right rolandic cavernoma.
Index Sequence 1 Sequence 2 Sequence 3 Sequence 4
Patient Patient 1 Patient 2 Patient 3 Patient 3
Step During removal After duramater opening and After duramater During tumor removal of the cavernoma with a surgical tool with 2 big heart pulsations with 3 surgical tools
Nb fr* 40 54 47 64
AF** 1 1 5 5
Nb NL*** 5 11 11 6
Occlusion no yes no yes
*Nb fr stands for number of frames, **AF stands for acquisition frequency in frame per seconds, ***Nb NL stands for number of anatomical landmarks to track
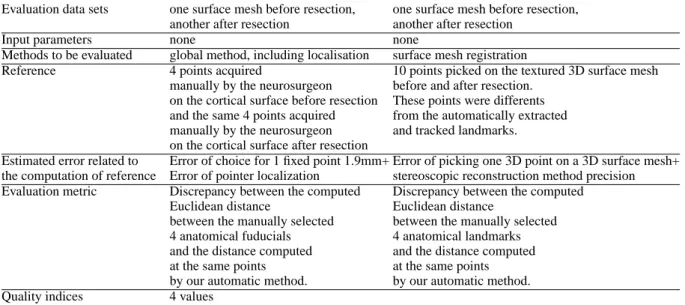
Table 3: Description of the performance evaluation procedure used to clinically assess the performance of our surface registration method Evaluation data sets one surface mesh before resection, one surface mesh before resection,
another after resection another after resection
Input parameters none none
Methods to be evaluated global method, including localisation surface mesh registration
Reference 4 points acquired 10 points picked on the textured 3D surface mesh manually by the neurosurgeon before and after resection.
on the cortical surface before resection These points were differents and the same 4 points acquired from the automatically extracted manually by the neurosurgeon and tracked landmarks. on the cortical surface after resection
Estimated error related to Error of choice for 1 fixed point 1.9mm+ Error of picking one 3D point on a 3D surface mesh+ the computation of reference Error of pointer localization stereoscopic reconstruction method precision Evaluation metric Discrepancy between the computed Discrepancy between the computed
Euclidean distance Euclidean distance
between the manually selected between the manually selected 4 anatomical fuducials 4 anatomical landmarks and the distance computed and the distance computed at the same points at the same points by our automatic method. by our automatic method. Quality indices 4 values
2.6.2 Performance evaluation of our surface registration method Two methods were used to evaluate the performance of our surface registration method.
In order to evaluate the global clinical accuracy of our method, 4 points were localized on the brain surface by the neurosurgeon us-ing the neuronavigation system pointer tip at two different moments of the surgical procedure. In order to ensure the same anatomical location for the second acquisition of these 4 points, the surgeon referred to a printed picture where the first-step points were identi-fied.
In order to evaluate the surface registration method, we picked 3D coordinates of anatomical landmarks in source and target surface meshes. These picked anatomical landmarks were different from the tracked ones.
3 RESULTS
3.1 Video tracking
Results of performance evaluation described in section 2.6.1 are shown in Table 4. The model choice was depending of the sequence
movements. The estimated reference error, as described in table 2, was of 2 pixels in each vertical and horizontal directions. For indication, with a minimal zoom, 1 pixel represented 0.1 mm. As it can be read in the table, the points were not successfully tracked during the whole sequence. However, the error was inferior for all the landmarks to 10.7 pixels for 75% of the sequences 1, 2, for 100% of the sequence 3, and for 50% of the sequence 4. Even if the points are not perfectly tracked during the whole sequence, results are within 1mm, despite of occlusions or image specularities apparition. The accuracy of our tracking method is then sufficient to be used in brainshift quantification.
3.2 Clinical case
The studied clinical case for our surface registration method was a cavernoma, located in the right frontal gyrus.
Before craniotomy In this case, no acquisition was done at
this step. However, when done in other surgical cases, in order to correct the registration in the area of surgical interest, the skin reconstructed surface mesh can be rigidly registered with the skin
Figure 4: Performance evaluation of our video tracking method: from top to bottom and from left to right: Video sequences 1-4 with marked points corresponding to points to track. In this performance evaluation step, the marked points were extractxted manually.
Table 4: Results for all anatomical landmarks for the performance evluation of our video tracking method: Distance statistics between manually tracked pixel and pixel tracked using the automatic and real time tracker are given in pixel. The computation time is given in seconds with a CPU of 1.60GHz.
Sequence Model Min\ 1stQuartile\Median\Mean\ 3rdQuartile\Max Computation time Sequence 1 Model (F1, b1) 0.0 \ 3.6 \ 6.5 \ 6.9 \ 9.3 \ 19.7 5
Sequence 2 Model (F2, b2) 0.0 \ 2.2\ 4.1\ 7.3 \ 8.2 \ 36.7 12 Sequence 3 Model (F1, b1) 0.0 \ 1.4 \ 2.8 \ 3.2 \ 4.3 \ 10.6 11 Sequence 4 Model (F1, b1) 0.0 \ 5.0\ 7.7 \ 10.7 \ 15.8 \ 28.9 10
surface segmented from the preoperative MRI and registered using the transformation computed by the neuronavigation system.
After craniotomy and before opening the dura mater
The difference of localization between the dura mater surface mesh and the dura mater surface in the preoperative exam could be ex-plained as following. It has been shown that current neuronaviga-tion systems may have an intrinsic registraneuronaviga-tion error. Addineuronaviga-tionally, brain deformation may occur between craniotomy and dura mater opening. This deformation may have a mean of 3mm in the gravity direction and 3.9 mm in the perpendicular direction as shown by Letteboer in [10] using intraoperative ultrasounds onto 12 patients. Finally, the intrinsic error of the stereoscopic reconstruction method may introduced an error inferior to 1 mm. [15].
After dura-mater openning A new surface mesh was
recon-structed after duramater opening and the video start acquisition sig-nal was given. Anatomical landmarks were automatically extracted using the method described in 2.3.1; the automatically extracted landmarks are shown in figure 6. This reconstructed surface mesh was registered to the one acquired before duramater opening using the information available: the Euclidean distance between points.
After resection After resection, the video end signal
acquisi-tion was given and a new surface mesh was acquired.
Accuracy evaluation The performance evaluation procedure
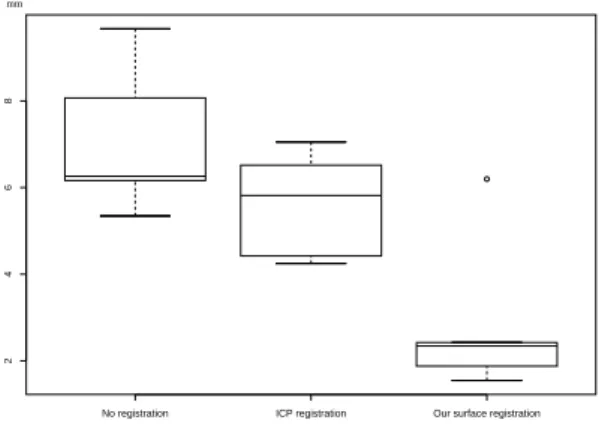
was described in subsection 2.6.2 The distance between points lo-cated by the neurosurgeon using the neuronavigation system (see figure 9 for reference name) was of 1.9mm for point A, 8.0mm for point B, 2.58mm for point C and 7.8mm for point D. The dis-tance of 1.9 mm can be considered as the intrinsic reference er-ror, since point A was chosen with a static frame (i.e.,the operative field). This shows that the visual matching done by the neurosur-geon is not accurate since the neuronavigation optical tracker is said to have a millimetric accuracy. All landmarks manually identified –by neurosurgeon using the pointer or by picking the points on the 3D reconstructed surface meshes– were diffrent from automatically extracted and used for the video tracking. Figure 10 shows the dis-tance computed between 3D landmarks manually selected in 3D surface source and target surface, when source surface is the structed surface before resection, and target surface is the recon-structed surface after resection. Results of our registration method is within 2 mm, when ICP found an error within 6mm. Using ICP, surface are closed, but the correct points are not matched together.
Figure 5: Results: Reconstructed surface of the dura mater superim-posed to the preoperative MRI using the image-to-patient registration matrix computed by the neuronavigation system. The center of the orange circle is the neuronavigation pointer tip, touching the corti-cal surface. The fact that the pointer tip was not perfectly aligned with the preoperative images registered on the patient confirmed the deformations occurring at the craniotomy. Consequently, the image-to-patient registration matrix was obsolete.
Figure 6: Results: anatomical landmarks automatically extracted. Left, the segmented operative field using our automatic method. Right,15 best landmarks (15 maxima values of Harris detector) using our automatic extraction method: these 15 landmarks were tracked into the video flow.
Figure 7: Clinical case: surface mesh displayed in the preoperative MRI. The white surface mesh is the dura mater surface mesh. The red one is the surface acquired just after the opening of the dura mater. The green one was acquired at the end of the cavernoma removal.
Figure 8: Clinical case: deformation field represented by a color map between reconstructed surface mesh before resection and re-constructed surface mesh after restecion computed by our surface registration method.
Figure 9: Performance evaluation of our registration method: refer-ence. Top: Points localized by the neuronavigation system, shown by the neurosurgeon on a intraoperative printed picture; left, acquisition just after dura mater opening and before surface mesh acquisition; right, acquisition after resection and after surface mesh acquisition. Bottom: surface mesh reconstructed just after dura mater opening, with transparency properties; spheres 10mm of diameters. Centers of green spheres are tip of neuronavigation system pointer acquired just after dura-mater openning, red ones are tip of the neuronavigation system pointer acquired after resection.
2
4
6
8
No registration ICP registration Our surface registration mm
Figure 10: Results: The source surface was the reconstructed face before resection, the target surface was the reconstructed sur-face after resection. 9 anatomical landmarks have been used for this quantification and were not the tracked ones. Left box plot, distance computed between 3D ladmarks manually selected in source and tar-get surface; middle box plot: distance computed between landmarks in source registered by ICP and target; right boxplot: distance com-puted between landmarks in source registered by our method and target
4 DISCUSSION
4.1 Surface Registration: comparison with other works
We have shown in [15] that the accuracy of our reconstruction method was sufficient to do quantification of surface deformation. In this paper, we have presented a new surface registration method which can be used with any cortical surface textured point cloud computed by stereoscopic or laser range approaches. We have shown the global method, including stereoscopic reconstruction, had a precision within 2 millimeters, which is within the usual rigid registration error of the neuronavigation system before deforma-tions.
The hypothesis of registering two textured surface meshes using distance-based algorithm as ICP [17] is not justified, since the clos-est point could not be the matching point, as shown by the results. Miga [12] used an intensity-based algorithm to register preopera-tive segmented cortex expressed as a textured point cloud using ray casting and a laser range scanning associated with a video camera. Images from video cameras are subject to occlusions by blending or tools in the surgical FOV, especially during and after resection. Therefore, MI may not be the most relevant solution in this case. Using cortical vessels for cortical surface registration has been pre-viously proposed by Nakajima [13]. In [13], the vessels were used as anatomical landmarks, but their intraoperative position was man-ually defined using the neuronavigation system.
In [14], heart motion was tracked using landmarks time series, cou-pling with electrocardiogram and respiration pressure signals in case of occlusion, for endoscopic cardiac surgery. In [16], the fil-ter used was not robust to occlusions and relied on the hypothesis of small inter-frame motion. Anatomical landmarks video track-ing was also used to track deformations in bronchoscopy [5]. Our method could be applied in this context.
4.2 Brainshift analysis global framework
Surface deformation can not be directly extrapolated to subsur-face volume, as it was shown in [8]. Here, the goal of sursubsur-face quantification is to have an explicit and quantitative detection of deformation, instead of the tacit one. Usually, quantifying the distance between preoperative and intraoperative shifted cortex
surfaces is done using the neuronavigation system pointer. Here we propose to use the whole surface of the stereoscopic FOV instead of a limited number of points. Moreover, having 2 video flows acquired from left and right oculars will allow real time or near real time computing of 3D positions of the tracked anatomical landmarks using spars stereopsis. It will then be possible to interpolate the computed deformation field until the covariance estimation error become too high. At this point, a new surface acquisition (by stereoscopic reconstruction) is necessary. The real time surface deformation field could be used as a constraint to intraoperative volume registration, using intraoperative volume image [3], biomechanical or statistical models [11].
Future work will consist in the definition of a priori models that depends on the surgical step. Model mixture and Gaussian weighting could be used to define which model has to be used and consequently detect automatically the surgery step. Moreover, constraints such as gravity direction, surgical tool, or known deformation parameters could be inserted as a priori knowledge. In this way, we hope to be able of to detect automatically when deformations are important and, therefore, when intraoperative volumic image acquisition is required.
New medical imaging standards such as DICOM WG 13 – that allows storing digital video along with patient data – open a new research area and makeossible the introduction of new methods and tools in image guided surgery. Some microscopes are able to store the digital video (Pentero, Carl Zeiss, Germany). Access or choice of video to be archived, as well as browsing of hours of video are still opened issues. We believe that video in visible light is becom-ing a challengbecom-ing issue in computer assisted surgery.
REFERENCES
[1] BDO Anderson and JB Moore. Optimal Filtering. Englewood Cliffs, NJ : Prentice Hall, 1979.
[2] Elise Arnaud, Etienne Memin, and Bruno Cernuschi-Fras. Condi-tional filters for image sequence-based tracking - application to point tracking. IEEE Transactions on Image Processing, 14(1):63–79, 2005. [3] O Clatz, H Delingette, IF Talos, AJ Golby, R Kikinis, FA Jolesz, N Ayache, and SK Warfield. Robust nonrigid registration to cap-ture brain shift from intraoperative mri. IEEE Trans Med Imaging., 24(11):1417–27, 2005.
[4] J Cohen-Adad, P Paul, X Morandi, and P Jannin. Knowledge model-ing in image guided neurosurgery: application in understandmodel-ing intra-operative brain shift. In SPIE Medical Imaging: Visualization,
Image-Guided Procedures and Display, 2006.
[5] Fani Deligianni, Adrian Chung, and Guang-Zhong Yang. Predictive camera tracking for bronchoscope simulation with condensation. In James S. Duncan and Guido Gerig, editors, MICCAI, volume 3749 of
Lecture Notes in Computer Science, pages 910–916. Springer, 2005.
[6] A Doucet, N de Freitas, and N Gordon, editors. Sequential Monte
Carlo methods in practice. New York: Springer-Verlag, Series
Statis-tics for Engineering and Information Science, 2001.
[7] C Harris and M Stephens. A combined corner and edge detector. In
Proc. of the 4th Avey Vision Conference, pages 147–151, 1988.
[8] T. Hartkens, D. L. G. Hill, A. D. Castellano-Smith, D.J. Hawkes, C. R. Maurer, A. J. Martin, W. A. Hall, H. Liu, and C. L. Truwit. Measure-ment and analysis of brain deformation during neurosurgery. IEEE
Transactions on Medical Imaging, 22(1):82–92, 2003.
[9] P Jannin, M Fitzpatrick, D Hawkes, X Pennec, R Shahidi, and M Van-nier. Validation of medical image processing in image-guided therapy. 21(11):1445–1449, 2002.
[10] M M J Letteboer, P W A. Willems, M A Viergever, and W J Niessen. Brain shift estimation in image-guided neurosurgery using 3-d ultra-sound. IEEE Trans Biomed Eng., 52(2):268–76, 2005.
[11] M I Miga, T K Sinha, and D M Cash. Biomechanics Applied to
Com-puter Assisted Surgery, chapter Techniques to Correct for soft Tissue
Deformations during Image-Guided Brain Surgery. Research Signpost Publications, 2005.
[12] M I Miga, T K Sinha, D M Cash, R L Galoway, and R J Weil. Cor-tical surface registration for image-guided neurosurgery using laser-range scanning. IEEE Transactions on Medical Imaging, 22(8):973– 85, 2003.
[13] S Nakajima, H Atsumi, R Kikinis, TM Moriarty, DC Metcalf, A Jolesz, and PMcL Black. Use of cortical surface vessel registra-tion for image-guided neurosurgery. Neurosurgery, 41:1209, 1997. [14] T Ortmaier, M Groger, DH Boehm, V Falk, and G Hirzinger.
Mo-tion estimaMo-tion in beating heart surgery. IEEE Trans Biomed Eng., 52(10):1729–40, 2005.
[15] P Paul, O Fleig, and P Jannin. Augmented virtuality based on stereo-scopic reconstruction in multimodal image-guided neurosurgery: Methods and performance evaluation. Medical Imaging, IEEE
Trans-actions on, 24(11):1500–1511, 2005.
[16] D Stoyanov, GP Mylonas, F Deligianni, A Darzi, and G-Z Yang. Soft-tissue motion tracking and structure estimation for robotic assisted mis procedures. In MICCAI (2), pages 139–146, 2005.
[17] H Sun, D W Roberts, H Farid, Z Wu, A Hartov, and K D Paulsen. Cortical surface tracking using a stereoscopic operat-ing microscope.neurosurgery. Operative Neurosurgery Supplement, 56(1):86–97, 2005.