AGROCAMPUS OUEST CFR Angers CFR Rennes Année universitaire :2019-2020 Spécialité : ………Agronomie………… Spécialisation (et option éventuelle) : ………Agroecology……….
Mémoire de Fin d'Études
d’Ingénieur de l’Institut Supérieur des Sciences agronomiques, agroalimentaires, horticoles et du paysage
de Master de l’Institut Supérieur des Sciences agronomiques, agroalimentaires, horticoles et du paysage
d'un autre établissement (étudiant arrivé en M2)
Par : Mélina COINTE
Soutenu à RENNES le* 09/09/2020 Devant le jury composé de : Président :
Maître de stage : Enseignant référent :
Autres membres du jury (Nom, Qualité)
Ce document est soumis aux conditions d’utilisation
«Paternité-Pas d'Utilisation Commerciale-Pas de Modification 4.0 France» disponible en ligne http://creativecommons.org/licenses/by-nc-nd/4.0/deed.fr
Les analyses et les conclusions de ce travail d'étudiant n'engagent que la responsabilité de son auteur et non celle d’AGROCAMPUS OUEST
©Mélina Cointe
Unintentional effects of biopesticides on
biocontrol agents
Mme Pérès Guénola
Mme Van Oudenhove Louise Mr Plantegenest Manuel
ACKNOWLEDGMENTS
First, I would like to thank my two supervisors Louise Van Oudenhove and Vincent Calcagno for having me in their project and for having given me the opportunity to express freely my own ideas. I would also like to thank them for their passion, their advice, and their attention, especially during the period of the lockdown. It has represented a real motivation and helped me to keep going even in these unusual work conditions.
The second person I would like to thank is Manuel Plantegenest, my internship tutor. Even if we did not exchange a lot, he always demonstrated a great availability which has been really reassuring. Moreover, thanks to his quick answers at the beginning of my internship, I have been able to steer my report and my analysis to the right track quite quickly.
Then, I would like to thank my laboratory team within which I have been lucky to work. I would like to thank especially Louise, Guy, Lydia, Cécile, Hicham and Julie for always having been in such a good mood and for having demonstrated a lot of attention and care towards me. Special thanks to Guy and Lydia for their help during my laboratory experiments.
Finally, I would like to thank my best friend Margaux for her care and love. Thank you for having made the lockdown a joyful period, within which it was easy to work and to carry out my internship. Thank you also for your unfailing and long-distance support which helped me for six months and which will help me for the next coming years.
SUMMARY
1- Introduction ... 1
2- Material and methods ... 4
2.1 Biological materials for the experiments ... 4
2.1.1 Trichogramma species and rearing conditions ... 4
2.1.2 Essential oils ... 6 2.2 Olfactometry ... 6 2.2.1 Experimental device ... 6 2.2.2 Protocol ... 7 2.2.3 Analysis ... 8 2.3 Observations of videos... 9 2.3.1 Manual protocol ... 9
2.3.2 Manual observations’ statistical analysis ...10
2.3.3 Automatic video processing protocol ...10
2.3.4 Computation of trajectory metrics ...12
3- Results ...12
3.1 Olfactometry ...12
3.1.1 Check of the random repartition of the individuals in the olfactometer ...12
3.1.2 Effect of the different tested essential oils on the different strains of trichogramma ...13
3.2 Observations of videos...14
3.2.1 Manual observations ...14
3.2.2 Automatic video analyses ...16
4- Discussions ...17
5- Conclusion and perspectives ...20
BIBLIOGRAPHY ...22
LIST OF ABBREVIATIONS
AIC: Akaike Information Criterion ACHE: Acetylcholinesterase CT: Chemotype
EO: Essential Oil
FDR: False Discovery Rate GLM: Generalized Linear Models
GlmmTMB: Generalized Linear Mixed Models using Template Model Builder HR: Humidity Rate
IPM: Integrated Pest Management PCA: Principal Component Analysis T: Temperature
TABLE OF APPENDICES
Appendix I: Graphs representing the different evolution of the proportions of individuals in the odour zones for pure Cineole on T.cacoeciae, strain ACJY144
Appendix II : Graphs representing the different evolution of the proportions of individuals in the odour zones for Cineole 1/10% i.e 0.05 and 0.5 µL on T.cacoeciae, strain ACJY144
Appendix III : Graphs representing the different evolution of the proportions of individuals in the odour zones for Cineole 20/30% i.e 1 and 1,5µLon T.cacoeciae, strain ACJY144
Appendix IV : Graphs representing the different evolutions of the proportions of individuals in the odour zones for the ten essentials on T.cacoeciae, strain PJ
Appendix V : Summary table of the different effects of essential oils on T.cacoeciae
Appendix VI : PCA representing the three studied variables at three different times for the strain ACJY144: Proportion of individuals at 2, 7 and 14 min (Prop_Ind_2, Prop_Ind_7), Activity rate at 2, 7 and 14 min (Act_Rate_2, Act_Rate_7, Act_Rate_14 ), and Jump’s frequency 2, 7 and 14 min (Jumps_Freq_2, Jumps_Freq_7, Jumps_Freq_14 )
Appendix VII : Average jump’s frequency observed through time for the ten essential oils tested on T.cacoeciae ACJY144. C: the controls, O: Odour Zone, Oless: Odourless Zone. The error bars correspond to twice the standard error i.e an estimation of the confidence interval at 95%
Appendix VIII : Average activity rate observed through time for the three modalities of cineole tested on T.cacoeciae ACJY144. C: the controls, O: Odour Zone, Oless: Odourless Zone. The error bars correspond to twice the standard error i.e an estimation of the confidence interval at 95%. Cineole i.e Pure Cineole, Cineole1_10 i.e 0.05µL and 0.5µL, Cineole20_30 i.e 1 and 1,5µL
Appendix IX : Average jump’s frequency observed through time for the three modalities of cineole tested on T.cacoeciae ACJY144. C: the controls, O: Odour Zone, Oless: Odourless Zone. The error bars correspond to twice the standard error i.e an estimation of the confidence interval at 95%. Cineole i.e Pure Cineole, Cineole1_10 i.e 0.05µL and 0.5µL, Cineole20_30 i.e 1 and 1,5µL
Appendix X : PCA representing the three studied variables at three different times for T.cacoeciae PMBIO1: Proportion of individuals at 2, 7 and 14 min (Prop_Ind_2, Prop_Ind_7), Activity rate at 2, 7 and 14 min (Act_Rate_2, Act_Rate_7, Act_Rate_14 ), and Jump’s frequency 2, 7 and 14 min (Jumps_Freq_2, Jumps_Freq_7, Jumps_Freq_14 )
Appendix XI : Average jump’s frequency observed through time for the ten essential oils tested on T.cacoeciae PMBIO1. C: the controls, O: Odour Zone, Oless: Odourless Zone. The error bars correspond to twice the standard error i.e an estimation of the confidence interval at 95%
Appendix XII : Average activity rate observed through time for the ten essential oils tested on T.cacoeciae PMBIO1. C: the controls, O: Odour Zone, Oless: Odourless Zone. The error bars correspond to twice the standard error i.e an estimation of the confidence interval at 95%
Appendix XIII : PCA representing the three studied variables at three different times for the strain PJ: Proportion of individuals at 2, 7 and 14 min (Prop_Ind_2, Prop_Ind_7), Activity rate at 2, 7 and 14 min (Act_Rate_2, Act_Rate_7, Act_Rate_14 ), and Jump’s frequency 2, 7 and 14 min (Jumps_Freq_2, Jumps_Freq_7, Jumps_Freq_14 )
Appendix XIV : Average activity rate observed through time for the ten essential oils tested on T.cacoeciae PJ. C: the controls, O: Odour Zone, Oless: Odourless Zone. The error bars correspond to twice the standard error i.e an estimation of the confidence interval at 95%
Appendix XV : Average jump’s frequency observed through time for the ten essential oils tested on T.cacoeciae PJ. C: the controls, O: Odour Zone, Oless: Odourless Zone. The error bars correspond to twice the standard error i.e an estimation of the confidence interval at 95%
Appendix XVI : Evolution of the individuals’ activity rate for the different zones through time for the Rosemary essential oil. The grey bar corresponds to the transition between the controls and the introduction of the odour
Appendix XVII : Evolution of the individuals’ movement sinuosity for the different zones through time for the Rosemary essential oil. The grey bar corresponds to the transition between the controls and the introduction of the odour
Appendix XVIII : Evolution of the proportions of individuals for the different zones through time for the Thyme essential oil. The grey bar corresponds to the transition between the controls and the introduction of the odour
Appendix XIX : Evolution of the individuals’ speed for the different zones through time for the Thyme essential oil. The grey bar corresponds to the transition between the controls and the introduction of the odour
Appendix XX: Graphs representing the different evolutions of the proportions of individuals in the odour zones for the ten essentials on T.cordubensis, strain PUG029
TABLE OF ILLUSTRATIONS
FIGURES
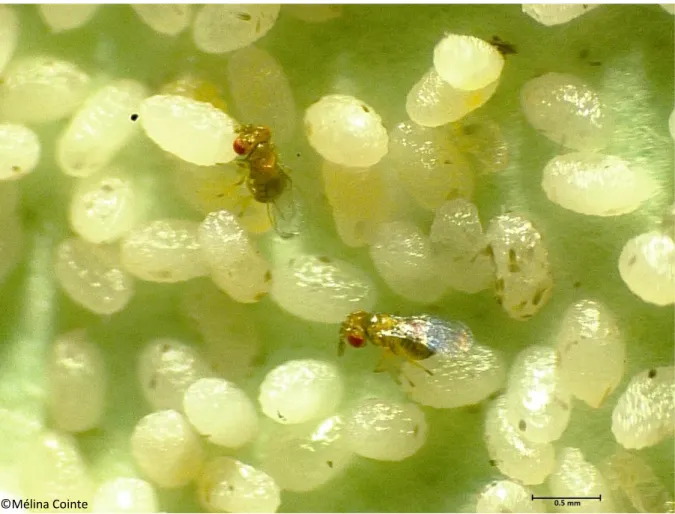
Figure 1 : Picture of two trichograms females (Trichogramma Cordubensis, strain PUG029) laying their eggs on E.Khueniella’s eggs
Figure 2 : The essential oils’ components inhibit the acetylcholinesterase (AChE) activity. Ach-acetylcholinesterase, nAChr-nicotinic acetylcholine receptors, Eos-essential oil components
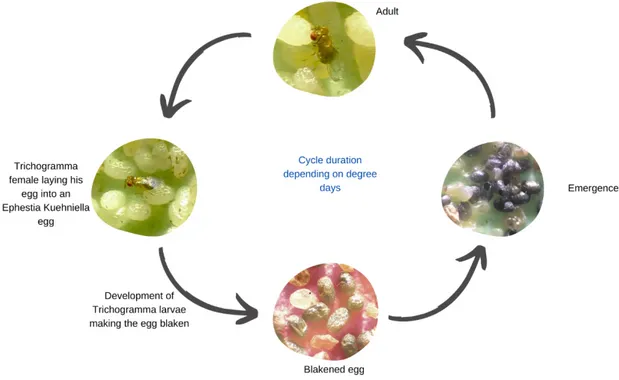
Figure 3 : Illustration of the development cycle of Trichogramma sp
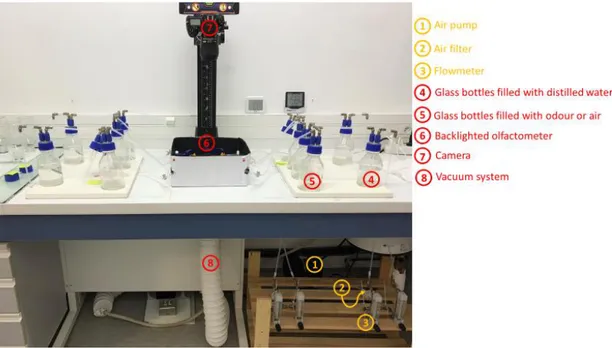
Figure 4 : Illustration of the experimental device
Figure 5 : Illustration of the olfactometer chamber
Figure 6 : Illustration of the different experimental replicates
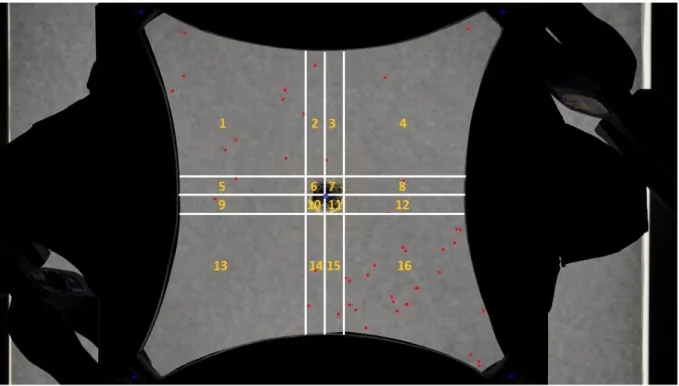
Figure 7 : Illustration of the ImageJ treatment
Figure 8 : Elbow graph for ACJY144 to determine the number of clusters that should be used
Figure 9 : Screenshot of a tracking session by Ctrax
Figure 10 : Evolution of the proportions of individuals through time for the replicate C. The lines are the proportions obtained thanks to Ctrax. The points are the ones obtained from the manual count
Figure 12 : Graphs representing the different evolutions of the proportions of individuals in the odour zones for the ten essentials on T.cacoeciae, strain PMBIO1
Figure 11 : Graphs representing the different evolutions of the proportions of individuals in the odour zones for the ten essentials on T.cacoeciae, strain ACJY144
Figure 13 : PCA representing the ten essential oils, plus the three tested modalities for cineole for T.cacoeciae ACJY144, according to the three studied variables at three different times: Proportion of individuals at 2, 7 and 14 min (Prop_Ind_2, Prop_Ind_7), Activity rate at 2, 7 and 14 min (Act_Rate_2, Act_Rate_7, Act_Rate_14 ), and Jump’s frequency 2, 7 and 14 min (Jumps_Freq_2, Jumps_Freq_7, Jumps_Freq_14 )
Figure 14 : Average activity rate observed through time for the ten essential oils tested on T.cacoeciae ACJY144. C: the controls, O: Odour Zone, Oless: Odourless Zone. The error bars correspond to twice the standard error i.e an estimation of the confidence interval at 95%
Figure 15 : PCA representing the ten essential for T.cacoeciae PMBIO1, according to the three studied variables at three different times: Proportion of individuals at 2, 7 and 14 min (Prop_Ind_2, Prop_Ind_7), Activity rate at 2, 7 and 14 min (Act_Rate_2, Act_Rate_7, Act_Rate_14 ), and Jump’s frequency 2, 7 and 14 min (Jumps_Freq_2, Jumps_Freq_7, Jumps_Freq_14 )
Figure 16 : PCA representing the ten essential for T.cacoeciae PJ, according to the three studied variables at three different times: Proportion of individuals at 2, 7 and 14 min (Prop_Ind_2, Prop_Ind_7), Activity rate at 2, 7 and 14 min (Act_Rate_2, Act_Rate_7, Act_Rate_14 ), and Jump’s frequency 2, 7 and 14 min (Jumps_Freq_2, Jumps_Freq_7, Jumps_Freq_14 )
Figure 18: Evolution of the individuals’ speed for the different zones through time for the Rosemary essential oil. The grey bar corresponds to the transition between the controls and the introduction of the odour
Figure 19 : Evolution of the individuals’ activity rate for the different zones through time for the Thyme essential oil. The grey bar corresponds to the transition between the controls and the introduction of the odour
Figure 20 : Evolution of the individuals’ movement sinuosity for the different zones through time for the Thyme essential oil. The grey bar corresponds to the transition between the controls and the introduction of the odour
Figure 17: Evolution of the proportions of individuals for the different zones through time for the Rosemary essential oil. The grey bar corresponds to the transition between the controls and the introduction of the odour
TABLES
Table 1 : Summary table of essential oils effects on various pests. The oils indicated in bold are the ones which have been used in the experiments
Table 2 : Summary table of the conducted experiments. In yellow, the experiments previously conducted in the laboratory. In green, the experiments conducted by myself
Table 3 : Essential oils’ presentation
Table 4 : Summary table of the tested parameters in Ctrax
1
1- Introduction
“Behind the discourse on sustainable development, it is actually a new social contract that is offered to farmers. And it cannot be excluded that sustainability represents, for the agriculture of the next decades, an "engine" as efficient as productivity was during the previous period” (Landais, 1998). Indeed, for several decades now, sustainability has been and still is the main focus for agronomy. This leads to the concept of agroecology which can be defined as the integrated study of the food supply as a whole, including its ecological, economic and social dimensions, or more simply as the “ecology of food systems” (Francis et al., 2003) . This sustainable approach deals with various issues such as the limitation of environmental pollution, by reducing the use of fertilizers and pesticides (Géo_rédaction, 2018). To achieve this objective, various strategies and methods can be implemented, including for instance, the use of biological control. Harry Scott Smith, an American entomologist, defined it as “the use of natural enemies (whether introduced or otherwise manipulated) to control insect pests (Smith, 1996). There are three types of biological control: by introduction (introduction of a natural enemy of exotic origin), by increase (increase in the density of natural enemies by recurrent releases), and by conservation (methods favouring the action of natural enemies already present in the system). The oophagous parasitoids Trichogramma sp. are commonly used as biocontrol agents. They are micro-hymenoptera which lay their eggs inside the eggs of their insect-hosts. They are commercialized by several companies and are the most used agents against some pests such as the corn borer (Naïbo, Druesne, 2008). Their ease of rearing on alternative hosts, and their wide geographic distribution make them interesting biological control agents (Souza et al., 2016).
However, the development of new agricultural policies may actually result in unforeseen problems for biological control and more especially in integrated pest management. For instance, in the context of the plan “Ecophyto II+” which aims to reduce by 50% the use of synthetic chemicals in agricultural practices from now until 2025 (agriculture.gouv, 2018), the use of essential oil seems to be an interesting approach. Essential oils can be defined as aromatic, volatile liquids obtained from plant material through steam distillation. These substances are chemically pure (non-diluted) compounds that are volatile under normal conditions (Ríos, 2016). Nowadays more and more studies state that essential oils are quite efficient substitutes for many synthetic insecticides. This efficiency comes from the fact that they have a widespread range of activities and most of the essential oils are lethal (table 1). Used as pesticides, the essential oils should not cause side effects on non-target insects (Regnault-Roger, 2013). But there are evidences that some essential oils utilized in integrated pest management can be harmful to these organisms. It has been demonstrated that several essential oils including tea tree, mint, Thyme, savory and clove, have a negative impact on Typhlodromus pyri (a mite, the natural enemy of the European mite (Deluche, 2019)) and honey bees by significantly increasing their mortality (Belleil, Chavassieux, 2014).
Table 1 : Summary table of essential oils effects on various pests. The oils indicated in bold are the ones which have been used in the experiments.
Essential Oil Pest Effect Source
Clove, Savoury,
Eucalyptus Potatoes downy mildew Pear tree scab Reduction of the disease progression
Vidal, 2016
Clove, Lavender Tribolium Castaneum Lethal effect Mohamed et al., 2017 Eucalyptus,
Coriander devastansLeafhopper Amrasca (Homoptera: Cicadellidae)
Inhibition of
oviposition (Saxena, Basit, 1982) Sweet flag kelp fly Coelopa frigida
(Diptera: Coelopidae) fecundity reduced Hatchability and (Ramos Ocampo, Hsia, 1986) Basil, citronela Acanthoscelides
obtectus (Coleoptera: Chrysomelidae: Bruchinae) Significant increase of the mortality Decrease of emergence Rodríguez-González et al., 2019
Fennel Rhyzopertha dominica (F.), Sitophilus zeamais
Motschulsky and Tribolium confusum
Repellent Bedini et al., 2016
Mugwort Tribolium castaneum (Herbst), Callosobruchus maculatus (F.) and Rhyzopertha dominica
Lethal effect Eljazi et al., 2020
Green Anise Turnip aphids : Lipaphis pseudobrassicae (Davis) (Aphididae:
Homoptera)
Lethal effect Sampson et al., 2005
Oregano Sitophilus oryzae (L.) (Coleoptera: Curculionidae) Rhyzopertha dominica
(F.) (Coleoptera: Bostrychidae)
Lethal effect Karan, Şimşek, 2018
Peppermint Rice Weevil: Sitophilus oryzae L.
Rice Moth: Corcyra cephalonica (St.)
Lethal effect Khani, 2012
Sweet orange Housefly : Musca domestica L. (Diptera:
Muscidae)
Lethal effect
(dehydration) Kumar et al., 2012 Rosemary Rice weevil: Sitophylus
oryzae Lethal effect Sehari et al., 2018 Thyme larvae of lesser
mealworm, Alphitobius diaperinus Panzer (Coleoptera: Tenebrionidae) Lethal effect Decrease of the young larvae growth Szczepanik et al., 2012
2 According to other laboratory studies, these essential oils also make Tryphlodromus pyri’s fertility decrease , but do not affect the viability of the descendants (Vital et al., 2018). It is possible to add that the following essential oils: Ocimum americanum, Hyptis suaveolens, and Lippia multiflora significantly decrease the parasitism rate and increase the mortality of Dinarmus basalis, a parasitoid of Callosobruchus maculatus (cowpea seeds pest) (Ilboudo, 2009).
Until today, several non-intentional effects have already been assessed on different species of Trichogramma sp. (figure 1). For instance, 10 different essential oils (andiroba, black pepper, clove, garlic, ginger, neem, oregano, peppermint, sweet orange, and Thyme) have been tested and significatively reduce the female longevity and the parasitism rate of Trichogramma pretiosum (Parreira et al., 2018). Also, T.evanescens is repulsed by various essential oils and its survival is negatively impacted (Fillaud, 2019).The reaction could actually depend on the species. Indeed, the sensitivity of the sensory system varies between the different trichogram species (Voegelé et al., 1975). That is why it is interesting to assess the effect of various essential oils on different species of trichograms.
In this work, I will look for unintentional effects on different species of trichograms. In this context, it is important to mention that the fitness of female parasitoid wasps as Trichogramma sp. depends mainly on their ability to locate and parasitise hosts. The process of parasitisation can be divided into distinct steps: habitat finding, host finding and host acceptance, which can collectively be summarised as host selection (Nordlund, 1994). Host selection thus includes a set of behaviours, determined, and influenced by a variety of stimuli. However, insect eggs are largely odorless because they do not feed, nor release faeces. Moreover, many eggs are well protected physically and/or chemically to make up for their immobility and exposure to enemies and environmental influences (Fatouros et al., 2008). Thus, foraging females of egg parasitoids e.g. Trichogramma need to overcome the difficulty to locate host eggs by exploiting different cues (Noldus, 1989). Actually, there exist volatile cues corresponding to different types of semiochemical substances: the ones coming from the host: kairomones, and the ones coming from the plants: synomones (Klowden, 2013). Synomones can be constitutively produced: Volatile Organic Compounds (VOCs), or released as a defence mechanism when plants are attacked: Herbivore Induced Plant Volatiles (War et al., 2011). VOC such as the one released by prostrate mug bean varieties can significantly attract Trichogramma ostriniae (Bai et al., 2011). In that study, a preliminary control experiment showed that in the absence of an odour source, females of T. ostriniae distribute randomly over the four flow fields of a four-armed airflow olfactometer. Then, T. ostriniae were significantly attracted to the volatiles from whole plants of different prostrate mug bean varieties. Some effects of kairomones on Trichogramma sp. have also been assessed. For instance, Trichogramma chilonis, and its host insect, Helicoverpa assulta, were studied in laboratory experiments. T. chilonis was attracted to the sex pheromone of H. assulta (Boo, Yang, 2000).
Figure 1 : Picture of two trichograms females (Trichogramma Cordubensis, strain PUG029) laying their eggs on E.Khueniella’s eggs
3 Similar results have been shown with sex pheromones of the lepidopteran hosts such as ZETA from Ephestia spp. on T.evanescens (Schöller, Prozell, 2002), as well as contact chemicals on the surface of the host eggs (Wilson, Woods, 2016) have also been identified or proposed as such cues. Females of T.maïdis are also attracted to synthetic sex pheromones and maize extracts (Kaiser, 1988).
This relies on processes of olfaction. That is the reason why it is interesting to focus on the way essential oils can impact Trichogramma.sp through olfactometry experiments. Two years ago, olfactometry experiments have already been initiated in the team that welcomed me, on three strains of T.cacoeciae: PMBIO1, ACJY144 and PMBIO1. They found out that Rosemary essential oil actually attracts the three strains and Mugwort essential oil attracts the strain ACJY144 (Cazier, 2018). Even if the Rosemary essential oil seems to attract T.cacoeciae, it also kills them after a certain amount of time. The chemotype used in the experiment is the cineole one (Cazier, 2018). Depending on the biotope (sun exposure, climate, soil composition, altitude, etc.), the same plant can secrete different essences. These variations in the biochemical composition of essential oils generate the concept of chemotype (CT). Two chemotypes of the same essential oil will show not only different activities but also very variable toxicities (ANON., 2016). Actually, it has been showed that some compounds of essential oils such as monoterpenes, representing a range of functional groups: citral (aldehyde), pulegone (ketone), linalool (alcohol), (-)-bornyl acetate (ester), and cineole (cyclic ether) can inhibit or inactivate the acetylcholinesterase (ACHE) which is one of the most important enzymes in neuro-neuronal and neuromuscular junctions in both insects and mammals (Jankowska et al., 2017). It causes acetylcholine to accumulate at the cholinergic site (figure 2). This produces continuous stimulation of cholinergic nerve fibres throughout the central and peripheral nervous system, followed by paralysis and death of the organism (Corbett et al., 1984). All of these terpenes kill the coleoptera Tribolium castaneum, and the mortality is dose responsive (Ryan, Byrne, 1988). Also, they all inhibit the ACHE.
It is possible to add that Cockroaches and house flies both exposed to linalool and terpineol, exhibit overt hyperactivity, loss of coordination, and tremors. In cat fleas , trembling and paralysis of legs can also be noted, followed by convulsions and death (Coats et al., 1991). Moreover, chemical analyses have showed that some volatiles produced by the plants such as cineole seems to attract the parasitoid Cotesia glomerate on cabbage which has been attacked by Pieris brassicae caterpillars (Scascighini et al., 2005). Also, the grape berry moth Lobesia botrana is significantly attracted by 1.8-cineole which has been extracted from Rosemary officinalis (Katerinopoulos et al., 2005). Based on these results, it is possible to suppose that the cineole contained in the Rosemary is responsible for the attraction but at the same time kills T.cacoecie by inhibiting the ACHE. In respect of Mugwort essential oil, 1.8 cineole is also one of the components but not the major one (Alizadehl et al., 2012; Juddzentiene, Buzelyte, 2006). This last statement reinforces the hypothesis that 1.8-cineole might be responsible for the attractive effect.
Figure 2 : The essential oils’ components inhibit the acetylcholinesterase (AChE) activity. Ach-acetylcholinesterase, nAChr-nicotinic acetylcholine receptors, Eos-essential oil components.
4 My project, in this internship, has been to follow up on the study of the unintentional effects of 10 essential oils (basil, coriander, Fennel, green anise, Mugwort, oregano, peppermint, Rosemary, sweet orange and Thyme) by completing the work that had been done (table 2) on one trichogram species of agricultural interest: T.cacoeciae (Ravaomanarivo Harivelo, 2014). The hypothesis behind these unintentional effects is that the essential oils may be attractive, repulsive or neutral towards T.cacoeciae. Furthermore, I formulated and tested the hypothesis that 1.8-cineole was responsible for some observed attraction effects (Cazier 2018). This research seeks to optimize both the use of these biological auxiliaries and of essential oils in the context of integrated pest management. For this purpose, two types of laboratory experiment have been conducted: the first one consisting in olfactometry and the second one consisting in manual, and automatized olfactometry videos to better understand the effect of essential oils on trichograms’ behaviour.
2- Material and methods
2.1 Biological materials for the experiments
2.1.1 Trichogram species and rearing conditions
Trichogram presentationTrichograms are Chalcidian micro-Hymenoptera of the Trichogrammatidae family. There are currently 280 species known, all from the genus Trichogramma (Pintureau, 2012). Their size is often less than a millimetre. Trichograms are oophagous parasitoids: their larva develops inside the egg of the Insect-host, whose embryo is killed at an early stage during the larval life of the parasitoid. The parasitized eggs become black after a few days (the trichograms larva secretes a viscous substance which is applied against the vitelline membrane of the host egg and which hardens and darkens), which allows to distinguish them from healthy eggs. The disintegrated host tissues and yolk serve as food for the trichograms larva and ensure its development until metamorphosis, transformation into a nymph and then into an "imago" (adult) (figure 3). Then this imago leaves the egg and lives a free life (an average duration of 15 days at 18°C (Colombel et al., [sans date])), devoted to mating and for female, to host searching. Adult can feed on sweet substances (e.g aphid honeydew) or protein-rich substances (flower pollen) (Hawlitzky, 1982).
The range of hosts of trichograms is very wide since it includes many Lepidoptera, Diptera, Hemiptera and Coleoptera. Many studies aim to characterize this genus to improve its use in biological control (Smith, 1996). There exist two modes of reproduction in the genus Trichogramma, depending on the species or population considered (Consoli et al., 2010). The first mode of reproduction is by arrhenotokous parthenogenesis (for haplo-diploid species): males come from unfertilized eggs and are therefore haploid. As a consequence, unmated females only produce haploid males, and mated females strongly influence the sex ratio of their offspring by controlling the fertilization of oocytes (Suzuki et al., 1984), generally
Figure 3 : Illustration of the development cycle of Trichogramma sp.
Table 2 : Summary table of the conducted experiments. In yellow, the experiments previously conducted in the laboratory. In green, the experiments conducted by myself
Trichogram
Species Strain Rosemary
Sweet
Orange Oregano Peppermint Basil
Cordubensis PUG029
Cacoeciae PJ
Cacoeciae PMbio1
Cacoeciae ACJY144
Trichogram
Species Strain Thyme Mugwort Fennel
Green Anise Coriander Cordubensis PUG029 Cacoeciae PJ Cacoeciae PMbio1 Cacoeciae ACJY144 Trichogram
Species Strain Cineole
Cineole 0,05µL /
0,5µL 1µL/ 1,5µL Cineole
5 generally producing a majority of diploid females. The second mode is the thelythokous parthenogenesis: diploid females produce other females with the same genome (clones). This is the case, for example, of T.cacoeciae. Finally, some arrhenotokous populations are permanently infected with Wolbachia bacteria, resulting in thelytoky (Cook, Butcher, 1999).
All our experiments were done with three strains of T.cacoeciae: PMBIO1, ACJY144 and PJ.
Rearing conditions
The production of trichograms depends on the availability and quality of an insect host. A suitable host of substitution must be easy to produce and sustain trichogram reproduction with high fitness (Colombel et al., [sans date]). Ephestia kuehniella is one such. It allows a better fertility, longevity, and a higher capacity of flight compared to alternatives like Sitotroga cereallela (Lepidoptera: Tineidae) which was for long the most commonly used host. Eggs of E.Kuehniella are obtained from the private company Bioline Agrosciences. Batches of E.Kuehniella irradiated eggs were then stored at T 2 ± 1 ° C, HR 75 ± 5% to ensure its quality. Irradiation blocks E.Kuehniella’s development and allows its conservation. This stock is renewed every Wednesday to work with fresh eggs.
Unparasitized eggs from E. kuehniella were attached (with ⅓ of transparent Rubafix glue without solvent + ⅔ of distilled water) on a cardboard strip (4.5 cm x 1 cm). This strip is then placed in a glass tube, in contact with a second strip covered with parasitized E. kuehniella eggs, containing trichograms ready to emerge. The two strips are maintained in the same tube for 24 hours in order to let the trichograms females lay their eggs in the non-parasitised host eggs. After that, the strip carrying the newly parasitised eggs is put in another tube and kept at 25 or 19 celsius degrees depending on the desired development time. Indeed, the development cycle of trichograms strongly depends on climatic temperature as it is typical insects. Temperature regulates metabolism speed (Colombel et al., [sans date]). Thus, the temperature used for rearing varied across species. It was determined in such a way to produce the desired development time, i.e to facilitate the organization of lab work. The temperatures were calculated based on the total number of degree-days required by a given species and by its minimal development temperature.
Example of calculation for T. cacoeciae:
- Degree days required: 165
- Minimal development temperature: 10°C - Chosen rearing duration: 14 days
- Two rearing temperatures are used: 25°C and 19°C
- x: rearing duration at 25°C - y: rearing duration at 19 °C
With all this information, it is only a matter of solving the following linear system with two equations, with two unknowns:
6 𝑥 + 𝑦 = 14
𝑥(25 − 10) + 𝑦(19 − 10) = 165
This leads to x equals to 6,5 and y equals to 7,5. Consequently, trichograms from cacoeciae species must spend 6,5 days at 25°C and then 7,5 days at 19°C to accumulate 165-degree days.
Based on this possible manipulation of the rearing duration, it was possible predict the date of adult emergence and organize the different experiments.
2.1.2 Essential oils
The olfactometry experiments as well as the survival tests have been conducted with 10 different essential oils: Basil, Coriander, Fennel, Green Anise, Mugwort, Oregano, Peppermint, Rosemary, Sweet Orange, and Thyme (see table 3). They were chosen based on their possible use as bio-pesticides. They were all purchased from the Italian company Esperis. As an addition to these ten essential oils, the component which may actually be the one responsible for the attraction of the Rosemary essential oil, namely cineole, has also been tested on ACJY144 (Cazier, 2018). 1,8-cineole is a monoterpene cyclic ether found abundantly in nature. It is the major component of an essential oil isolated from Eucalyptus globulus leaves (up to 80%), but it can be also found in other species such as Rosemary (Rosmarinus officinalis, cineole chemotype), sage (Salvia officinalis), and mint (Mentha ssp.) (Aprotosoaie et al., 2019). This component has been tested as pure but also diluted in paraffine oil in order to obtain different concentrations: 1%, 10%, 20% and 30%. Knowing that 5µl has been used in the odour zones for the pure cineole, these concentrations are respectively equivalent to the following volumes: 0.05µL, 0,5µL, 1µL, and 1,5 µL.
2.2 Olfactometry
2.2.1 Experimental device
To study the way the different essential oils influenced the behaviour of trichograms, a four-way olfactometer has been used.
The experimental device (figure 4) is composed of a blower air pump (aquaOxy 2000) (1), from which two air outlets are connected to air filters (2) allowing to remove any impurities contained in the air. Then the system is divided into four connections. Each connection is connected to a flowmeter (DK 800 / PV) (3). The air then passes through a first glass bottle (4) containing distilled water (400mL) in order to be humidified. Then he goes through a second glass bottle (5) which, according to the experience, contains an odour of essential oil or nothing (no odour). Thanks to a tap system, it is possible to switch from the odorless bottle (control) to the bottle containing the odour during the experiment. Finally, the air is transmitted to the 4 arms of the olfactometer (6) and exits through the hole in the central area where the trichograms have been introduced. The air is then sucked out thanks to the vacuum system and expelled outside the room. The elements are connected by Teflon pipes, an inert material
Table 3 : Essential oils’ presentation Essential oil common
name
Latin Name Family
Basil Ocimum basilicum Lamiaceae
Coriander Coriandrum sativum Apiaceae
Fennel Foeniculum vulgare Apiaceae
Green anise Pimpinella anisum Apiaceae
Mugwort Artemisia vulgaris Asteraceae
Oregano Origanum vulgare Lamiaceae
Peppermint Mentha piperita Lamiaceae
Rosemary Rosmarinus officinalis Lamiaceae
Sweet orange Citrus aurantium Rutaceae
Thyme Thymus vulgaris Lamiaceae
7 which does not emit or absorb any odour so as not to have an odorous background noise liable to have undesirable effects on the behaviour of the trichograms.
The olfactometer (6) is composed of a 4-arm star observation chamber (figure 5) and has dimensions adapted to the size and the moving capacities of the trichograms (14 x 14 x 0.8 mm). Each branch receives the same flow rate, that is adjusted in order to avoid the generation of turbulence that would mix the odours (Cazier, 2018). The four air flows enter the chamber, dividing it in four equal-sized odour fields, and together exit through the central hole. The parasitoids are introduced into the arena from below, through the central hole of the olfactometer, and can move freely in the 4 odour fields and through the boundary zones separating them. The olfactometer is placed on a light plate (LED) in order to obtain a uniform background light. Each observation is filmed using a digital camera (Nikon D810) (7) for further analysis.
The camera settings to obtain correct videos are as follows: Aperture: F8; Shutter speed: 1/30; Sensitivity: ISO 160. A resolution of 6.7 Megapixels is used. The framerate is of 25 pictures per second. Focus is done on the trichograms before starting the video recording.
2.2.2 Protocol
First, the trichograms are introduced into the olfactometer chamber from a tube containing 60 individuals and that is connected to the central hole of the arena. To make this transfer easier and quicker trichograms’ phototaxis is used by turning the olfactometer light plate on so that the trichograms are attracted into the arena. Then, trichograms are three to move from the tube to the olfactometer arena for 10 minutes on average. When at least 15 trichograms have entered into the arena, the experiment is started. Trichograms are free to come and go during the experiment.
Before starting any video recording, the camera level is checked thanks to a spirit level. Then, the lens focus is made on the trichograms situated on the superior face of the olfactometer. The air flow of each inlet is checked to be equal to 1,6L/h.
The first video corresponds to a control. Trichograms are recorded for 5 minutes without being exposed to any odour. This is a way to check that their repartition is random and uniform across olfactometer. Then, trichograms are exposed to an odour: a zone with 5µl and another one with 10µl. Two other zones are odorless. A second video is started for 15 minutes. It allows to determine if insects are attracted, repulsed or unaffected by the presence of an essential oil odour. To test the diluted cineole, the controls corresponds to two odorless zones, and two zones filled with paraffine odour. During the experiment, the odours zones are facing paraffine zones.
This entire sequence is repeated 4 times, each time with new fresh individuals, yielding 4 different replicates (A, B, C and D). Each replicate also has a different (rotated) position of odour/odourless air flows (figure 6). This is a way to control for possible external biases.
At the end of an experiment, the olfactometer is cleaned with ethanol as well as the pipe making the connection between the olfactometer and the air flow arrival.
Figure 5 : Illustration of the olfactometer chamber
8 The bottles in which odour has been introduced are cleaned with soap and water and then rinsed with ethanol. All the experiments are done in the same conditions, starting at 8 am and finishing at 12pm. Temperature and humidity can vary so they are recorded before each experimental session.
2.2.3 Analyses
Videos processingEvery two minutes, images are then extracted from the recorded videos using the FFmpeg software. This leads to three images for the controls and eight images for the tests, i.e. nine images per replicate.
These images are then processed with the ImageJ software: each trichogram is marked with a red point; the air inlets in the olfactometer as well as its centre are marked with a blue point. Afterwards, the individuals present in each zone are counted thanks to a macro.
This macro actually divides the olfactometer into sixteen zones and counts the individuals situated in each zone (figure 7). The zones which have been effectively used for the analysis are: 1, 4, 13, and 16. The individuals in all the other ones were not considered.
Statistical analysis
The output table given by ImageJ is then processed thanks to R software version 4.0, leading to a usable table.
The first step of the analysis is to study the repartition of the individuals in the olfactometer for the controls. The trichograms are expected to be distributed in a random way. If not, this will have to be considered for the results interpretation.
To verify the homogeneous distribution of the trichograms in the different areas of the olfactometer, a quasi-binomial GLM is constructed for the controls for each strain, and each time (0, 2 and 4min). For these tests, the two odour zones are not distinguished by their concentration. They are considered as one odour zone versus one odourless zone. A value of 0.5 is included as the intercept corresponding to a random distribution. The significance of this intercept is determined using a likelihood ratio test with a model without intercept (test F). The p-values extracted from these tests are then corrected using the FDR (False Discovery Rate) correction to consider the number of constructed GLMs.
The second step of the analysis is to determine the effect of the essential oil on the trichograms. If the essential oil is attractive, it is expected to have more than 50% of the individuals in the odour zone. On the contrary, if the essential oil is repulsive, it is expected to have more than 50% of the individuals in the odourless zone. An absence of one of the previous situations (50%/50%) is interpreted as a “neutral” effect of the essential oil.
Before starting, quasi-binomial GLMs are constructed for each strain, and each time, between the two odour zones to compare the distribution of the individuals between both zones. It allows to check if there is an effect of the different concentrations used: 5 and 10µl.
9 To determine if the proportion of individuals is significantly higher or lower than 50%, an exact binomial test is run on each replicate, for different times. The p-values obtained from these independent tests are then corrected with the False Discovery Rate method and pooled thanks to the fisher method, using the R package “survcomp” (Haibe-Kains et al., 2020). The False Discovery Rate method corrects the mistakes which could be made while the calculation of the p-values is run for a high number of tests.
2.3 Observations of videos
2.3.1 Manual protocol
After having observed several videos and from the observations made during the experiments, I noticed that the individuals of the strain PMBIO1 from the cacoeciae species seemed to naturally jump more often than others. Knowing this, I focused on this type of movement through in the video’s analyses. Therefore, I have seen that the jump frequency of the individuals in the odour zone seemed to be higher than the one of the individuals in the odourless zone, for the essential oils with an apparent repulsive effect. To test this hypothesis, and to identify which explanatory factors actually explain this behaviour modification (strain, species, essential oil, apparent effect of the essential oil on the trichograms) I have created an observatory protocol for that purpose.
For each replicate video (A, B, C, D), I randomly chose three individuals in an odour zone and three others in an odourless zone at 2min, 7min and 14min without distinguishing the two concentrations (5 or 10 µL). Indeed, sometimes the number of trichograms in the experiment was very low making it hard to find individuals in each odour zone. For the same reason, the number of observed individuals was only 3 to make sure than even under the effect of an essential oil, it was possible to find some individuals in a non-preferred zone. After having randomly chosen the individuals, I counted the number of jumps each of them performed for one minute. I observed one trichogram at a time. For each control video, I randomly chose three individuals in the entire olfactometer and applied the same protocol.
These observations have been conducted on three strains of T.cacoeciae: PMBIO1 ACJY144 and PJ.
For those three strains, I also studied the activity rate individuals following a similar protocol as previously described. Instead of counting the number of jumps, I timed the periods of activity of the trichograms for one minute. I considered an individual as active when it was moving from a point A to a point B by walking or jumping. When trichograms were hovering, running in circles, or not moving anymore I considered them as non-active. This way I was able to quantify the behavioural modes I was observing on the videos. I then divided the time of activity by the length of the entire observation to get a percentage of activity.
This manual observations’ protocol has also been applied to the olfactometry experiments conducted on ACJY144 with 1,8-cineole.
10
2.3.2 Manual observations’ statistical analysis
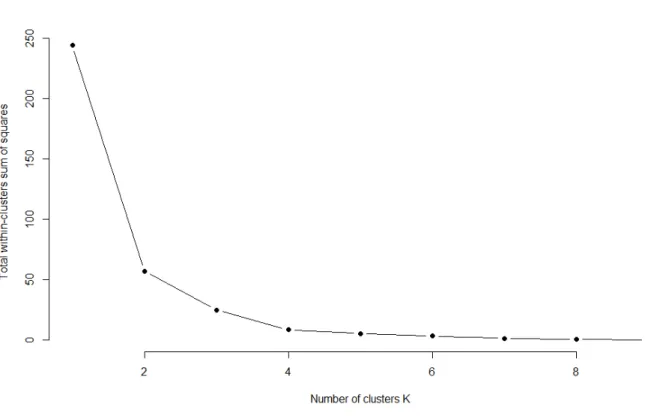
First of all, a PCA was run (thanks to the “ade4” package) on the nine quantitative variables: jumps’ frequency, proportion of individuals (obtained thanks to the counting table given by the ImageJ macro) and the activity rate, recorded in the odour zones, at the three different times (2, 7 and 14min).Previously, each variable was centred on the control. Moreover, The activity rate, and the proportion of individuals in the different zones were transformed using the following function log(p/(1-p)), to take into account the fact that there are distributed on (0,1), and make them more normally distributed. The different essential oils were grouped using the k-means clustering method with 3 clusters. To determine the optimal number of clusters which should be used, the Elbow method was utilized. The aim of clustering is to define clusters such that the total intra-cluster variation (total within-cluster sum of square (WSS)) is minimized. The Elbow method looks at the total WSS as a function of the number of clusters. The smaller the value of WSS and the elbow graph decreases the better the cluster results (Syakur et al., 2018). For all the strains, the Elbow graph corresponded to the one in figure 8.
After this, a focus on the different variables is done by plotting the different variables according to the time, the zone, and the essential oil thanks to a facet grid from the package “ggplot2”. Errors bars are added to the different graphs in order to help the reading of the results. They correspond to twice the standard error, as an estimate of an interval confidence of 95%.
Secondly, different statistical models are fir to better identify which factors are actually influencing the three variables. For the jumps’ frequency which is a counting data, glmmTMB models are used with a quasi-binomial family to consider the (visible) overdispersion while comparing the mean and the variance, and the inflation of the zero value. Regarding the activity rate and the proportion of individuals in the zones (odour and odourless) glm and glmer models were tested with a binomial family. In both cases, different combinations of explanatory variables were tested. To identify the best model among those tested, one metric is used: the AIC. AIC deals with the risk of overfitting and underfitting. It can be used as a tool to compare different models and find the best balance between model fit and generalizability. After this step, the best model retained.
2.3.3 Automatic video processing protocol
Ctrax is a computer vision program for estimating the positions and orientations of a range of insects through time. After starting Ctrax, the first step is to open a video to be processed. Then, the tracking parameters must be adjusted in order to match the video. I adjusted the parameters by using the Tracking Wizard. It allows to set the following parameters, in orders (ANON., 2011):
Figure 8 : Elbow graph for ACJY144 to determine the number of clusters that should be used The exact same graph has been obtained for the two other strains.
11 1. The tracking type: choose between dark individuals on a light background or light individuals on a dark background. In the case of olfactometry experiments, trichograms are dark individuals on light background.
2. The region of interest: it allows to precisely define the zone which must be studied in order not to waste tracking power. For the conducted experiments, it has been defined manually to match the arena’s particular shape.
3. Fixing background: this parameter is used to make sure that the individuals which do not move during the movie are not becoming part of the background. It allows the identification of “ghosts”, particles which appear on the image, but which are not trichograms.
4. High threshold: set the minimum required brightness (distance from the background) in order to discriminate foreground pixels (the individuals) from the background. (Used high threshold: 20).
5. Low threshold: this threshold determines the edges of each foreground component. The area surrounding each foreground pixel is also considered as foreground as long as it is above the low threshold. (Used low threshold: 7).
6. Shape computation: definition of the average and allowed variance in size.
After having set the parameters, the tracking can begin (figure 9). For a video of 15min, approximately two hours and a half are needed to achieve the tracking. At the end of tracking, the output data are saved in a .mat file.
Processing of the .mat file with R
The first step of the analysis, before using and interpreting the variables measured by Ctrax, is to know how accurate Ctrax actually is. To achieve this, the manual detections of individuals done with ImageJ for the three different times (2,7 and 14min) are compared to the detections of individuals done by Ctrax at the same times. The sensitivity (percentage of individuals which are not detected) and the specificity (percentage of particles which are not trichograms but are still detected) of Ctrax are therefore estimated. This gives an idea of how much filtering the data provided by Ctrax is needed.
The second step is now to define the filtering parameters which will be used to clean the data. To choose the minimum duration of a fragment, the distribution of the fragment’s duration is analysed. Then, the same is done to identify the minimum speed i.e the speed to be declared active and the maximum length a particle can have to be considered as a trichogram. Different filtering parameters have been tested to plot at the different times used previously (2,7 and 14min) the particles detected by Ctrax i.e a portion of movement for which the duration was at least equals to the defined minimum duration. These plots have been compared to the manual detection of individuals realised with the ImageJ software. This allows the estimation of the sensitivity i.e the false negative rate and the estimation of the specificity. The aim is to adapt the filters in order to reduce as much as possible the number of particles which are actually not trichograms, whilst making sure that Ctrax still detects trichograms.
Figure 9 : Screenshot of a tracking session by Ctrax Each coloured point corresponds to a trichogram detected by Ctrax.
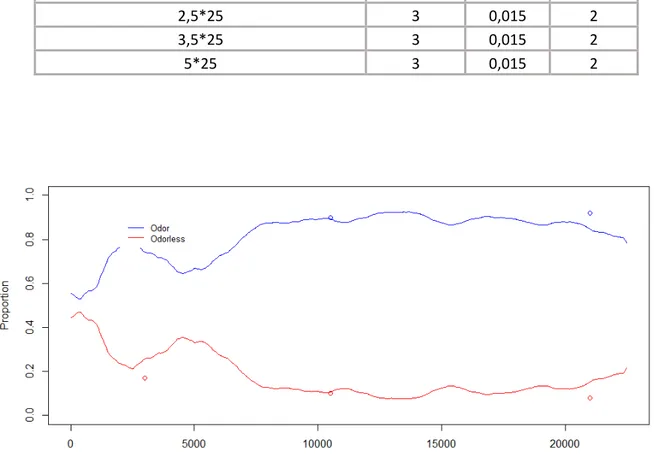
12 The different parameters that have been tested are presented in table 4. The last line of the table corresponds to the parameters which have been taken to proceed with the analysis.
2.3.4 Computation of trajectory metrics
The behaviour of trichograms has been analysed by focusing on four different variables, computed in R with the package “trajr” (McLean, Volponi, 2018): first the proportion of individuals in the different zones. This was also a way to check that the observations done by Ctrax were closed to the one manually done (figure 10). Then, the activity, the average speed and the sinuosity of their movement have been calculated and analysed through time, in the different zones.
The activity rate corresponds to the proportion of time that individuals spend moving actively. It was first necessary to identify the minimum speed threshold to qualify a displacement as active, based on histograms on all velocities. The threshold has been estimated at 0.015 cm.s-1.The sinuosity corresponds to the variation of angles averaged over all the changes in directions of a trajectory (Burte, 2019; Benhamou, 2004).To obtain the average movement’s sinuosity in the odour and odorless zones, the fragments’ sinuosity offset with their length were summed and then divided by the total fragments’ length. Finally, the average individuals’ speed has been obtained by summing the individuals speed offset with their duration and then by dividing it by the total duration. For the graphs of the speed, the activity rate and the sinuosity, the controls correspond to the four zones of the olfactometer without odours, knowing, thanks to the olfactometry experiments, that there is actually no “zone effect” inside the olfactometer.
This automatic protocol allows a more precise characterization of the effect of essential oils on trichograms but was only applied to the olfactometry videos with Rosemary and Thyme with the strain ACJY144, because of time constraints.
3- Results
3.1 Olfactometry
3.1.1 Check of the random repartition of the individuals in the olfactometer
For the controls, the individuals are expected to be randomly distributed in the olfactometer. The p-values obtained from the quasi-binomial GLM which have been constructed for the controls for each strain, each time, and each area of the olfactometer to verify this distribution are all superior to 0.05 after the FDR correction. Therefore, there is no effects which could have affected the distributions which have been observed during the experiments.
Table 4 : Summary table of the tested parameters in Ctrax
Tested parameters
Min_Duration (in frames i.e seconds*25)
Max_length In pixels MinSpeed Cm/s MaxSpeed Cm/s 0 10000 0 10000 2,5*25 3 0,015 2 3,5*25 3 0,015 2 5*25 3 0,015 2
Figure 10 : Evolution of the proportions of individuals through time for the replicate C. The lines are the proportions obtained thanks to Ctrax. The points are the ones obtained from the manual count.
13
3.1.2 Effect of the different tested essential oils on the different strains of trichogramma
First of all, the p-values obtained from the quasi-binomial GLMs constructed for each strain, and each time to test the concentration effect, are all superior to 0.05 after correction. Therefore, there is no concentration effect. Thus, the two “odour” zones have not been distinguished in the different analysis.
Secondly, for each strain and each essential oil, graphs representing the evolution of the proportion of the individuals through time, in the odour zones have been generated. On each graph, the four replicates (A, B, C, D) are represented with different colours. The mean and the standard error of the four replicates are represented in black. The vertical bar at 0 represents the introduction of odour and the red dashed horizontal bar, 50% of individuals in the odour. The instantaneous average values showing a significant p-value after FDR correction are represented by red asterisks.
ACJY144
For this strain, it is possible to notice that depending on the essential oils, significant effects (repulsive or attractive) are recorded as of different times (2min ,4 min or 6min). It seems that Basil, Coriander, Green Anise, Peppermint, Oregano and Thyme are significantly repulsive (figure 11). For some essential oils, the effect seems to evolve through time. Indeed, Fennel and Mugwort are first responsible for a significant repulsive effect and then the trend reverses and
becomes attractive. The orange essential oil is neutral, and the Rosemary is the only one being significantly attractive. Regarding this attractiveness, the major component 1-8 cineole has been tested on its own to see if it is actually the one responsible for the trichograms’ behaviour (appendix I). Without dilution (concentration of 5 and 10 µL as for essential oils), no concentration effect has been recorded. From 2 to 12 min, it seems to be significantly repulsive, and becomes significantly attractive after 12 minutes. It is important to note that the variability between the different replicates is quite high, as well as the one inside a same replicate (example of the replicate B at t=-2 and t=8 min). The effect which affects trichograms’ behaviour seems to evolve quite quickly. For The lower concentrations of cineole which have been tested 0.05µL, 0,5µL, 1µL, and 1,5 µL, there is still no concentration effect between 0.05µL and 0,5µL, neither between 1µL, and 1,5 µL. Therefore, as for the other experiments, these different groups of odours have been treated as one odour zone. None of them show a significant attractivity (appendix II and appendix III), even if, for 20 and 30%, the proportions in the odour zone tend to be higher.
PMBIO1
As for ACJY144, Basil and Coriander essential oils are significantly repulsive (figure 12). Fennel Mugwort, Green anise, and Oregano show the same repulsive effect. Orange, Peppermint and Thyme seem to be quite neutral towards the tested individuals.
Figure 11 : Graphs representing the different evolutions of the proportions of individuals in the odour zones for the ten essentials on T.cacoeciae, strain PMBIO1
Figure 12 : Graphs representing the different evolutions of the proportions of individuals in the odour zones for the ten essentials on T.cacoeciae, strain ACJY144
(Min) (Min)
14 Rosemary is also significantly attractive for this strain, but the effect appears earlier. For this strain, there is no change in trichograms’ reaction towards the odour.
PJ
Regarding this strain, seven of the ten essential oils have a significant repulsive effect as of different moments: Oregano, Peppermint, Thyme, Green Anise, Coriander and Fennel. Unlike the other strains, Rosemary essential oil is neutral toward this strain. The same result can be observed for Orange and Mugwort. Nevertheless, even if it is not significant, Mugwort essential oil shows an attractive trend (Appendix IV).
The different essential oils’ effects for each strain are summarized in appendix V.
3.2 Observations of videos
3.2.1 Manual observations
To have a better understanding of the way the essential oils could be classified and influence the trichograms, the proportion of individuals in the odour zone as well as the activity rate and the jump’s frequency have been measured at three different times (2,7 and 14 min) for the three strains. First the summary statistics, in this case PCAs centred and scaled with the control (no odour at all) completed with a K-means clustering, show that it is possible to group together several essential oils. The groups differ from one strain to another.
ACJY144
Indeed, for ACJY144 it is possible to distinguish three groups of essential oils. The first one is constituted of Mugwort, Rosemary, pure Cineole, diluted Cineole (between 1 and 10%), and diluted Cineole (between 20 and 30%). The second one is represented by Orange, Coriander, Oregano, Green Anise and Basil. The third one is composed with Thyme and Peppermint (figure 13). Thanks to the variable projection which is quite good except (cos²>0.75), except for different proportions (at 2min especially) and the activity rate at 2 min (Appendix VI), it is possible to say that actually the first axis opposes the essential oils for which most individuals stand in the odour zone from the ones for which there are less individuals in the odour zone but they jump more frequently. In this case, Thyme and Peppermint appear to be the most repulsive ones. The second axis opposes the essential for which at 2min the activity rate at two minutes is quite high and then strongly decreases at 7 and 14min. With the graphs of the average activity rate according to the time and zone it is effectively possible to see that the essential oils which actually make the trichograms’ activity rate significantly decrease through time in the odour zone (figure 13) are Mugwort and Rosemary. This is also true for Fennel. A look at the average jump’s frequency (Appendix VII) and the proportion of individual in the different zones state that Fennel, Mugwort, and Rosemary essential oils lead to the same kind of reaction towards trichograms. Indeed, for the three of them, the jump’s frequency tends to be equivalent as during the control.
Figure 13 : PCA representing the ten essential oils, plus the three tested modalities for cineole for T.cacoeciae ACJY144, according to the three studied variables at three different times: Proportion of individuals
at 2, 7 and 14 min (Prop_Ind_2, Prop_Ind_7), Activity rate at 2, 7 and 14 min (Act_Rate_2, Act_Rate_7, Act_Rate_14 ), and Jump’s frequency 2, 7 and 14 min (Jumps_Freq_2, Jumps_Freq_7, Jumps_Freq_14 )
Figure 14 : Average activity rate observed through time for the ten essential oils tested on T.cacoeciae ACJY144. C: the controls, O: Odour Zone, Oless: Odourless Zone. The error bars correspond to twice the standard error i.e
an estimation of the confidence interval at 95%.
15 With the PCA, the different modalities of cineole tested are classified in the same group than Mugwort, Rosemary and Fennel. This is mainly because the activity rate strongly decreases after 2min with pure cineole (Appendix VIII). The diluted cineole is closer to the controls because the change in the activity rate is not marked, neither it is for the jump’s frequency (Appendix IX). For this group, the proportion of individuals in the odour zone does not appear as a good indicator to determine their nature towards trichograms. However, for the repulsive oils, especially for Thyme and Peppermint, the jumps frequency increases quite a lot compared to the controls whereas there is no noticeable change in the activity rate. The groups identified thanks to the different variables seem to match with the ones identified thanks to the olfactometry graphs. Even if the cineole appears closer to the Rosemary with the PCA than with the results shown by the previous graphs.
PMBIO1
Regarding PMBIO1, it is also possible to identify three groups. The first one being composed with: Rosemary, Fennel, Green Anise, Thyme, Coriander, Mugwort and Oregano. The second one is constituted of Orange and Peppermint. The last one only counts Basil (figure 15). In this case, the variables are not correlated to one dimension more than another. Nevertheless, because of their quite good projection (cos² >0.75, expect for the proportion of individuals at 2min and the activity rate at 14min, appendix X), it is possible to say that the first dimension is more explained by the proportion of individuals and the activity rate whereas the second is more about the jump’s frequency.
Actually, Rosemary is grouped with Fennel, Green Anise, Thyme, Coriander, Mugwort and Oregano because of its activity rate and jump’s frequency. Indeed, these oils do not significantly impact the trichograms jump’s frequency (Appendix XI) but create a decreasing trend for the activity rate (Appendix XII). Rosemary appears quite isolated from the others because the decrease in the activity rate is much more intense. Then the jump’s frequency explains the other groups. Indeed, Basil, Peppermint and Orange are the only ones for which the jump’s frequency is significantly higher than the one in the odorless zone, Peppermint and Basil being repulsive. Orange is closer to the control because the repulsive effect does not appear. Nevertheless, Basil does not appear in the same group than Peppermint and Orange because the increase in the jump’s frequency is higher and maintains quite high through time compared to the others.
PJ
As for PMBIO1, it is possible to create three groups of essential oils (figure 16). The dimensions oppose the groups based essentially on the jump’s frequency and the activity rate because the proportion of individuals are not well projected except for 14min (Appendix XIII). It is possible to notice that Rosemary, Fennel, Green Anise and Basil are part of the same group because of their activity rate decreasing quite a lot after 7min (Appendix XIV).
Figure 16 : PCA representing the ten essential for T.cacoeciae PJ, according to the three studied variables at three different times: Proportion of individuals at 2, 7 and 14 min (Prop_Ind_2, Prop_Ind_7), Activity
rate at 2, 7 and 14 min (Act_Rate_2, Act_Rate_7, Act_Rate_14 ), and Jump’s frequency 2, 7 and 14 min (Jumps_Freq_2, Jumps_Freq_7, Jumps_Freq_14 )
Figure 15 : PCA representing the ten essential for T.cacoeciae PMBIO1, according to the three studied variables at three different times: Proportion of individuals at 2, 7 and 14 min (Prop_Ind_2, Prop_Ind_7), Activity rate at 2, 7 and
14 min (Act_Rate_2, Act_Rate_7, Act_Rate_14 ), and Jump’s frequency 2, 7 and 14 min (Jumps_Freq_2, Jumps_Freq_7, Jumps_Freq_14 )
16 Nevertheless, Rosemary and Fennel are far from Green Anise and Basil because they make the proportion of individuals increase through time unlike Basil and Green Anise which make it decrease. The two other groups are: Oregano, Coriander, Thyme and Orange, Peppermint, and Mugwort. All of them appear to be quite repulsive to trichograms. Nevertheless, only Mugwort, Orange and Peppermint make their jump frequency increase after 2min (Appendix XV).
Statistical models
First of all, simple glm models have been run for the three variables with “Strain” as a fixed effect. It shows that intraspecific variability must be considered. Then, different explanatory variables have been added step by step, and kept or not based on the way they affect the AIC. All the tested models for the jump’s frequency are listed in table 5. For both the activity rate and the jump’s frequency, the best model is the one built with Strain, the interaction between the essential oil and time, plus the zone (odour or odourless) as fixed effects; and the identity of each individual as a random effect. Regarding the proportion of individuals in the different zones, the best model is built with the same parameters, except that the random effect is not used (the proportion is not measured on an individual scale). This modelling confirms the fact that the evolution of the observed variables effectively depends on the time which is closely related to the essential oil. Also, it demonstrates that the observations must always be related to the strain because of the intraspecific variability.
3.2.2 Automatic video analyses
Example of an attractive essential oil: Rosemary
First of all, the automatic analyses confirmed the proportions’ evolution through time in the different zones. Through time, the proportion of individuals in the odour zones becomes effectively higher than 50% (figure 17).
Then, it shows that actually in the odour zones, the individuals speed decreases for two replicates (A and D) and stays lower than the one in the odorless zone. But it is not the case for the replicates B and C for which the opposite is observed (figure 18). Regarding the activity rate, it is lower in the odour zones for all the replicates except for replicate C (Appendix XVI). Moreover, in the odour zone the individuals’ movement seem to be more winding (Appendix XVII). Indeed, for three of the replicates, the sinuosity observed in the zones with odour is 4 times higher than in the zones without. Nevertheless, for the replicate B, the sinuosity is higher in the odorless zone.
Example of a repulsive essential oil: Thyme
As for Rosemary, the automatized observations confirm the proportions’ evolution through time in the different zones. Indeed, through time, the proportion of individuals in the odour zones becomes effectively lower than 50% (Appendix XVIII).
Then, unlike the attractive essential oil, with Thyme, the individuals speed is a bit higher in the odour zones than in the odourless zones (Appendix XIX).