Introduction
In Algeria, and despite the tremendous efforts made by the actors of the dairy sector since the country’s independence, dairy production doesn’t meet the needs of the population, and this problem is still relevant (Kalli et al., 2018). Statistics showed over time, a continuous increase in population,
consumption of milk per capita (considered the highest in the Maghreb), as well as imports of cows, feedstuffs but also milk powder (Kali et al., 2011 ; El Hassani, 2013). It is rather the farms productivity (first link of the dairy sector) that did not follow this dynamic. According to Kalli et
Status, Characterization and Typology of Dairy
Cattle Farms in Northern Algeria
Said BOUKHECHEM1,2*, Nora MIMOUNE2,5, Mohamed Khalil GHOZLANE3, Nassim MOULA4, Rachid KAIDI5,6
1 Institute of Veterinary Science, University of Mentouri Constantine 1, PB 325, 25017, Constantine,
Algeria
2 National High School of Veterinary Medicine, Bab-Ezzouar, Algiers, Algeria
3 High National School of Agronomy, Hassan Badi Avenue, El Harrach 16004, Algeria
4 Department of Animal Production, Division of Genetics and Biostatistics, Faculty of Veterinary Medicine,
University of Liege, Boulevard de Colonster 20 B43, 4000 Liege, Belgium
5 Institute of Veterinary Sciences, LBRA, University of Blida 1, PB 270, Soumaa, Blida, Algeria
6 School of Veterinary Medicine and Science, University of Nottingham, Nottingham, Leicestershire, United
Kingdom
*corresponding author: said.boukhechem@umc.edu.dz
Bulletin UASVM Veterinary Medicine 76(2)/2019 Print ISSN 1843-5270; Electronic ISSN 1843-5378 doi:10.15835/buasvmcn-vm:2019.0022 Abstract: The aim of this study was to make a finding about the structural, functional and performance aspects of 217 dairy farms in northern Algeria through a survey, then to establish a diagnosis and a typology of these farms. The results showed that farms had an average size of 42.7 ± 102 ha, of which 34.5% was fodder area (FA), and an average of 28 ± 34.5 livestock units (LU) per farm, of which 65% were dairy cows (DC) dominated mainly by the Holstein and Montbeliarde breeds (74.8% of the total herd). The average number of annual work unit (AWU) was 2.98 ± 1.92 AWU/farm of which 78 ± 35% was a family labour. The farms’ performances were generally low. Dairy production (DP) average was 14.3 ± 4.77 kg/cow/day/farm, while fertility represented by calving interval (CI) was 397 ± 20.2 days/cow/farm. The use of multidimensional statistical methods has identified five types of farms. This study revealed a poor exploitation of the dairy potential of cows raised in Algeria, with the dominance of archaic breeding practices that oppose the welfare of these cows. To optimize dairy farming, solutions have been proposed. Keywords: agricultural area, dairy production, feeding, fertility, productivity.
al. (2018), these are subject to strong constraints limiting their overall performances.
The limited diagnoses results made by Algerian researchers indicates the presence of structural, technical and economic lags, which are linked to the farms, the cows and the farming methods (Makhlouf et al., 2015; Kalli et al., 2018). The majority of these authors recorded a poorly valued production potential and performances that are similar to those obtained decades ago in countries that are today major milk producers. Soukehal (2013), explained this by the unequal farms’ distribution across the country, as well as the farming methods which remain mainly extensive (according to a 2011 census, 86% of farms practiced a family breeding with 2 cows on average).
In order to create a reflection dynamic on the development of the upstream dairy sector, and as a first step, we have chosen to make a dairy farms inventory of their structure, functioning and performances, followed by a typology based on multidimensional statistical analysis to draw a real picture of the practices that are adopted.
Materials and Methods
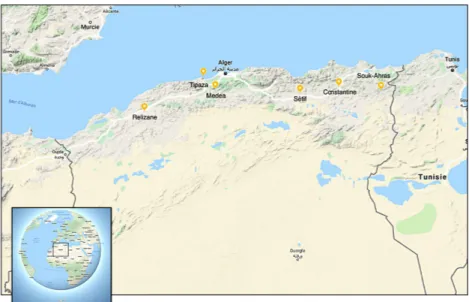
Study areaThe study was conducted on 217 farms of different sizes, totalling 6084 LU across 6 regions in northern Algeria (Figure 1, Table 1) on a period from 2014 to 2018.
Northern Algeria climate
The north of Algeria has a Mediterranean climate (hot dry summers, wet and cool winters), with transitional bioclimatic stages, notably the semi-arid climate of the highlands in the centre of the country. The north-eastern and central curbs are the most rain receiving, with an average annual rainfall amounts ranging between 600 and 1150 mm, while the North-western margins record an average annual amount ranging from 250 to 500 mm (ONM, 2019). Methodological approach
To carry out this study, we adopted an investigative approach by looking through several parameters such as the farms’ inventory, the performances, and the degree of technicity of the farmers. A survey was conducted with a frequency of one or two visits for each farmer with the aim of collecting all the data that seemed interesting. For this, the development of a questionnaire was essential. The collected data is split into 4 categories:
the structural aspect of the farm which includes the housing systems, the agricultural areas and the herds composition;
the functional aspect, including feeding, reproductive and milking managements;
the human aspect that consist of the labour force and the farmers experience;
the performance aspect, including the dairy production and fertility.
193
Status, Characterization and Typology of Dairy Cattle Farms in Northern Algeria
The analysis of the raw results led us to develop a database and to identify 26 variables with 24 explanatory variables (8 qualitative and 16 quantitative) and 2 variables to explain. The results were first compared to standards (Wallet and Lagel, 2011; Humblot and Grimard, 1996) and then to those presented by different researchers. Statistical analysis Statistical analysis of the data is a keystone in this type of study. First, the descriptive statistics were performed by the R software (version 3.5.2).
To study the effects of certain qualitative factors on farms’ performances, Analysis of variance (ANOVA) were performed with GLM procedure in SAS (Statistical Analysis System ; SAS Release 9.1). The used model is of the following form:
Yijklm=m+Ri+STj+SZk+SBl+ RMm + IMn + CRo + eijklmno m = general mean Ri = region effect (i = 1 to 3) STj = effect of the farm status (j = 1 to 2) SZk = season effect (k = 1 to 4) SBl = stabling mode effect (l = 1 to 3) RMm = effect of reproduction monitoring (m = 1 to 3) IMn = effect of mode of insémination (n = 1 to 3) CRo = effect of calves rearing (o = 1 to 3) eijklmno = residual error
To study the effect of some quantitative factors, we used the CORR procedure by the R software (version 3.4.4) for calculating the Pearson correlation coefficients.
Finally, using the R software, we carried out a principal components analysis (PCA) to establish a typology of the dairy farms.
Results and discussion
Characterization of the farms; The structural aspect; State of the stables.
The cowshed has a major impact on the technical and economic performances of the farm, the quality of the farmers’ work, the financial equilibrium and the evolution possibilities of the farm (Wallet and Lagel, 2011). In our sample, buildings housing the dairy cattle had an average age of 15.4 ± 14.9 years, and a living space of 11.4 ± 7.7 m² per LU, which is higher than the minimum recommended for an adult cow of 9 m2 (Wallet and Lagel, 2011). Therefore, living spaces do not seem to be a problem, rather, it is the design of these spaces that does not comply with zootechnical standards.
In addition, and even with the considerable number of disadvantages it represents, the tie-stall remains the dominant housing system, and was found in 76% of the visited farms, far ahead of the free stall system, which was adopted only in 6.45% of farms. A similar proportion (7% of breeders practicing free stall housing) was reported by Kaouche et al. (2012) in Medea. The rest of the farms followed a mixed housing system (tie-stall with regular outdoor exercise).
Agricultural areas. The surveyed dairy farms
were characterized by an average size that was represented by the utilised agricultural area (UAA) of 42.7 ± 101 ha. This value is higher than all of the results recorded in Algeria: in Mitidja by Ouakli and Yakhlef (2003) and Bekhouche (2011) (31.2 ± 59.2 and 17.7 ± 3.35 ha respectively), in Setif by Bir et al. (2014) (30.7 ± 46.9 ha), in Tizi Ouzou by Belkheir et al. (2015) and Allane et al. (2011) (11.4 ± 7.13 and 12.6 ± 11.5 ha respectively), and in Annaba by Bekhouche (2011) (18.8 ± 3.38 ha), and also higher than the ones recorded by Srairi (2004) in Rabat-Salé (18.4 ± 61.4 ha), by Srairi
Table 1. Characteristics of the studied sample
Number
of farms Herd size (LU) Number of cows Proportion of cows Cows per farmNumber of Number of bulls
Total 217 6084 4036 66.3 18.6 181 Region East 65 1823 1216 66.7 18.7 50 Center 3 515 472 91.6 157 5 West 149 3745 2348 62.7 15.8 126 Status Public 4 364 297 81.6 74.2 5 private 213 5720 3739 65.4 17.6 176
et al. (2003) in perimeter of Gharb (17.5 ha) in Morocco, by Hammami et al. (2008) in Bordj Etaouil (8 ha) and by Hanafi et al. (2008) in Bordj Toumi-Tonguar (7 ha) in Tunisia. However, if we only count the owned agricultural area, the results would be medium (25.9 ± 89.6 ha).
Smallholder farms with an UAA less than or equal to 5 ha accounted for 12.4% of the total, while those with an UAA between 6 and 10 ha accounted for 18.7%. In total 33.5% of farms had less than 10 ha. Makhlouf and Montaigne (2017) reported relatively close result in Tizi Ouzou (48%), however, our results were much lower than the national average (78.8%) reported by Bir et al. (2014). It is worth noting that 2.4% of the farms had no agricultural land (Figure 2). Which is far lower than what was reported by Makhlouf and Montaigne (2017) in Tizi Ouzou (40%). The farm size does not seem to be an obstacle to the development of the farms (42.1% of farms had more than 20 ha). Rather it is how these surfaces are used to benefit the livestock, where the forage area (FA) represents 34.5% of the UAA for an average of 14.7 ± 28.3 ha/farm. These results are similar to the ones registered by Bekhouche (2011) in the regions of Mitidja and Annaba with 14.1 ± 2.16 and 13.3 ± 3.42 ha respectively, by Ouakli and Yakhlef (2003) in Mitidja with 13.14 ± 18.20 ha, a bit higher than the one reported by Allane et al. (2011) in Tizi Ouzou (11.2 ± 10.9 ha) and much superior to the ones obtained by Bir et al. (2014) in Setif (7.60 ± 10.3 ha). The proportion of FA to UAA decreased as the size of the farm increased.
Farms where FA was lacking and where dairy cattle rearing was only a marginal activity, accounted for 1.96% of the total sampled farms. Similarly, farms were the FA represented less than 30% of the UAA reflecting that dairy cattle rearing was secondary to agriculture accounted for 28.4% of the total. Dairy cattle rearing played a primary role in 48% of farms, where FA accounted for more than 50% of the UAA in 29.4% and reached 100% of the UAA in 18.6% of the total sample.
The cultivated agricultural area averaged 8.47 ± 16.8 ha. This observation and despite the difference in relief complies with that of Belkheir et al. (2015) and Allane et al. (2011) in the Kabylia (9.12 and 9.23 ha respectively), but it is higher than the one recorded by Bir et al. (2014) in Setif (4.92 ± 5.79 ha).
As for the irrigated area which was 1.40 ± 4.09 ha, it is comparable to 1.94 ha recorded in Tizi Ouzou by Belkheir et al. (2015). The irrigation rate of 14.5 ± 29.1% of the FA is comparable to the result recorded by Bir et al. (2014) in Setif (14.3%) and very low compared to the rate recorded in Mitidja (66.95%) by Ouakli and Yakhlef (2003) and in Bordj Etaouil (66% de la SAU) by Hammami et al. (2008).
The mean stocking rate is equal to 4.20 ± 7.25 LU/ha of FA (from 0 to 75 LU/ha), which is higher than the one reported by Allane et al. (2011) in Tizi Ouzou (2.13 ± 2.15 LU/ha) and lower than the one reported by Bir et al. (2014) in Setif (7.29 ± 11.3 LU/ha), Ouakli and Yakhlef (2003) in Mitidja (7.08 ± 6.97 LU/ha) and by Bekhouche (2011) in
195
Mitidja and Annaba (6.57 ± 1.4 and 5.96 ± 1.40 LU/ha respectively).
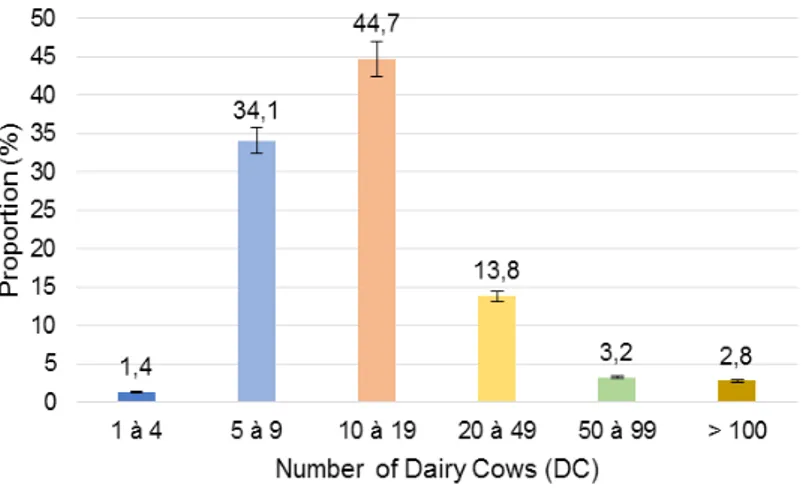
Herd composition. The average herd sizes
was between 5.2 and 267 LU with an average of 28 ± 34.5 LU/farm, a relatively high number which requires a certain amount of seriousness and organization in the work. DC rearing remains the main activity in the farms (65 ± 15% of the herd and an average of 18.6 ± 27 DC/farm), other activities such as raising of dairy replacement and/or meat animals are also practiced.
The average number of DC in the sampled farms is lower than those recorded by Ouakli and Yakhlef (2003) and Bekhouche (2011) in Mitidja (27 et 20.7 DC respectively), however, it is higher than the numbers recorded by Bir et al. (2014) in Setif (14.4 ± 12.18 DC), by Srairi (2004) in Rabat in Morocco (12.6 ± 15.6 DC), by Bekhouche (2011) in Annaba (10.3 ± 2.16 DC), and by Allane et al. (2011) and Belkheir et al. (2015) in Tizi Ouzou (10.2 ± 6.35 and 8.25 ± 5.57 DC respectively).
The distribution of farms according to the number of their DC showed that 44.7% of them had between 10 and 19 DC ; 35.5% had less than 10 DC and only 19.8% had more than 20 DC in the herd (Figure 3). Farms with small herds (less than 5 DC) accounted for 1.38% of the total of farms, while those with more than 50 DC accounted for 5.99%. This differs from what Chehat and Bir (2008) have reported, with proportions of 95% et 0.3% respectively and which, according to Makhlouf et al. (2015), was the main constraint to the modernization of cattle farming.
The renewal rate of DC represented by the proportion of primiparous cows was estimated at 22 ± 31%. Which is higher than the one found by Ouakli and Yakhlef (2003) in Mitidja (11.94 ± 12.97 %).
As for the herd’s ethnic composition, although diversified, it was dominated by the Holstein and Montbéliarde dairy breeds, which accounted respectively for 45.9% and 28.9% of the total number of DC of the surveyed farms. These two breeds are not only sensitive but also demanding in terms of comfort and therefore are the less adapted to the farming conditions in Algeria, whereas the local breed “Brown Atlas” represented only 1.24% of the total DC (spread over 11 farms).
The functional aspect; Feeding management
The average dry matter intake of the distributed rations was correct (16±5 kg/cow/farm). However, the proportion of the concentrate in the intakes is high (44.8±15.6 %), which increases the risk of metabolic diseases and consequently penalizes production and contributes to the production cost increase. Green fodder feeding was practiced in 60.4% of farms during a short period of the year, while the silage was distributed only in 6.19% of farms. This complies with what Kadi et al. (2007) found in Tizi Ouzou (98.75% of farms had a lack of silage). In 9 out of 10 farms (89.6%) and throughout the year, the basic rations consisted only of dry fodder (hay and/or straw) which contain low nutritional value. This is in line with the finding of Houmani (1999) who confirmed the excessive use of dry
Status, Characterization and Typology of Dairy Cattle Farms in Northern Algeria
hay and concentrates in Algerian dairy farms over silage and green fodder.
Reproductive management
41.5% of the farms had a rigorous reproduction monitoring through the recording of calving, inseminations and the drying cows dates, while in 12.9% of farms, the monitoring was partial. This component does not seem to be a priority for farmers in almost half of the farms (45.6%) where reproduction monitoring was lack.
Natural service remains the insemination method of choice to the farmers, as it was observed in 73.3% of the farms (more than 7 farms out of 10) which accounts for 71.7% of the total DC, thus far dominating artificial insemination method that was only practiced in 7.8% of the farms, which accounts for 6.3% of DC. Farmers prefer the natural service for its ease and relatively high success rate, without taking into account the delay or the decline of genetic progress caused by this insemination mode.
A mixed insemination method was adopted in 18.9% of the farms. The use of natural service often occurs after repeated artificial insemination failures. Which was different from what Kaouche et al. (2012) has reported in Medea with 35.7% of farms practicing natural service, 30% practiced artificial insemination, and mixed mode in 34.3% of farms. On the farms that practiced natural service, the sex ratio was 17 ± 17.6 cows/bull (ranging from 2.5 to 176 cows / bull). Of these farms, 18.9% had no bulls.
Milking management
The degree of milking mechanization in Algerian farms has increased significantly to reach 90.3%, either through milking trolley which accounts for 84.3% or milking parlors in 6% of the farms. In a study carried out by Kaouche et al. (2012) in Medea, 73% of farmers own a milking machine. It should be notes that the milking remains manual in 9.7% of the farms which hold 181 cows or 4.5% of the total livestock.
Calves rearing management
15 farms (6.9%) did not practice calf rearing, where calves are sold within a week of birth. In farms practicing this type of farming, calves were separated from their mothers in 111 farms (51.2%) to be fed powdered milk in 6.3% (7 farms), or like in the majority of cases cow’s milk (93.7%), It is important to note that in 41.9% of the farms (91), calves are raised with their mothers. Given its negative impact on the recovery of the ovarian activity of cows after calving, rearing the calves under their mothers penalizes fertility (Humblot and Grimard, 1996). This is the main cause of calving - first insemination interval prolongation, and therefore CI prolongation. The mean weaning age of calves was 4.12 ± 1.29 months. This value is close to the recommendations for calves of beef breeds. As for raising of dairy replacements heifers, it was recorded in 43.8% of farms (95 farms). 3.6 60.1 36.3 0 10 20 30 40 50 60 70 < 365 365 à 400 > 400 P ropor tion (% )
Calving Interval - CI (days)
197 Human aspect The average number of labour per farm was estimated at 2.98 ± 1.92 AWU/farm of which 2.08 ± 1.51 were family AWU (78 ± 35% per farm). Thus, one AWU supported an average of 9.96 ± 7.09 LU/ farm. This number of labour is comparable to what Mouhous et al. (2014) found in Tizi Ouzou (2.5 ± 2 AWU) and lower to what Bekhouche (2011) has reported in Mitidja and Annaba (5.5 ± 0.5 and 3.68 ± 0.5 AWU respectively).
The family nature that dominates the farms labour may indicate relatively traditional farming methods, as well as a lack in the “know-how” of people who are in contact with the animals. On average, the owners (or managers) of these farms accumulated an estimated experience of 11.3 ± 9.15 years in the field of farming. This however does not necessarily mean good practices.
Performance aspect
Farms’ Dairy yields ranged from 2.76 to 28 kg/ DC/day/farm, with an average of 14.3 ± 4.77 kg/ DC/day/farm, for an average lactation period of 5.40 ± 2.08 months. This production is comparable to the one recorded by Belkheir et al. (2015) in Tizi Ouzou (14.4 ± 4.6 kg/DC/day), Srairi et al. (2014) in Morocco (14 kg/DC/day) and higher than the one reported by Ouakli and Yakhlef (2003) in Mitidja (11.48 liters/DC/day). In comparison to the norms, the average farms’ performance is low, and this is undoubtedly a reflection of poor
welfare of the cows at these farms.Applying Pearson correlations on the average farm milk yields showed that they were independent of all explanatory variables, exception the area factor (p = 0.002) where the best yields were recorded in the west of country (Table 2), the stalling system (p = 0.04) where the best results were recorded in the farms adopting the free stalls (17.8 kg), and the calf rearing method (p = 0.004) where the best results were observed in the farms where the calves were separated from their mothers.
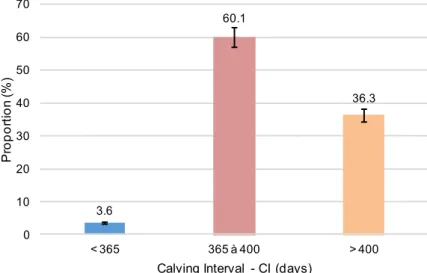
Cows fertility, represented by the calving interval (CI), was estimated to be 397 ± 20.2 days on average. These results are clearly higher to those has been reported by Ouakli and Yakhlef (2003) in Mitidja (14.5 Months), by Bouamra et al. (2016) at the ITELV Farm (422.4 Days), by Ben Salem et al. (2007) in Tunisia (422 Days) and by Srairi (2004) in Rabat-Sale (429 Days).
The distribution of farms according to their average CI showed that in 3.6% of the farms that accounts for 3.1% of the DC, this parameter was less than or equal to 365 days, while 60.1% (holding 69.9% of DC) of the farms recorded average CI between 365 and 400 days. And lastly, this parameter was greater than 400 days in 36.3% of the farms that hold 27% of the DC (Figure 4). It is worth noting that the average CI was estimated to be 395 ± 18.9 days in farms that adopted natural service. Status, Characterization and Typology of Dairy Cattle Farms in Northern Algeria Figure 5. Principal Component Analysis Variables factor map. in abscissa : the herd sizes (UGB) and dairy cows (VL), the sex ratio (SEXRATIO), the labour (UTH), the proportion of the family labour (UTHFAM), the farms’ sizes (SAU), and on the ordinate : the average number of LU per AWU (UGBUTH), the proportion of Holstein (HL) and Montbeliarde cows (MB), the stocking rate (Chargement), the percentage of dairy cows (VLPC) and the renewal rate of DC (RNVL)
Farms’ average CIs were not correlated with any explanatory variables, with one exception that is the mode of insemination (p = 0.01), where the best CIs were recorded on farms adopting the natural service.
Farms typology
A principal component analysis (PCA) for the 217 farms was conducted taking into account 20 quantitative variables contributing to a total inertia of the first 3 axes of 40.7%. The main plan (defined by the first and second axes) allowed for a good graphic discrimination (Figure 5).
The hierarchical Ascending Clustering (HAC) performed on the 20 variables allowed to identify from the analysis of the first three axes, five clusters (farms types), which explain 40.7% of the variance (Table 2, Figure 6).
The Cluster 1 (SF) accounts for 37.3% of the
total. These farms include small family farms where labour is 90.6 ± 24.1% family, agricultural areas are reduced (UAA = 17.9 ± 26.9 ha and FA = 7 ± 5.55 ha), herds are small (15.2 ± 7.77 LU/farm including 10.7 ± 5.34 DC/farm). These farms’ dairy cow herds are younger (renewal rate of DC = 6.82 ± 10.2%), consist mainly of Holstein cows (68.4 ± 29.1% per farm) and benefit from the best sex ratios (11.5 ± 6.15 cows/bull/farm). Nevertheless, the performances recorded in this type of farms were low (DP = 14.9 ± 4.26 kg/DC/farm, CI = 405 ± 23.4 days/DC/farm).
The Cluster 2 (NF) makes up 21.2% of the
total. They are the newly established farms, given the highest cow renewal rate (68.5 ± 30.0% per farm) and the lowest manager experience (6.31 ± 5.73 years). These farms are characterized by reduced agricultural areas (UAA = 19.0 ± 16.2 ha,
FA = 8.74 ± 7.65 ha), small herds (13.3 ± 8.17 DC/ farm), and the smallest living spaces (8.21 ± 6.47 m2/LU) and a limited human workforce (2.24 ± 1.21 AWU/farm) that are mainly family members (77.9%). These farms are also characterized by a reduced proportion of dairy cows (47.8 ± 7.71% of the herd) and therefore other animal rearing workshops are present, such as the calves rearing where the average weaning age was relatively high (4.57 ± 1.55 months). Milk production of these farms was better than the overall average (15.8 ± 5.09 kg/DC/farm). This may be due to the high milk potential of the newly imported heifers. This cluster average CI is estimated to be 398 ± 12.8 days /DC/farm and is comparable to the overall average (Table 2).
The Cluster 3 (OF) represent 35.5% of
all farms. These are the old farms that are characterized by high experienced owners (14.6 ± 10.4 years) and older herds (cow renewal rate of 11.8 ± 17.6%). These were also characterized by medium agricultural areas (UAA = 47.3 ± 48.3 ha, FA = 16.7 ± 14.6 ha), a relatively high labour force compared to the number of animals (7.09 ± 4.11 LU/AWU), an ethnically varied composition of herds (54.4 ± 29.0% of the DC/farm are Montbeliarde). As for the dairy performances of this group of farms, it is low (DP = 12.6 ± 4.25 kg/DC/farm) while the CI is the smallest of the clusters (389 ± 19.1 days/DC/farm).
The Cluster 4 (LF) accounts only for 1.8%
of the entire sample. These are large farms with the largest agricultural area (UAA = 675 ± 246 ha, FA = 153 ± 95.7 ha). The reduced proportion of FA (24.4 ± 14.1% of UAA) indicates the presence of other agronomic activities other than livestock rearing. These farms are also characterized by the
Table 2. Dairy farms characterization and typology
Parameters UAA (ha) FA (ha) Number of DC AWU DP (kg) CI (day)
Means ± SD 42.7 ± 102 14.7 ± 28.3 18.6 ± 27 2.98 ± 1.92 14.3 ± 4.77 397 ± 20.2 East 94 ± 171a 26.2 ± 41.9a 18.7 ± 16.2a 4.12 ± 2.19a 12.8 ± 4.61a 395 ± 28.9a Center 100 ± 141ab 100ab 157 ± 38.5ab 7.0 ± 2.0ab 20.9 ± 9.30ab 393 ± 6.11a West 19.4 ± 21.9c 8.50 ± 8.26b 15.8 ± 23b 2.35 ± 1.36b 14.9 ± 4.60b 398 ± 14.9a Public 695 ± 298a 121 ± 86.7a 74.2 ± 29.8a 7.50 ± 0.58a 16.5 ± 1.44a 394 ± 6.65a Private 33.2 ± 57.3b 13.2 ± 23.9a 17.5 ± 25.9b 2.89 ± 1.82b 14.2 ± 4.79a 397 ± 20.5a Cluster 1 17.9 ± 26.9a 7 ± 5.55 10.7 ± 5.34a 2.24 ± 1.21a 14.9 ± 4.26a 405 ± 23.4a Cluster 2 19.0 ± 16.2a 8.74 ± 7.65 13.3 ± 8.17ab 2.17 ± 1.22a 15.8 ± 5.09a 398 ± 12.8a Cluster 3 47.3 ± 48.3b 16.7 ± 14.6 15.6 ± 9.68b 3.61 ± 1.84b 12.6 ± 4.25b 389 ± 19.1b Cluster 4 675 ± 246c 153 ± 95.7 49.2 ± 28.4c 8.50 ± 1.73c 14.2 ± 4.04ab 392 ± 5.48ab Cluster 5 59.9 ± 86.5ab 38.3 ± 72.1 128 ± 54.2d 6.43 ± 1.72d 18.3 ± 7.61a 394 ± 7.48ab Different letters in columns (a-d) indicate differences in p <0,05.
199
Status, Characterization and Typology of Dairy Cattle Farms in Northern Algeria
abundance of non-family workers (8.50 ± 1.73 AWU/farm), relatively large herds (65.4 ± 36.4 LU) composed mainly of DC (75.1 ± 3.79% are DC). DP is comparable to the overall mean (14.2 ± 4.04 kg/ DC/farm) and the CI is better (392 ± 5.48 days/ DC/farm).
The Cluster 5 (DF) accounts for 4.2% of the
total. these are the specialized dairy farms with the largest herds (169 ± 56.1 LU, of which 75.8 ± 16.7% are DC), the largest proportion of fodder area (80.3 ± 38.6% of the UAA) and abundant labour (6.43 ± 1.72 AWU/farm of which only 2.38 ± 6.30% are family). Farms in the latter group had the highest milk yields (18.3 ± 7.61 kg/cow/farm), and the CI was high too (394 ± 7.48 days).
Conclusion
To conclude: despite the great variability, farms in Algeria have shown a poor exploitation of their land, genetic and human resources and therefore suffer from a very limited profitability (DP = 14.3 ± 4.77 kg/cow/day/farm and a CI = 397 ± 20.2 days). The following observations were made: The areas allocated to the forage represented a small proportion (34.5%) compared to the agricultural area in the possession of these farms, finding themselves fall short to ensure the feeding of their cows and therefore rely on the concentrates to compensate (44.8%);The surface area of the cowsheds was sufficient (11.4 ± 7.68 m2/LU), but not compliant with the zootechnical standards in terms of comfort and ambient conditions (temperature and ventilation);
Feeding and reproductive management were done improvised rather than scientific.
It is recommended to improve and work on these errors and to optimize the management by using the resources available to the farms, to provide the cows with favourable conditions to maximise the expression of their genetic potential and to ensure a good profitability for the farmer.
Acknowledgments. This research did not receive any specific grant from funding agencies in the public, commercial, or not-for-profit sectors.
References
1. Allane M, Ghozlane F, Temim S, Bouzida S (2011). Les performances laitières et le bien-être animal dans les exploitations de la wilaya de Tizi-Ouzou (Algérie). Livestock Research for Rural Development. Volume 23, Article #116.
2. Bekhouche-Guendouz N (2011). Evaluation de la durabilité des exploitations bovines laitières des Bassins de la Mitidja et d’Annaba. Sciences agricoles. Institut National Polytechnique de Lorraine, 2011. Français. NNT : 2011INPL020N. 3. Belkheir B, Ghozlane F, Benidir M, Bousbia A, Benahmed N, Agguini S (2015). Production laitière, pratiques d’élevage et caractéristiques du lait en exploitations bovines laitières en montagne de Kabylie, Algérie. Livestock Research for Rural Development. Volume 27, Article #145. 4. Ben Salem M, Bouraoui R, Chebbi I (2007). Tendances et identification des facteurs de variation des paramètres de reproduction chez la vache laitière en Tunisie. Rencontres Recherches Ruminants, 2007, 14.
5. Bir A, Yakhlef H, Madani T (2014). Diversité des exploitations agricoles laitières en zone semi-aride de Sétif (Algérie). Livestock Research for Rural Development, 26 (2): article 26
6. Bouamra M, Ghozlane F, Ghozlane MK (2016). Facteurs influençant les performances de reproduction de
vaches laitières en Algérie. Livestock Research for Rural Development, 28: article 51.
7. Chehat F, Bir A (2008). Le développement durable de systèmes d’élevage durables en Algérie: Contraintes et perspectives. in Colloque international « Développement durable des productions animales: enjeux, évaluation et perspectives », ENSA, Alger, 20-21 avril.
8. El Hassani SK (2013). La Dépendance Alimentaire en Algérie : Importation de Lait en Poudre versus Production Locale, Quelle Évolution? Mediterranean Journal of Social Sciences, Vol 4 No 11, October 2013.
9. Hammami M, Sai ME (2008). Problèmes fonciers et agriculture périurbaine dans le grand Tunis: Mutations foncières et stratégies des agricultures. New Medit. volume 7, n.1, March 2008, pp. 58-64.
10. Hanafi S, Zaïri A, Ruelle P, Le-Grusse P, Ajmi T (2008). Typologie des exploitations agricoles : un point de départ pour comprendre les performances des systèmes irrigués. Troisième atelier régional du projet Sirma, Jun 2007, Nabeul, Tunisie. Cirad, 10 p., 2008. cirad-00260719. 11. Houmani M (1999). Situation alimentaire du bétail en
Algérie. Recherche Agronomique. INRA Algérie. 1999. n.4, pp. 35-45.
12. Humblot P, Grimard B (1996). Endocrinologie du postpartum et facteurs influençant le rétablissement de l’activité ovarienne chez la vache. Le point vétérinaire, 28, numéro spécial, 1996 ; pp. 73-81.
13. Kadi SA, Djellal F, Berchiche M (2007). Caractérisation de la conduite alimentaire des vaches laitières dans la région de Tizi-Ouzou, Algérie. Livestock Research for Rural Development, 19: article51.
14. Kali S, Benidir M, Ait Kaci K, Belkheir B, Benyoucef MT (2011). Situation de la filière lait en Algérie: Approche analytique d’amont en aval. Livestock Research for Rural Development. 23: article 179. 15. Kalli S, Saadaoui M, Ait Amokhtar S, Belkheir B, Benidir M, Bitam A, Benmebarek AM (2018). Éléments d’enquête générale sur la filière lait en Algérie. International Journal on Innovation and Financial Strategies (IFS) vol.1 pp. 12-19 Copyright IPCO-2018. 16. Kaouche S, Boudina M, Ghezali S (2012). Évaluation des contraintes zootechniques de développement de l’élevage bovin laitier en Algérie : cas de la wilaya de Médéa. Nature & Technologie. n° 06. Janvier 2012. Pp. 85-92. 17. Makhlouf M, Montaigne E (2017). Impact de la nouvelle politique laitière algérienne sur la viabilité́ des exploitations laitières. New Medit, vol 16, n.1, March 2017, pp. 2-10.
18. Makhlouf M, Montaigne E, Tessa A (2015). La politique laitière algérienne : entre sécurité alimentaire et soutien différentiel de la consommation. New Medit, 14 (1): 12-23.
19. Mouhous A, Alary V, Huguenin J (2014). Stratégies d’adaptation des éleveurs bovins laitiers en zone montagneuse d’Algérie. Revue d’Élevage et de Médecine Vétérinaire des Pays Tropicaux. 67 (4):193-200.
20. ONM, (2019). Office national de météorologie. http:// www.meteo.dz/climatenalgerie.php
21. Ouakli K, Yakhlef H (2003). Performances Et Modalites De Production Laitiere Dans La Mitidja. Recherche Agronomique. Volume 1, Numéro 13, 2003, pp. 15-24, INRA Algérie.
22. Soukehal A (2013). Histoire et développement de la filière lait en Algérie. Agriculture et développement, 16: 22-26. 23. Srairi MT (2004). Typologie des systèmes d’élevage
bovin laitier au Maroc en vue d’une analyse de leurs performances. Sciences de l’ingénieur [physics]. Faculté Universitaire des Sciences Agronomiques de Gembloux. 24. Srairi MT, Leblond JM, Bourbouze A (2003). Production
de lait et/ou viande : diversité des stratégies des éleveurs de bovins dans le périmètre irrigué du Gharb au Maroc. Revue d’Élevage et de Médecine Vétérinaire des Pays Tropicaux. Volume 56 (3-4): 177-186.
25. Srairi MT, Chergui S, Igueld H, Sannito Y (2014). Performances des exploitations laitières familiales au Maroc : arguments pour l’amélioration du prix du lait à la ferme et de l’appui technique. Revue d’Élevage et de Médecine Vétérinaire des Pays Tropicaux, Volume 67 (4): 183-191.
26. Wallet P, Lagel D (2011). Le logement du troupeau laitier. 3ème