Accepted Manuscript
Salinity and growth effects on dimethylsulfoniopropionate (DMSP) and
dimethylsulfoxide (DMSO) cell quotas of Skeletonema costatum, Phaeocystis globosa and Heterocapsa triquetra
Gaëlle Speeckaert, Alberto V. Borges, Nathalie Gypens PII: S0272-7714(18)30852-7
DOI: https://doi.org/10.1016/j.ecss.2019.106275 Article Number: 106275
Reference: YECSS 106275
To appear in: Estuarine, Coastal and Shelf Science Received Date: 8 October 2018
Revised Date: 21 June 2019 Accepted Date: 27 June 2019
Please cite this article as: Speeckaert, Gaë., Borges, A.V., Gypens, N., Salinity and growth effects on dimethylsulfoniopropionate (DMSP) and dimethylsulfoxide (DMSO) cell quotas of Skeletonema costatum, Phaeocystis globosa and Heterocapsa triquetra, Estuarine, Coastal and Shelf Science (2019), doi: https://doi.org/10.1016/j.ecss.2019.106275.
This is a PDF file of an unedited manuscript that has been accepted for publication. As a service to our customers we are providing this early version of the manuscript. The manuscript will undergo copyediting, typesetting, and review of the resulting proof before it is published in its final form. Please note that during the production process errors may be discovered which could affect the content, and all legal disclaimers that apply to the journal pertain.
M
AN
US
CR
IP
T
AC
CE
M
AN
US
CR
IP
T
AC
CE
PT
ED
1 Salinity and growth effects on dimethylsulfoniopropionate (DMSP) and dimethylsulfoxide 1(DMSO) cell quotas of Skeletonema costatum, Phaeocystis globosa and Heterocapsa triquetra 2
Gaëlle Speeckaert1, 2,Alberto V. Borges2, Nathalie Gypens1,*
3 4
1
Écologie des Systèmes Aquatiques, Université Libre de Bruxelles, Belgium 5
2
Unité d’Océanographie Chimique, Université de Liège, Belgium 6
7 8
9
* corresponding author: ngypens@ulb.ac.be
10 11 12 13 14 15 16 17 18 19 20 21 22 23 24 25
M
AN
US
CR
IP
T
AC
CE
PT
ED
2Abstract The effects of growth stage and salinity on dimethylsulfoniopropionate
26
(DMSP) and dimethylsulfoxide (DMSO) cellular content were investigated in laboratory
27
batch cultures of three phytoplankton species (Skeletonema costatum, Phaeocystis globosa
28
and Heterocapsa triquetra). DMSP and DMSO cell quotas of the three microalgae were
29
measured at three salinities (20, 27, 35) and in three growth phases at salinity 35. DMSP and
30
DMSO cell quotas varied along the growth for all species with an increase of DMSP for S.
31
costatum and a decrease of the DMSP to DMSO ratio (DMSP/DMSO) for P. globosa and H. 32
triquetra in late exponential-stationary phase. We hypothesized that the oxidative stress 33
caused by light and/or nutrients limitation induced the oxidation of DMS or DMSP to DMSO.
34
DMSP cell quotas increased with salinity, mostly in S. costatum and H. triquetra, for which
35
DMSP is supposed to be an osmoregulator. In H. triquetra, DMSO cell quotas stayed constant
36
with increasing salinity. DMSO was near detection limits in S. costatum experiments. In P.
37
globosa, DMSP and DMSO concentrations increased at low and high salinity. DMSO showed 38
higher increase at low salinity presumably as the result of a salinity-induced oxidative stress
39
which caused DMSP oxidation into DMSO in hyposaline conditions. We concluded that
40
DMSP acts as an osmoregulator for the three studied species and DMSO acts as an
41
antioxidant for P. globosa at low salinity. In P. globosa and H. triquetra, DMSP/DMSO
42
increase with salinity in response to salinity stress.
43
1. Introduction
44
Salinity can be one of the major limiting factor for growth and productivity of plants
45
and algae depending on their salt-tolerance (Parida and Das, 2005; García et al., 2012).
46
Salinity stress has many physiological effects on the cell such as ion toxicity, damage of
47
photosynthetic apparatus, decreased growth, lower cell volume, increased respiration,
48
disruption of enzyme activity causing shifts in metabolites, oxidative stress and changes in
49
membrane permeability (Kirst, 1990; Sudhir et al., 2004; García et al., 2012; Lyon et al.,
50
2016). Even the most euryhaline phytoplankton species are affected in their chemical
51
composition (protein, lipid and carbohydrate contents) by low or high salinity levels (García
52
et al., 2012).
53
The immediate effect of salinity changes on plant cells is rapid water fluxes due to
54
osmotic gradients that lead to volume changes and severe disturbance of the metabolism due
55
to changes in the cellular water potential. Cells respond to these immediate effects by
56
processes of osmotic acclimation to maintain a constant cell turgor. It is done firstly by the
M
AN
US
CR
IP
T
AC
CE
PT
ED
3regulation of internal inorganic ions such as K+, Na+ and Cl- (“non compatible” osmolytes),
58
and secondly by the regulation of compatible solutes (osmolytes) such as DMSP, proline and
59
glycine betaine (Stefels, 2000) which are characterized by similar structure (Vairavamurthy et
60
al., 1985). DMSP can be accumulated or released from the cell in case of salinity up- or
61
down-shock respectively (Kirst, 1996; Yang et al., 2011; Niki et al. 2007). Compatible
62
osmolytes are mainly used in case of long term salinity upshock because the concentration of
63
ions needed to counterbalance external hyperosmotic potential may be toxic for the cell
64
(Kirst, 1996).
65
Effects of salinity stress on the induction of oxidative stress has been observed in
66
plants and algae (Jahnke and White, 2003; Parida and Das, 2005; Liu et al., 2007; Tammam et
67
al., 2011). Under environmental stresses including salinity stress, Calvin cycle activity is
68
reduced causing an inhibition of nicotinamide adenine dinucleotide phosphate (NADP+)
69
regeneration and a consequent over-reduction of the electron transport chain. Under such
70
conditions, excess electrons are transferred to oxygen generating reactive oxygen species
71
(ROS), responsible of an immediate response of plants and algae (Apel and Hirt, 2004; Dring
72
2005; Tammam et al., 2011; Ahmad, 2014). To detoxify ROS, plants (including algae)
73
possess low-molecular weight antioxidants (ascorbate, glutathione, phenolic compounds,
74
tocopherols), antioxidant enzymes (superoxide dismutase (SOD), ascorbate peroxidase (APX)
75
and catalase (CAT)) and compatible solutes with regulatory roles to alleviate damaging
76
effects (Cavalcanti et al., 2007; Cuin and Shabala, 2007a; Sekmen et al., 2007; Tammam et
77
al., 2011). A greater salinity tolerance and resistance to oxidative damage comes from high
78
levels of antioxidants (Parida and Das, 2005; Tammam et al., 2011). Oxidative stress occurs
79
when the accumulation of ROS exceeds the scavenging capacity of the cell (Apel and Hirt,
80
2004; Kreslavski et al., 2007; Tammam et al., 2011; Ahmad, 2014). In case of a long term
81
stress, ROS cause damages in photosystems through desoxyribonucleic acid (DNA) mutation,
82
protein denaturation, lipid peroxidation, chlorophyll bleaching and loss of membrane integrity
83
(Leshem et al., 2007; Tammam et al., 2011).
84
The cellular content of dimethylsulfoniopropionate (DMSPp) and dimethylsulfoxide
85
(DMSOp) in marine microalgae is specific and its regulation linked to their physiological
86
functions. DMSP and DMSO productions are constitutively species-specific (Keller, 1989;
87
Hatton and Wilson, 2007; Caruana and Malin, 2014) and even strain-specific (Shen et al.,
88
2011). Dinophyceae, Prymnesiophyta and Chrysophyta being the major producers (Keller,
89
1989; Hatton and Wilson, 2007; Caruana and Malin, 2014); and Chlorophyta and diatoms low
M
AN
US
CR
IP
T
AC
CE
PT
ED
4producers with a few exceptions (Keller, 1989; Spielmeyer et al., 2011). Several authors have
91
also shown that the intracellular DMSPp to DMSOp ratio (DMSPp/DMSOp) ratio decrease
92
during the growth of A.carterae (dinoflagellate) from log phase to stationary phase as a result
93
of an increase of the DMSO intracellular pool due to limiting conditions inducing oxidative
94
stress (Simó et al., 1998; Hatton and Wilson, 2007). Other authors observed a DMSP and
95
DMS increase until late stationary and senescent stages of growth in different taxa
96
(dinoflagellates, prasinophytes, coccolithophorids and diatoms) with a positive correlation
97
with cell density (Zhuang et al., 2011; Liu et al., 2014).
98
The DMS(P,O) content of algae are also affected by many abiotic and biotic variables,
99
such as salinity, light, temperature, nutrients and growth phase. Several physiological
100
functions have been attributed to DMSP and its derivatives (DMS, acrylate and DMSO).
101
DMSP functions as an osmoregulator (Vairavamurthy et al., 1985), cryoprotectant (Kirst et
102
al., 1991), methyl donor (Kiene et al., 2000), and potentially as a ballast mechanism in
103
aflagellate phytoplankton (Lavoie et al., 2015; 2016). DMSP and its derivatives are grazing
104
deterrent (Wolfe et al., 1996). Intracellular DMSO is exclusively formed by the oxidation of
105
DMSP (or DMS) by ROS (Foote and Peters 1971; Amels et al. 1997; Sunda et al., 2002;
106
Spiese, 2010) and only acts as an osmolyte in cold environments; it is a cryo-osmoregulator
107
(Lee et al., 1999). In addition, these molecules take part of an intracellular antioxidant cascade
108
as ROS scavengers (Sunda et al., 2002). Phytoplankton cells may probably use DMSP and
109
derivatives for different functions, they are not necessarily exclusive (Harada and Kiene,
110
2011). Indeed, multifunctional osmolytes like DMSP are more likely to be selected by
111
phytoplankton species (Welsh, 2000). For example, DMSP may serve a dual role for salinity
112
stress tolerance in sea-ice diatoms; as compatible solute that lesser inhibits enzyme activity
113
than equimolar concentration of NaCl (Gröne et al., 1991) and as part of the antioxidant
114
cascade (Sunda et al., 2002;Deschaseaux et al., 2014) with DMSO, DMS, acrylate and
115
methane-sulfinic acid.
116
An increase of DMSP and/or DMS production with salinity has been observed for
117
different micro- and macroalgae species belonging to diatoms (including Skeletonema
118
costatum), prymnesiophytes (including Phaeocystis spp.) and dinoflagellates (Vairavamurthy 119
et al., 1985 ; Dickson et al., 1986; Karsten et al., 1992; Zhang et al., 1999; Zhuang et al.,
120
2011; Yang et al., 2011; Kettles et al., 2014). The increase is exponential for the
121
Haptophyceae Phaeocystis sp. (Stefels, 2000). Field studies have also revealed positive
122
correlations between DMSP or DMS and salinity from the estuarine to the coastal and shelf
M
AN
US
CR
IP
T
AC
CE
PT
ED
5environments but with differences in the phytoplankton community with mainly diatoms in
124
estuarine waters and Prymnesiophyceae in coastal and shelf waters (Iverson et al., 1989;
125
Sciare et al., 2002). The accumulation or release of DMSP in response to the extreme
126
environmental salinity gradients encountered by sea-ice diatoms is well documented (Lyon et
127
al., 2016). They can accumulate DMSP in higher concentrations than their low DMSP
128
producers temperate counterparts (Keller et al., 1989). Lyon et al. (2016) observed DMSO
129
elevations and low ROS levels above and below 35-salinity controls supporting the dual role
130
of DMSP.
131
Oxidation of DMSP (or DMS) by ROS produce DMSO, which seems to be
132
exclusively formed this way. No direct biological pathways for DMSO synthesis are known
133
so far (Kinsey et al., 2016). Therefore, concentrations of DMSO increase under oxidative
134
stress with the increasing of ROS production (Sunda et al., 2002; Kinsey et al., 2016) and the
135
intracellular DMSPp/DMSOp ratio is a good indicator of an oxidative stress (Hatton and
136
Wilson, 2007). In some high DMSP producers, mainly dinoflagellates and prymnesiophytes
137
such as Phaeocystis spp. (Keller et al., 1989; Stefels and van Leeuwe, 1998; Steinke et al.,
138
1998; Hatton and Wilson, 2007), cellular DMSP is high enough to better control ROS levels
139
than other antioxidants such as ascorbate and glutathione (Spiese, 2010). DMSO can act, in
140
turn, as an antioxidant against hydroxyl radical but DMSP and DMS are more effective for
141
that reaction because of their higher cellular concentrations with equivalent rate constants
142
(Spiese, 2010; Kinsey et al., 2016). Salinity-induced oxidative stress in hyposaline conditions
143
can lead to the increasing production of antioxidant enzymes and other antioxidant molecules
144
in the macroalgae Ulva prolifera (Luo and Liu, 2011). This effect also exists in hypersaline
145
conditions such as those encountered at low tide in the intertidal zone by macro- and
146
microalgae (Rijstenbil, 2005; Liu and Pang, 2010; Luo and Liu, 2011; Kumar et al., 2011;
147
Pancha et al., 2015).
148
In this study, we investigate cell quotas of DMSP and DMSO in acclimated batch
149
cultures of Phaeocystis globosa (P.globosa, Prymnesiophyceae), Skeletonema costatum (S.
150
costatum, Coscinodiscophyceae) and Heterocapsa triquetra (H. triquetra, Dinophyceae) in 151
different growth phases and at different salinities. We test the hypothesis for these species that
152
the intracellular DMSPp/DMSOp ratio is an indicator of a salinity stress potentially inducing
153
an oxidative stress (Simó and Vila-Costa, 2006; Hatton and Wilson, 2007).
M
AN
US
CR
IP
T
AC
CE
PT
ED
62. Materials and methods
155
2.1 Phytoplankton cultures 156
Strains of S. costatum (strain isolated from the Belgian Coastal Zone), H. triquetra
157
(strain RCC4800 from Roscoff Culture Collection) and P. globosa (strain RCC1719 from
158
Roscoff Culture Collection) were chosen for the important biomass they can reach in the
159
North Sea (Rousseau et al., 1990) and for their high DMSP and DMSO production (Keller et
160
al., 1989; Hatton and Wilson, 2007; Caruana et al., 2012).
161
S. costatum is a worldwide coastal diatom often dominant in spring blooms (Yang et 162
al., 2011). Among diatoms, this species is known as a high DMSP and DMSO producer (see
163
Table 2) (Keller et al., 1989; Hatton and Wilson, 2007; Yang et al., 2011). S. costatum is a
164
coastal euryhaline species but its optimum salinity is around 25 (Brand, 1984).
165
H. triquetra is one of the most common coastal and estuarine dinoflagellate of the 166
world. This species forms regular blooms in the German Bight of the North Sea (Litaker et al.,
167
2002; Hoppenrath, 2004). It is a mesohaline species with an optimum salinity of 30 (Baek et
168
al., 2011). As most dinoflagellates, this species is known for its high DMSP concentration
169
(see Table 2) considered as an osmolyte and for its high DMSP-lyase activity (DLA) that
170
cleaves DMSP into DMS and acrylate (Caruana et al., 2012; Caruana and Malin, 2014).
171
P. globosa is a prymnesiophyte known to form Harmful Algal Blooms (HAB) in 172
temperate and tropical waters. It has a complex polymorphic life cycle in which flagellate and
173
colonial cells express different properties but both produce high DMSP and DMSO
174
concentrations (see Table 2) with high DLA (Liss et al., 1994; Stefels and Dijkhuizen, 1996;
175
Schoemann et al., 2005; Hatton and Wilson, 2007). It is an euryhaline species with an
176
optimum salinity of 29 (Peperzak, 2002).
177
2.2 Culture growth 178
All batch cultures were grown in a natural seawater F/2 medium and maintained at
179
12°C (S. costatum and P. globosa) and 15°C (H. triquetra) on a 12:12 dark:light cycle, at a
180
photon flux density of 100 µmol quanta m-2 s-1 supplied by cool-white fluorescent lights.
181
Antibiotics (Penicilin-G and Streptomycin) were added to the cultures to prevent bacterial
182
growth. Different salinities medium (27, 20) were prepared by dilution of salinity 35 seawater
183
with Milli-Q water. Gradual acclimation of the strains from salinity 35 took two weeks to
M
AN
US
CR
IP
T
AC
CE
PT
ED
7reach salinity 27 (i.e. at least 15 generations for P. globosa and S. costatum and 5 generations
185
for H. triquetra) and four weeks to reach salinity 20 (i.e. at least 30 generations for P. globosa
186
and S. costatum and 10 generations for H. triquetra). Cultures were inoculated with
187
exponential phase acclimated cells and their growth was monitored daily by measuring cell
188
density and Chla-relative in vivo fluorescence (with a Turner Aquafluor handheld
189
fluorometer).
190
2.3 Sampling 191
Samples were collected in triplicate at early, mid and late exponential growth phase
192
for the three species at salinity 35 (the reference salinity) and only at mid-exponential for
193
salinities 27 and 20. Triplicates come from the same cultures and are only representative of
194
the variability in the culture. After collection, samples were stored for later analysis of
195
dissolved and total DMS(P,O) (DMS(P,O)d and DMS(P,O)t) using established gas
196
chromatographic (GC) techniques (See section DMS(P,O) analysis). Samples were
197
microwaved until boiling after filtration in order to inactivate DMSP-lyase (Kinsey and
198
Kieber, 2016), and avoid a possible bias of DMSP measurements (del Valle et al., 2011).
199
Samples of bulk water and filtered were then preserved with the addition of H2SO4 (5 µl of
200
50% H2SO4 per millilitre of sample), as recommended by Stefels (2009). This allows to
201
preserve the DMSP(O) content and removes DMS originally present in the sample.
202
DMS(P,O)d analyses were done on filtered culture samples and DMS(P,O)t on bulk culture
203
samples. Particulate DMSP or DMSO (DMS(P,O)p) concentration was calculated by
204
subtracting DMS(P,O)d concentration on DMS(P,O)t concentration. We adopted the small
205
volume gravity drip filtration procedure recommended by Kiene and Slezak (2006). Gentle
206
filtration of maximum 20 ml was used, only the maximum first 10 ml of filtrate were
207
collected.
208
2.4 DMS(P,O) analysis 209
DMS(P,O)d and DMS(P,O)t in diluted culture samples (dilution sufficient to get
210
concentrations below 200nmol.L-1) were analysed by GC coupled with a purge-and-trap after
211
hydrolysis to DMS by 2 pellets of NaOH in a 10ml sample (Stefels, 2009). The DMS was
212
purged with He during 20 min and trapped on a loop plunged in liquid N2. The loop was then
213
immersed into boiling water and the gas driven to the chromatographic column. We used an
214
Agilent 7890B GC equipped with a Flame Ionization Detector (FID) and a Flame
215
Photomultiplier Detector (FPD). The carrier gas (He, 2mL min-1) was split between the two
M
AN
US
CR
IP
T
AC
CE
PT
ED
8detectors. Only the values derived from the FPD were used. The FPD was kept at 350°C with
217
a H2 flow of 72mL min-1, a synthetic air flow of 72mL min-1 and a makeup (N2) flow of 20mL
218
min-1. The oven was set at 60°C. DMSP for calibration was obtained from Research Plus.
219
From this solid standard, a primary stock solution with a concentration of 2.23 mmol L-1 and
220
working solutions with concentrations in the range of 10-7 or 10-8 mol L-1 were prepared
221
successively by dilution in Milli-Q water. The same procedure was applied for DMSO from a
222
99.9% pure stock solution (Merck) to obtain working solutions of 10−7–10−8 mol L−1
223
respectively. Six dilutions of the working solution in 10ml of Milli-Q water were realized in
224
triplicate to obtain standards with concentrations from 0.5 to 200 nmol L-1 in 20ml serum
225
vials sealed with gas tight PTFE coated silicone septa. Calibration curves were realized
226
weekly for DMSP and DMSO by fitting a quadratic curve. Calibration was checked to be
227
stable during a week, by comparing curves over successive weeks. The coefficient of
228
variation was ± 10% between standards. NaOH pellets were added the day before analysis in
229
standards and samples (at least 12h prior to analysis). Concentrations of total and dissolved
230
DMSO (respectively DMSOt and DMSOd) were analyzed after total and dissolved DMSP
231
(respectively DMSPt et DMSPd) in the same culture samples after acidification and reduction
232
of DMSO into DMS using the TiCl3 method (Kiene and Gerard, 1994). DMSP samples were
233
analysed in triplicate but, due to analytical problems, part of DMSO measurements failed and
234
were removed from the result analysis.
235
2.5 Chlorophyll-a and cell counts 236
Samples for Chla measurement (10 to 50 mL) were gently filtered onto glass-fiber
237
filters (GF/F) and extracted in 90% acetone, before applying the fluorometric method of
238
Holm-Hansen et al. (1965). We measured Chla fluorescence before (430nm in excitation and
239
664nm in emission) and after acidification with 100µ L HCl 0.1N of a 3mL sample (410nm in
240
excitation and 670nm in emission).
241
A few Chla samples could have been damaged during storage as we measured high
242
concentrations of Pheophytin a compared to Chla. For these data (evidenced by a * in the
243
Tables and Figures), we used a mean ratio of active Chla estimated from the other samples of
244
this study to retrieve consistent Chla values.
245
Cell density was measured in triplicate by inverted microscopy using the Utermöhl
246
method (Hasle, 1978) following fixation with 1% lugol-glutaraldehyde. For P. globosa
247
samples, colonies were broken by agitation prior to cell counting. More than 400 cells were
M
AN
US
CR
IP
T
AC
CE
PT
ED
9counted on each sample to reach an error of 10% at a 95% level of confidence (Lund et al,
249
1958).
250
2.6 Nutrients 251
Nutrients were analysed by colorimetric methods with a spectrophotometer (UV/Vis
252
Lambda 650S Perkin Elmer). Silicate and phosphate samples were prepared by using the
253
molybdenum blue method (Koroleff, 1983b-c) and measured at 830nm and 885nm
254
respectively. Nitrate plus nitrite samples were prepared by the reduction of nitrate by
255
cadmium and then diazotization (Greiss reaction; Grasshoff, 1983) and measured at 540nm.
256
2.7 Growth rate 257
The specific growth rate (µ) was calculated from cell counts using the equation: 258
μ = (ln − ln ) (⁄ − ) (Guillard, 1973) 259
where , are the cell densities (cell.L-1) measured on cultures on days , during growth. 260
2.8 Statistical analyses 261
We performed statistical analyses on Chla contents for each species to detect any
262
significant difference between salinity treatments and growth phases. Homoscedasticity has
263
been assessed by Hartley tests. As variances were non-homogeneous for all species and both
264
parameters (except for Chla between growth phases of P. globosa), we performed
non-265
parametric tests (Kruskal-Wallis).
266
3.
Results
267
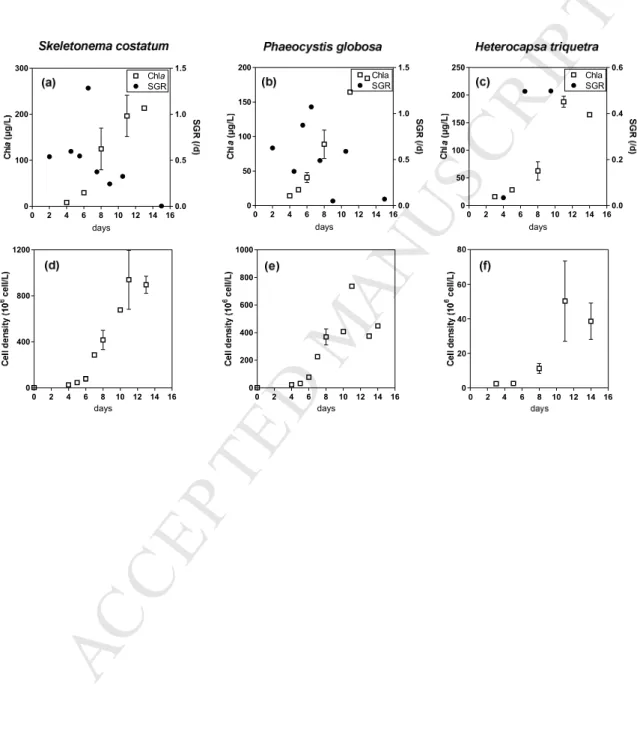
3.1 Growth curves and rates 268
Cultures of S. costatum, P. globosa and H. triquetra presented sigmoid-shaped growth
269
curves in term of Chla and cell density in the reference conditions (salinity 35; Fig.1). Growth
270
curve of S. costatum comprised a latent phase of 4-5 days, an exponential phase from day 6 to
271
11 and a very short stationary phase (1 or 2 days) before senescence (Fig. 1a, d). S. costatum
272
reached its maximum cell density and Chla between days 11 and 14 (~9.108 cell/L, ~200
273
µg/L) and its maximal specific growth rate (SGR) on day 6-7 during exponential growth
274
(1.29/day). Growth curve of P. globosa was identical to that of S. costatum in term of timing
275
but reached a lower maximal Chla (164 µg/L) value on day 11 associated to a lower
276
maximum cell density (7.108 cell/L) and a lower SGR on day 6-7 (1.1/day) (Fig. 1b, e).
M
AN
US
CR
IP
T
AC
CE
PT
ED
10Growth curve of H. triquetra differs from those of other species only by an earlier exponential
278
phase starting on day 5 and a longer stationary phase (from day 11 to 14) (Fig. 1c, f). H.
279
triquetra reached the lowest maximum cell density (5.107 cell/L) with maximum cell density
280
is 16-20 fold lower than both other cultures (Fig. 1f) but similar Chla concentrations (Fig. 1c).
281
In all salinity treatments, growth curves were sigmoid-shaped for the three species
282
(Fig. 2). Growth curves are shown in in vivo fluorescence as other growth parameters had
283
only been measured at mid-exponential growth for salinities 27 and 20. Growth curves in
284
Chla (Fig. 1a, b, c) and in vivo fluorescence (Fig. 2) are similar for salinity 35. Maximum in
285
vivo fluorescence and the timing of the different phases varied with salinity for all species. 286
Growth curves of S. costatum had similar patterns with only 20% difference between
287
maximum in vivo fluorescence. Growth curves of P. globosa were separated from the
288
beginning of exponential phase with an increase of 46% in maximum in vivo fluorescence
289
from salinity 20 to 35. Growth curves of H. triquetra were also separated from the beginning
290
of exponential phase. For the three species, the time taken for reaching stationary phase
291
decreased with salinity. Cellular Chla content decreased during growth but non parametric
292
statistical analyses (Kruskal-Wallis) showed no significant difference between salinity
293
treatments for cellular Chla content of S. costatum, P. globosa and H. triquetra (Table 1).
294
The growth of S. costatum was the least affected by the variation of salinity between
295
20 and 35 with only a 12.5% difference (not shown) between growth rates at salinity 20 (0.7
296
day-1) and 35 (0.8 day-1) and non-significant differences in cellular Chla between salinity
297
treatments. Among the three species studied, S. costatum was also the species reaching the
298
highest cell densities at all salinities and growth phases. P. globosa and S. costatum had very
299
close growth rates (0.85 and 0.79 day-1 respectively at salinity 35) but with greater variation
300
between salinities for P. globosa. For P. globosa, the greatest growth rate was computed at
301
salinity 27 reflecting its supposed optimum at salinity 29 (Peperzak, 2002). Similarly,
302
Peperzak (2002) observed a decline of the P. globosa growth rate from a stable 1/day in the
303
25 to 35 salinity range to 0.8/day at salinity 20 and to cell death at salinity 15. Maximum cell
304
density was also more variable between salinities (maximum at salinity 27) and growth phases
305
(maximum on day 8) for P. globosa cultures than in S. costatum. H. triquetra had lower
306
growth rates and in vivo fluorescence than the other two species. In our study, its growth rate
307
did not vary much with salinity (0.2-0.3) but fluorescence was minimal at salinity 20 (Fig. 2)
308
in accordance with its supposed optimum at salinity 30 (Baek et al., 2011).
M
AN
US
CR
IP
T
AC
CE
PT
ED
11The Chla/cell ratios were highly variable between species and salinity treatments
310
(Table 1) and characterized by a minimal value at salinity 27 for both H. triquetra and of S.
311
costatum cultures. For P. globosa, an abnormally low Chla (handling problem with samples) 312
measured at salinity 35 decreased the Chla/cell ratio below value measured at salinity 27 but
313
we expected, as for the two others species, a minimal value at salinity 27. For all species,
314
salinity 27 is the closest from their optimal salinity. As a result of the variation of Chla/cell
315
ratios with time and salinity, pattern of DMS(P,O)p/cell will differ from patterns of
316
DMS(P,O)p/Chla as a function of time or salinity.
317
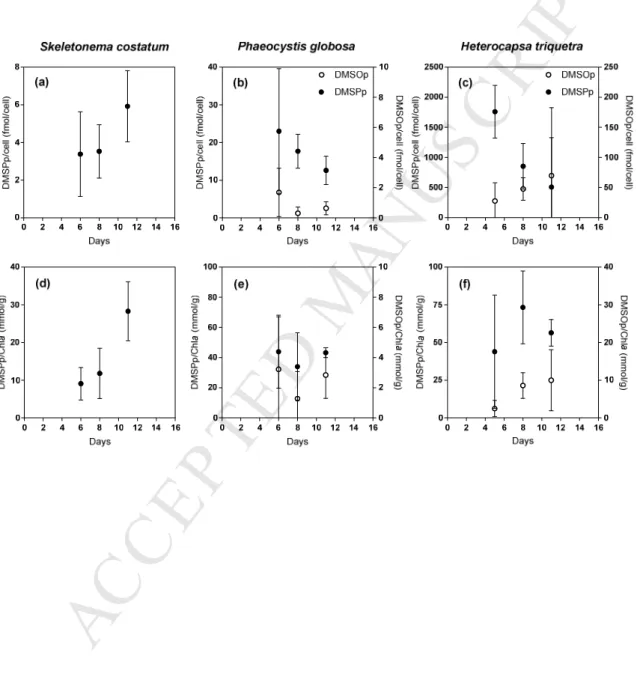
3.2 DMS(P,O) cell quotas at mid-exponential growth 318
Among the three species studied, the highest cell quotas of DMSP (853±380 fmol/cell
319
and 153±70 mmolS/gChla) and DMSO (47.7±18.5 fmol/cell, and 8.6±3.4 mmolS/gChla
320
respectively) at mid-exponential growth for salinity 35 was found in H. triquetra (Table 2). S.
321
costatum contained the lowest DMSPp and DMSOp cell quotas. DMSPp/DMSOp ratios were 322
comprised between 57±72 (P. globosa) and 17.9±5.7 (H. triquetra) (not computed for S.
323
costatum as DMSOp concentration was near the limit of detection of the GC and considered 324
as 0) (Table 2).
325
3.3 DMS(P,O)p cell quotas at different growth stages 326
In S. costatum culture (salinity 35), DMSPp cell quotas were stable during early-mid
327
exponential phase (~3.5 fmol/cell) and increased by 40% during late exponential phase (Fig.
328
3a). The same pattern is found for DMSPp per Chla units (Fig. 3 d). Among the 3 species, S.
329
costatum had the lowest cell quotas of DMSP during all growth phase. 330
In P. globosa, DMSPp per cell decreased along the growth (Fig. 3b) then
331
DMSPp/Chla was characterized by a minimal value at mid-exponential growth (Fig. 3e).
332
DMSOp showed similar pattern (Fig. 3b, c). However, considering the high uncertainty no
333
significant trend can be evidenced along P. globosa growth.
334
In H. triquetra cultures, DMSPp cell content decreased along the growth (Fig. 3c).
335
The evolution is less clear for DMSPp/Chla characterized by a maximal value at
mid-336
exponential phase (Fig. 3f). DMSOp/cell showed the opposite evolution and increased with
337
time in the H. triquetra culture (Fig. 3c). This trend is similar when considering DMSOp/Chla
338
but with higher uncertainties (Fig. 3f).
M
AN
US
CR
IP
T
AC
CE
PT
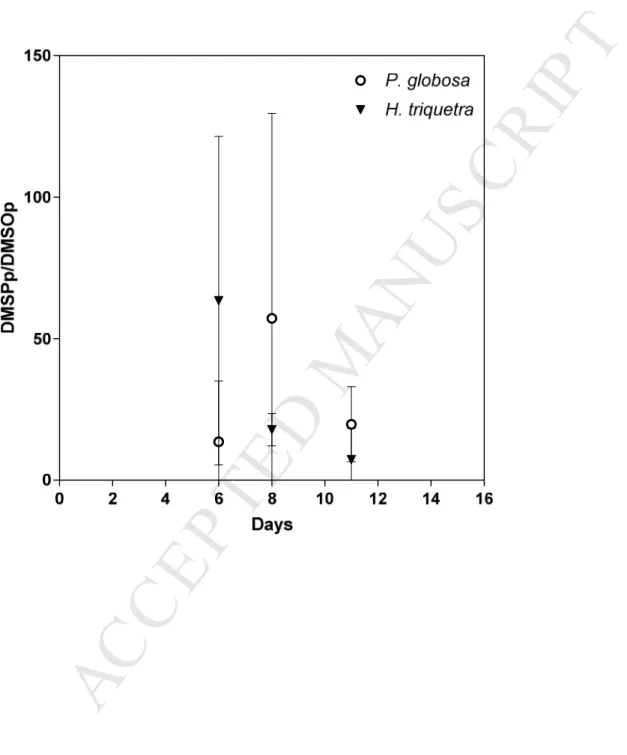
ED
12As a result, DMSPp/DMSOp ratios were maximal in mid-exponential phase of P.
340
globosa and decreased along the growth for H. triquetra cultures but considering the high 341
uncertainties no significant trend can be shown during growth experiment (Fig. 4).
342
3.4 DMS(P,O)p cell quotas at different salinities 343
In S. costatum cultures, DMSPp concentrations increased with increasing salinity in
344
per cell or Chla (Fig. 5a, d). In P. globosa, DMSPp and DMSOp were characterized by lowest
345
values at salinity 27 and increased at salinities 35 and 20 (Fig. 5b, e). In H. triquetra, DMSPp
346
increased with the increasing salinity then DMSOp stayed relatively constant whatever the
347
salinity. H. triquetra was the highest producer of both DMSPp and DMSOp in all salinities
348
(Fig. 5 c, f).
349
The average DMSPp/DMSOp ratio increased with salinity (Fig. 6). However, the high
350
uncertainties do not permit to significantly differentiate values computed at salinities 27 and
351
35 for P. globosa.
352
4
Discussion and conclusion
353
4.1 DMS(P,O)p cell quotas at different growth stages 354
In P. globosa and H. triquetra culture, while DMSPp concentration decreased (or 355
stayed relatively constant), DMSOp concentrations increased from mid- to late-exponential
356
growth phase inducing a decrease of the DMSPp/DMSOp ratio (Fig. 4). In the late
357
exponential phase of P. globosa and H. triquetra which possess DLA, DMSPp of senescent
358
cells was quickly cleaved into DMS and then oxidized into DMSO whereas only DMSP can
359
be oxidized into DMSO in DMSP-producing diatoms which do not possess DLA (Harada and
360
Kiene, 2011). DMSP-lyase may be used to regulate DMSP concentration either for the greater
361
efficiency of its by-products (DMS and acrylate) as antioxidants (Sunda et al., 2002) and
362
grazing deterrents, or as a disposal of the over-accumulated DMSP for osmotic regulation and
363
overflow mechanism (Stefels and van Leeuwe, 1998). Oxidative stress has been shown to
364
upregulate DLA, supporting its role in the antioxidant cascade (Sunda et al., 2007). That
365
would explain the coupling between DMSP decrease and DMSO increase in our experiments.
366
For S. costatum, an increase of DMSPp was observed along the growth in our
367
experiment with no effect on DMSOp concentations. For species lacking DLA like
368
S.costatum, DMSOp production could only be result from the direct oxidation of DMSPp. 369
M
AN
US
CR
IP
T
AC
CE
PT
ED
13This reaction seems to be insufficient in our experiment to induce an increase of DMSO cell
370
content that was near the detection limit of the GC during the whole experiment.
371
Nutrient limitation can induce oxidative stress and increases the production of ROS
372
(Berman-Frank et al., 2004). Sigaud-Kutner et al. (2002) observed different antioxidant
373
strategies in the three studied species according to the limiting factors leading to senescence.
374
In case of autoshading (Tetraselmis gracilis) due to a high cell density, pigment content
375
increased, ROS production did not increased and SOD activity was not induced. In contrast,
376
cultures of the diatom Minutocellus polymorphus are nutrient-limited enhancing ROS
377
production and SOD activity. Finally, the dinoflagellate Lingulodinium polyedrum exhibited
378
both antioxidant strategies. An oxidative stress induced by a limiting factor (light or nutrients)
379
could also have caused the stationary growth phase and the increasing production of ROS and
380
DMSO in our experiments.
381
Our results are in accordance to previous results that showed that diatoms (and S.
382
costatum in particular) can increase their DMSP content under nutrient limitation (Sunda at 383
al., 2002; Bucciarelli and Sunda, 2003; Sunda et al., 2007). In the case of S. costatum, this
384
limiting factor could have been phosphate with only 0.9µmol/L left at day 11 (not shown). On
385
the opposite, for species with high DMSP cellular content and the presence of DLA, increase
386
of DMSP is not still measurable as for the coccolithophore Emiliania huxleyi (Sunda et al.,
387
2007).
388
For S. costatum, P. globosa and H. triquetra, DMSPp cell quotas at salinity 35 and
389
mid-exponential growth were similar to some previous studies (Keller et al., 1989; Keller et
390
al., 1999; Caruana et al., 2012). DMSOp cell quotas were also similar to those measured by
391
Hatton and Wilson (2007) for the three species (Table 2); the only study comparable for these
392
species. DMSPp/DMSOp ratios seem highly variable between species in a same taxon and
393
between studies for the same species but ratios computed in the present study were in the
394
range of previously measured ratios (Table 2).
395
4.2 DMS(P,O)p cell quotas at different salinities 396
The three species showed different trends with salinity. In H. triquetra and S.
397
costatum cultures, DMSPp was correlated with salinity. For those species DMSOp 398
concentration stayed relatively constant (or below the detection limit for S. costatum)
399
whatever the salinity. In P. globosa, DMSPp and DMSOp evolved in parallel with minimal
M
AN
US
CR
IP
T
AC
CE
PT
ED
14DMSPp and DMSOp values at salinity 27 near the salinity optimum. P. globosa has probably
401
a higher DLA than H. triquetra (low among dinoflagellates, Caruana and Malin, 2014) and
402
thus a higher part of DMS coming from the cleavage of DMSPp which can always be
403
oxidized into DMSOp. In H. triquetra, DMSPp seemed to be cleaved to DMS intracellularly
404
in hyposaline conditions as DMSPp decrease was neither accompanied by an increase in
405
DMSOp nor by an increase in DMSPd (not shown). This result differs from those of Niki et
406
al. (2007) who observed an enhanced DMSPd production in a salinity down-shock. It is
407
possible that the short term reaction differs from the long-term reaction of an acclimated
408
culture as excretion of DMSP could be done faster than the cleavage of DMSP in order to
409
downregulate DMSP in the cell in case of rapid salinity downshock.
410
DMSPp seems to act as an osmoregulator in S. costatum, H. triquetra and P. globosa
411
(for salinity > 27) with an increase of DMSPp with salinity. This had been previously
412
observed by Zhuang et al. (2011) for dinoflagellates; by Yang et al. (2011) for S. costatum;
413
and by Zhang et al. (1999) and van Bergeijk et al. (2003) for other diatoms. S. costatum is
414
euryhaline and should than have evolved with different strategies to cope with long term
415
salinity variations (antioxidant enzymes and osmoregulators). The strain we used, originated
416
from the Belgian Coastal Zone (BCZ) is besides, dominant in Elbe and Scheldt estuaries
417
(Muylaert and Sabbe, 1999). Brand (1984) reported an optimum salinity of 25 for this species
418
but with a strain originating from the Peruvian upwelling. DMSP may also be an
419
osmoregulator for P. globosa but with a more visible effect only for higher salinities (Stefels,
420
2000). Otherwise, other molecules could act as osmoregulators instead of DMSP in P.
421
globosa. Niki et al. (2007) observed a DMSP excretion by H. triquetra cells quickly followed 422
by its cleavage in salinity down-shock conditions. The same effect seems to have occured in
423
our study, even with a decrease of DMSPd/DMSPp with the increase of salinity.
424
DMSOp seems to act as an antioxidant in P. globosa only to cope with the increase of
425
ROS in hyposaline conditions. An oxidative stress leading to an increase of antioxidant
426
enzymes (catalase, superoxide dismutase and glutathione reductase) and of other antioxidant
427
molecules (ascorbate, glutathione and beta-carotenoid) had been reported in hyposaline
428
conditions for the macroalga Ulva prolifera (Luo and Liu, 2011). This reflects the strategies
429
to cope with salinity variations for a wide salinity range euryhaline species (growing in the 10
430
to 35 salinity range; Balzano et al., 2011) and the sensibility of P. globosa to low salinities
431
(cell death at salinity 15; Peperzak, 2002) in comparison with another euryhaline species (S.
432
costatum) and a meso- stenohaline species (H. triquetra). 433
M
AN
US
CR
IP
T
AC
CE
PT
ED
15In accordance, the DMSPp/DMSOp ratio (or only DMSPp concentration for S.
434
costatum for which DMSOp was still near detection limits) increased with salinity for all 435
species. Among the three DMS(P,O) producing species studied here, different patterns
436
concerning the use of these molecules at different salinities and growth phase were observed.
437
These patterns seem to depend on the strategies they have developed to adapt to their natural
438
habitats. In particular, we assume that DMSP acts as an osmoregulator in S.costatum and H.
439
triquetra and for P. globosa for salinities higher than 27, and DMSO acts as an antioxidant in 440
P. globosa in hyposaline conditions. As salinity also induced an effect on growth parameters 441
(cell and Chla), we should use similar units when comparing salinity effect on DMSP and
442
DMSO cell quotas between different studies.
443
444
Acknowledgements
445
GS benefited from a PhD grant from the Fonds de la Recherche dans l’industrie et
446
l’agriculture (FRIA) of the Fonds de la Recherche Scientifique (FNRS). We thank Willy
447
Champenois for help and guidance with the GC analysis. We thank Marc Commarieu for
448
DMSP and DMSO analyses. NG received financial support from the Fonds David et Alice
449
Van Buuren. AVB is a senior research associate at the FNRS.
450
451
References
452
Ahmad, P. (2014). Oxidative damage to plants. Academic Press, Elsevier USA Boyer JS
453
(1982) Plant productivity and environment. Science, 218, 443–448. 454
Amels, P., Elias, H., Wannowius, K.-J. (1997). Kinetics and mechanism of the oxidation of
455
dimethyl sulfide by hydroperoxides in aqueous medium study on the potential
456
contribution of liquid-phase oxidation of dimethyl sulfide in the atmosphere. Journal
457
of the Chemical Society, Faraday Transactions, 93(15), 2537–2544. 458
Apel, K., Hirt, H. (2004). REACTIVE OXYGEN SPECIES: Metabolism, Oxidative Stress,
459
and Signal Transduction. Annual Review of Plant Biology, 55(1), 373-399.
460
https://doi.org/10.1146/annurev.arplant.55.031903.141701
M
AN
US
CR
IP
T
AC
CE
PT
ED
16Baek, S. H., Ki, J. S., Katano, T., You, K., Park, B. S., Shin, H. H., … Han, M.-S. (2011).
462
Dense winter bloom of the dinoflagellate Heterocapsa triquetra below the thick surface
463
ice of brackish Lake Shihwa, Korea. Phycological research, 59(4), 273–285.
464
Balzano, S., Sarno, D., Kooistra, W. H. (2011). Effects of salinity on the growth rate and
465
morphology of ten Skeletonema strains. Journal of plankton research, 33(6), 937–945.
466
Berman-Frank, I., Bidle, K.D., Haramaty, L., Falkowski, P. G. (2004). The demise of the
467
marine cyanobacterium, Trichodesmium spp., via an autocatalyzed cell death pathway.
468
Limnol. Oceanogr., 49(4), 997–1005.
469
Brand, L. E. (1984). The salinity tolerance of forty-six marine phytoplankton isolates.
470
Estuarine, Coastal and Shelf Science, 18(5), 543–556. 471
Bucciarelli, E., and Sunda, W. G. (2003). Influence of CO2, nitrate, phosphate, and silicate
472
limitation on intracellular dimethylsulfoniopropionate in batch cultures of the coastal
473
diatom Thalassiosira pseudonana. Limnology and Oceanography, 48 (6), 2256–2265.
474
Caruana, A. M. N., Malin, G. (2014). The variability in DMSP content and DMSP lyase
475
activity in marine dinoflagellates. Progress in Oceanography, 120, 410-424.
476
https://doi.org/10.1016/j.pocean.2013.10.014
477
Caruana, A. M. N., Steinke, M., Turner, S. M., Malin, G. (2012). Concentrations of
478
dimethylsulphoniopropionate and activities of dimethylsulphide-producing enzymes in
479
batch cultures of nine dinoflagellate species. Biogeochemistry, 110(1-3), 87-107.
480
https://doi.org/10.1007/s10533-012-9705-4
481
Cavalcanti, F. R., Lima, J. P. M. S., Ferreira-Silva, S. L., Viégas, R. A., Silveira, J. A. G.
482
(2007). Roots and leaves display contrasting oxidative response during salt stress and
483
recovery in cowpea. Journal of plant physiology, 164(5), 591–600.
484
Cuin, T. A., Shabala, S. (2007). Amino acids regulate salinity-induced potassium efflux in
485
barley root epidermis. Planta, 225(3), 753.
486
del Valle, D. A., Slezak, D., Smith, C. M., Rellinger, A. N., Kieber, D. J., and Kiene, R. P.
487
(2011). Effect of acidification on preservation of DMSP in seawater and
488
phytoplankton cultures: Evidence for rapid loss and cleavage of DMSP in samples
489
containing Phaeocystis sp. Marine Chemistry, 124 (1–4), 57-67. 3682
M
AN
US
CR
IP
T
AC
CE
PT
ED
17Deschaseaux, E. S., Jones, G. B., Deseo, M. A., Shepherd, K. M., Kiene, R. P., Swan, H. B.,
491
… Eyre, B. D. (2014). Effects of environmental factors on dimethylated sulfur
492
compounds and their potential role in the antioxidant system of the coral holobiont.
493
Limnology and Oceanography, 59(3), 758–768. 494
Dickson, D. M. J., G. O. Kirst (1986). The Role of β-Dimethylsulphoniopropionate, Glycine
495
Betaine and Homarine in the Osmoacclimation of Platymonas Subcordiformis. Planta
496
167, no. 4: 536–543.
497
Dring, M. J. (2005). Stress resistance and disease resistance in seaweeds: the role of reactive
498
oxygen metabolism. Advances in botanical research, 43, 175–207.
499
Foote, C. S., Peters, J. W. (1971). Chemistry of singlet oxygen. XIV. Reactive intermediate in
500
sulfide photooxidation. Journal of the American Chemical Society, 93(15), 3795-3796.
501
https://doi.org/10.1021/ja00744a055
502
García, N., López-Elías, J. A., Miranda, A., Huerta, M. M.-P. N., García, A. (2012). Effect of
503
salinity on growth and chemical composition of the diatom Thalassiosira weissflogii at
504
three culture phases/Efecto de la salinidad en el crecimiento y composición química de
505
la diatomea Thalassiosira weissflogii en tres fases de cultivo. Latin american journal
506
of aquatic research, 40(2), 435. 507
Grasshoff K. (1983). Determination of nitrate. . In : Methods of seawater analysis. Grasshoff
508
K., Ehrhardt M. and K. Kremling (eds). Verlag Chemie. Basel : 143-150
509
Gröne, T., Kirst, G. O. (1991). Aspects of dimethylsulfoniopropionate effects on enzymes
510
isolated from the marine phytoplankter Tetraselmis subcordiformis (Stein). Journal of
511
plant physiology, 138(1), 85–91. 512
Guillard, R. R. (1973). Division rates. Handbook of phycological methods: culture methods
513
and growth measurements. 514
Harada, H., Kiene, R. P. (2011). Assessment and characteristics of DMSP lyase activity in
515
seawater and phytoplankton cultures. Publications of the Seto Marine Biological
516
Laboratory, 41: 1-16. 517
Hasle, G. R. (1978). The inverted microscope method. Phytoplankton Manual. UNESCO,
518
Paris, 8896.
M
AN
US
CR
IP
T
AC
CE
PT
ED
18Hatton, A. D., Wilson, S. T. (2007). Particulate dimethylsulphoxide and
520
dimethylsulphoniopropionate in phytoplankton cultures and Scottish coastal waters.
521
Aquatic Sciences, 69(3), 330–340. 522
Hoppenrath, M. (2004). A revised checklist of planktonic diatoms and dinoflagellates from
523
Helgoland (North Sea, German Bight). Helgoland Marine Research, 58(4), 243.
524
Iverson, R. L., Nearhooj, F. L., Andreae, M. O. (1989). Production of dimethylsulfonium
525
3849 propionate and dimethylsulfide by phytoplankton in estuarine and coastal
526
waters. 3850 Limnology and Oceanography, 34 (1), 53-67.
527
Jahnke, L.S. , White, A.L. (2003). Long-term hyposaline and hypersaline stresses produce
528
distinct antioxidant responses in the marine alga Dunaliella tertiolecta J. Plant
529
Physiol., 160, 1193-1202
530
Karsten, Ulf, G. O. Kirst, C. Wiencke (1992). Dimethylsulphoniopropionate (DMSP)
531
Accumulation in Green Macioalgae from Polar to Temperate Regions: Interactive
532
Effects of Light versus Salinity and Light versus Temperature. Polar Biology 12, no.
533
6–7 : 603–607.
534
Kasamatsu, N., Hirano, T., Kudoh, S., Odate, T., Fukuchi, M. (2004).
535
Dimethylsulfoniopropionate Production by Psychrophilic Diatom Isolates1. Journal of
536
Phycology, 40(5), 874-878. https://doi.org/10.1111/j.1529-8817.2004.03122.x
537
Keller, M. D. (1989). Dimethyl Sulfide Production and Marine Phytoplankton: The
538
Importance of Species Composition and Cell Size. Biological Oceanography, 6 (5-6),
539
375-382
540
Keller, M. D., Bellows, W. K., Guillard, R. R. (1989). Dimethyl Sulfide Production in Marine
541
Phytoplankton.Biogenic sulfur in the environment, (393), 167-182.
542
Keller, M. D., Kiene, R. P., Matrai, P. A., Bellows, W. K. (1999). Production of glycine
543
betaine and dimethylsulfoniopropionate in marine phytoplankton. II. N-limited
544
chemostat cultures. Marine Biology, 135(2), 249–257.
545
Kettles, Nicola Louise, Stanislav Kopriva, Gill Malin (2014). Insights into the Regulation of
546
DMSP Synthesis in the Diatom Thalassiosira Pseudonana through APR Activity,
M
AN
US
CR
IP
T
AC
CE
PT
ED
19Proteomics and Gene Expression Analyses on Cells Acclimating to Changes in
548
Salinity, Light and Nitrogen. PloS One 9, no. 4 : e94795.
549
Kiene, R. P., Gerard, G. (1994). Determination of trace levels of dimethylsulfoxide (DMSO)
550
in seawater and rainwater. Marine Chemistry, 47(1), 1–12.
551
Kiene, R. P., Slezak, D. (2006). Low dissolved DMSP concentrations in seawater revealed by
552
small-volume gravity filtration and dialysis sampling. Limnology and Oceanography:
553
Methods, 4, 80–95.
554
Kiene, R. P., Linn, L. J., Bruton, J. A. (2000). New and important roles for DMSP in marine
555
microbial communities. Journal of Sea Research, 43 (3), 209–224.
556
Kinsey, J. D., Kieber, D. J. (2016). Microwave preservation method for DMSP, DMSO, and
557
acrylate in unfiltered seawater and phytoplankton culture samples. Limnology and
558
Oceanography: Methods, 14 (3), 196-209.
559
Kinsey, J. D., Kieber, D. J., & Neale, P. J. (2016). Effects of iron limitation and UV radiation
560
on Phaeocystis antarctica growth and dimethylsulfoniopropionate, dimethylsulfoxide
561
and acrylate concentrations. Environmental Chemistry, 13(2), 195–211.
562
Kirst, G. O. (1990). Salinity Tolerance of Eukaryotic Marine Algae. Annual Review of Plant
563
Physiology and Plant Molecular Biology, 41 (1), 21-53.
564
Kirst, G. O. (1996). Osmotic Adjustment in Phytoplankton and MacroAlgae. In Biological
565
and Environmental Chemistry of DMSP and Related Sulfonium Compounds, edited by 566
Ronald P. Kiene, Pieter T. Visscher, Maureen D. Keller, and Gunter O. Kirst, 121–29.
567
Boston, MA: Springer US. http://link.springer.com/10.1007/978-1-4613-0377-0_11.
568
Kirst, G. O., Thiel, C., Wolff, H., Nothnagel, J., Wanzek, M., Ulmke, R. (1991).
569
Dimethylsulfoniopropionate (DMSP) in ice-algae and its possible biological role.
570
Marine Chemistry, 35, 381–388.
571
Koroleff, F. (1983a). Determination of total silicon. Methods of seawater analysis. Grasshoff
572
K., Ehrhardt M. and K. Kremling (eds). Verlag Chemie. Basel, 174-183. 573
Koroleff, F. (1983b). Determination of total silicon. Methods of seawater analysis. Grasshoff
574
K., Ehrhardt M. and K. Kremling (eds). Verlag Chemie. Basel, 125-139. 575
M
AN
US
CR
IP
T
AC
CE
PT
ED
20Kreslavski VD, Carpentier R, Klimov VV, Murata N, Allakhverdiev SI (2007) Molecular
576
mechanisms of stress resistance of the photosynthetic apparatus. Membr Cell Biol
577
1:185–205
578
Kumar, M., Gupta, V., Trivedi, N., Kumari, P., Bijo, A.J., Reddy, C.R.K., Jha, B. (2011).
579
Dessication induced oxidative stress and its biochemical responses in intertidal red
580
alga Gracilaria corticata (Gracilariales, Rhodophyta). Environmental and Experimental
581
Botany 72, 194-201.
582
Lavoie, M., Levasseur, M., Babin, M. (2015). Testing the potential ballast role for
583
dimethylsulfoniopropionate in marine phytoplankton: a modeling study. Journal of
584
Plankton Research, 37(4), 699–711.
585
Lavoie, M., Raven, J. A., Levasseur, M. (2016). Energy cost and putative benefits of cellular
586
mechanisms modulating buoyancy in aflagellate marine phytoplankton. Journal of
587
phycology, 52(2), 239–251.
588
Lee, P. A., Haase, R., De Mora, S. J., Chanut, J.-P., Gosselin, M. (1999). Dimethylsulfoxide
589
(DMSO) and related sulfur compounds in the Saguenay Fjord, Quebec. Canadian
590
Journal of Fisheries and Aquatic Sciences, 56 (9), 1631–1638.
591
Leshem, Y., Seri, L., Levine, A. (2007). Induction of phosphatidylinositol 3-kinase-mediated
592
endocytosis by salt stress leads to intracellular production of reactive oxygen species
593
and salt tolerance. The Plant Journal, 51(2), 185–197.
594
Liss, P. S., Malin, G., Turner, S. M., Holligan, P. M. (1994). Dimethyl sulphide and
595
Phaeocystis: a review. Journal of Marine Systems, 5(1), 41–53.
596
Litaker, R. W., Tester, P. A., Duke, C. S., Kenney, B. E., Pinckney, J. L., Ramus, J. (2002).
597
Seasonal niche strategy of the bloom-forming dinoflagellate Heterocapsa triquetra.
598
Marine Ecology Progress Series, 232, 45–62. 599
Liu, W., Au, D. W., Anderson, D. M., Lam, P. K., Wu, R. S. (2007). Effects of nutrients,
600
salinity, pH and light: dark cycle on the production of reactive oxygen species in the
601
alga Chattonella marina. Journal of experimental marine biology and ecology, 346(1
602
2), 76–86.
M
AN
US
CR
IP
T
AC
CE
PT
ED
21Liu, C., Gao, C., Zhang, H., Chen, S., Deng, P., Yue, X., Guo, X. (2014). Production of
604
dimethylsulfide and acrylic acid from dimethylsulfoniopropionate during growth of
605
three marine microalgae. Chinese Journal of Oceanology and Limnology, 32, 1270–
606
1279.
607
Liu, F., Pang, S. J. (2010). Stress tolerance and antioxidant enzymatic activities in the
608
metabolisms of the reactive oxygen species in two intertidal red algae Grateloupia
609
turuturu and Palmaria palmata. Journal of Experimental Marine Biology and Ecology,
610
382(2), 82–87.
611
Lund, J. W. G., Kipling, C., Le Cren, E. D. (1958). The inverted microscope method of
612
estimating algal numbers and the statistical basis of estimations by counting.
613
Hydrobiologia, 11(2), 143–170.
614
Luo, M. B., Liu, F. (2011). Salinity-induced oxidative stress and regulation of antioxidant
615
defense system in the marine macroalga Ulva prolifera. Journal of experimental
616
marine biology and ecology, 409(1-2), 223–228. 617
Lyon, Barbara R., Jennifer M. Bennett-Mintz, Peter A. Lee, Michael G. Janech, Giacomo R.
618
DiTullio (2016). Role of Dimethylsulfoniopropionate as an Osmoprotectant Following
619
Gradual Salinity Shifts in the Sea-Ice Diatom Fragilariopsis Cylindrus. Environmental
620
Chemistry 13, 2: 181–194. 621
Muylaert, K., Sabbe, K. (1999). Spring phytoplankton assemblages in and around the
622
maximum turbidity zone of the estuaries of the Elbe (Germany), the Schelde
623
(Belgium/The Netherlands) and the Gironde (France). Journal of Marine Systems,
624
22(2-3), 133–149. 625
Niki, Takushi, Miwa Shimizu, Ayako Fujishiro, Junji Kinoshita (2007). Effects of Salinity
626
Downshock on Dimethylsulfide Production. Journal of Oceanography 63, no. 5: 873–
627
77. https://doi.org/10.1007/s10872-007-0074-x.
628
Pancha, I., Chokshi, K., Maurya, R., Trivedi, K., Patidar, S. K., Ghosh, A.,Mishra, S. (2015).
629
Salinity induced oxidative stress enhanced biofuel production potential of microalgae
630
Scenedesmus sp. CCNM 1077. Bioresource Technology, 189, 341–348.
631
Parida, A. K., Das, A. B. (2005). Salt tolerance and salinity effects on plants: a review.
632
Ecotoxicology and environmental safety, 60(3), 324–349. 633
M
AN
US
CR
IP
T
AC
CE
PT
ED
22Peperzak, L. (2002). The wax and wane of Phaeocystis globosa blooms (PhD Thesis).
634
University Library Groningen.
635
Rousseau, V., Mathot, S., Lancelot, C. (1990). Calculating carbon biomass of Phaeocystis sp.
636
from microscopic observations. Marine Biology, 107 (2), 305–314.
637
Rijstenbil, J. W (2005). UV-and Salinity-Induced Oxidative Effects in the Marine Diatom
638
Cylindrotheca Closterium during Simulated Emersion. Marine Biology 147, no. 5 :
639
1063–1073.
640
Schoemann, V., Becquevort, S., Stefels, J., Rousseau, V., Lancelot, C. (2005). Phaeocystis
641
blooms in the global ocean and their controlling mechanisms: a review. Journal of Sea
642
Research, 53(1–2), 43-66. https://doi.org/10.1016/j.seares.2004.01.008
643
Sciare, J., N. Mihalopoulos, B. C. Nguyen (2002). Spatial and Temporal Variability of
644
Dissolved Sulfur Compounds in European Estuaries. Biogeochemistry 59, no. 1–2 :
645
121–41. https://doi.org/10.1023/A:1015539725017.
646
Sekmen, A.H., Türkan, İ., Takio, S. (2007). Differential responses of antioxidative enzymes
647
and lipid peroxidation to salt stress in salt-tolerant Plantago maritima and salt-sensitive
648
Plantago media. Physiologia Plantarum, 131(3), 399–411.
649
Shen, P., Qi, Y., Wang, Y., Huang, L. (2011). Phaeocystis globosa Scherffel, a harmful
650
microalga, and its production of dimethylsulfoniopropionate. Chinese Journal of
651
Oceanology and Limnology, 29(4), 869–873. 652
Sigaud-Kutner, T. C. S., Pinto, E., Okamoto, O. K., Latorre, L. R., Colepicolo, P. (2002).
653
Changes in superoxide dismutase activity and photosynthetic pigment content during
654
growth of marine phytoplankters in batch-cultures. Physiologia plantarum, 114(4),
655
566–571.
656
Simó, R., Vila-Costa, M. (2006). Ubiquity of algal dimethylsulfoxide in the surface ocean:
657
Geographic and temporal distribution patterns. Marine Chemistry, 100(1–2), 136-146.
658
https://doi.org/10.1016/j.marchem.2005.11.006
659
Simó, R., Hatton, A. D., Malin, G., Liss, P. S. (1998). Particulate dimethyl sulphoxide in
660
seawater: production by microplankton. Marine Ecology Progress Series, 167, 291–
661
296.
M
AN
US
CR
IP
T
AC
CE
PT
ED
23Spielmeyer, A., Gebser, B., Pohnert, G. (2011). Dimethylsulfide sources from microalgae:
663
Improvement and application of a derivatization-based method for the determination
664
of dimethylsulfoniopropionate and other zwitterionic osmolytes in phytoplankton.
665
Marine Chemistry, 124(1–4), 48-56. https://doi.org/10.1016/j.marchem.2010.12.001
666
Spiese, C. E. (2010). Cellular production and losses of dimethylsulfide in marine
667
phytoplankton (PhD Thesis). State University of New York College of Environmental 668
Science and Forestry.
669
Stefels, J. (2000). Physiological aspects of the production and conversion of DMSP in marine
670
algae and higher plants. Journal of Sea Research, 43(3), 183–197.
671
Stefels, J. (2009). Determination of DMS, DMSP, and DMSO in Seawater. In: Practical
672
Guidelines for the Analysis of Seawater, 223
673
Stefels, J., Dijkhuizen, L. (1996). Characteristics of DMSP-lyase in Phaeocystis
674
sp.(Prymnesiophyceae). Marine Ecology Progress Series, 131, 307–313.
675
Stefels, J., van Leeuwe, M. A. (1998). Effects of iron and light stress on the biochemical
676
composition of Antarctic Phaeocystis sp. (Prymnesiophyceae). I. Intracellular DMSP
677
concentrations. Journal of phycology, 34 (3), 486–49
678
Steinke, M., Wolfe, G. V., Kirst, G. O. (1998). Partial characterisation of
679
dimethylsulfoniopropionate (DMSP) lyase isozymes in 6 strains of Emiliania huxleyi.
680
Marine Ecology-Progress Series, 175, 215–225. 681
Sudhir, P., Murthy, S. D. S. (2004). Effects of salt stress on basic processes of photosynthesis.
682
Photosynthetica, 42(2), 481–486. 683
Sunda, W., Kieber, D. J., Kiene, R. P., Huntsman, S. (2002). An antioxidant function for
684
DMSP and DMS in marine algae. Nature, 418(6895), 317–320.
685
Sunda, W., Hardison, R., Kiene, R.P., Bucciarelli, E, Harada, H. (2007). The effect of
686
nitrogen limitation on cellular DMSP and DMS release in marine phytoplankton:
687
climate feedback implications. Aquat. Sci. 69 (2007) 341–35
688
Tammam, A. A., Fakhry, E. M., El-Sheekh, M. (2011). Effect of salt stress on antioxidant
689
system and the metabolism of the reactive oxygen species in Dunaliella salina and
690
Dunaliella tertiolecta. African Journal of Biotechnology, 10(19), 3795–3808.