Université de Montréal
L'effet hypotenseur de l'exercice sur la PIO :
Une interaction de la condition physique et l'efficacité parasympathique ?
(The hypotensive effect of exercise on IOP : An interaction of physical fitness and parasympathetic efficacy)
par Gabrielle Roddy, MA
Département de kinésiologie
Thèse présentée à la Faculté des études supérieures et postdoctorales en vue de l’obtention du grade de Philosophie Doctor (PhD.)
en sciences de l’activité physique 25 Juillet, 2015
© Gabrielle Roddy, 2015
Faculté des études supérieures et postdoctorales
Cette thèse intitulée :
L'effet hypotenseur de l'exercice sur la PIO :
Une interaction de la condition physique et l'efficacité parasympathique ?
(The hypotensive effect of exercise on IOP : An interaction of physical fitness and parasympathetic efficacy)
présentée par : Gabrielle Roddy
a été évaluée par un jury composé des personnes suivantes :
Julie Lavoie Président Sophie LaForest Membre du jury Dave Ellemberg Directeur de recherche
Ben Thompson Examinateur Externe Stéphanie Fulton Représentant du Doyen
RÉSUMÉ
Suite à une centaine de publications sur la réduction de la PIO post-exercice, il est connu que parmi un grand nombre de programme d'exercices de différentes durées et intensités, les effets hypotenseurs de l'exercice sur la PIO sont atténués chez les sujets en bonne condition physique. Le mécanisme proposé est l'augmentation potentielle de l'efficacité du système parasympathique avec l'activité physique. Le principal objectif de cette thèse est d'identifier les facteurs contribuants à la réduction de la PIO post-exercice et d'élucider les différents mécanismes possibles.
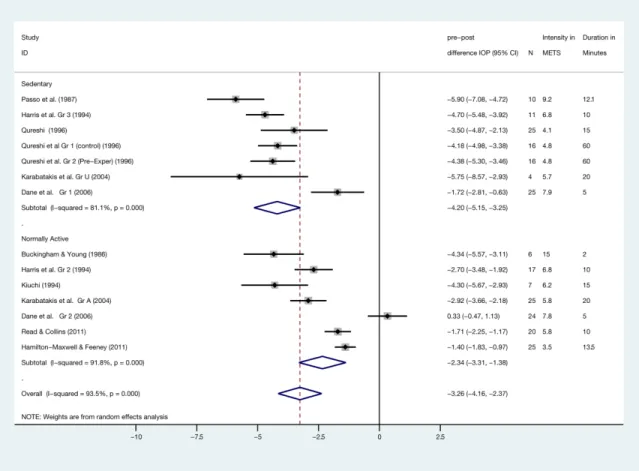
L'étude 1, une méta-analyse, a été menée afin de quantifier les contributions relatives de l'intensité et de la durée de l'effet de l'exercice sur la PIO et la mesure dans laquelle ces variables affectent les sujets sédentaires et normalement actifs. La tendance ressortant des résultats est que la diminution de la PIO suite à de l'exercice aérobie est plus élevée chez les sujets sédentaires que les sujets en bonne condition physique. (ES = -4.198 mm Hg et -2.340 mm Hg, respectivement). L'absence d'un contrôle des liquides ingérés avant l'activité physique est à souligné dans cette étude.
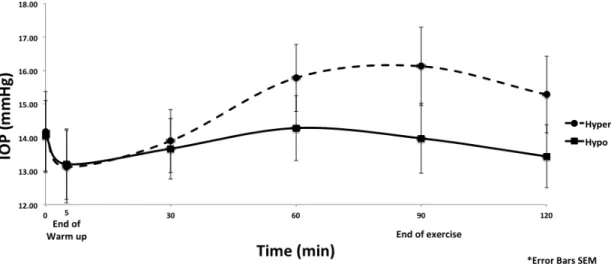
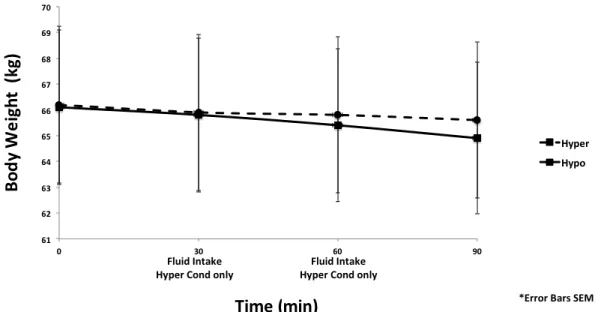
L'hyperosmolarité (un effet secondaire de la déshydratation) est l'un des mécanismes proposés influant l'effet hypotenseur de l'exercice. L'étude 2 comparait la réduction de la PIO dans deux conditions, soit hypohydraté et hyperhydraté, avant, pendant et après un effort de 90 minutes sur un ergocycle. Après une diminution initiale pour les deux conditions, la PIO revient aux valeurs de départ pour la condition hypohydratée malgré une perte de poids significative et elle augmente pour la condition hyperhydratée (résultat du protocole d'hydratation).
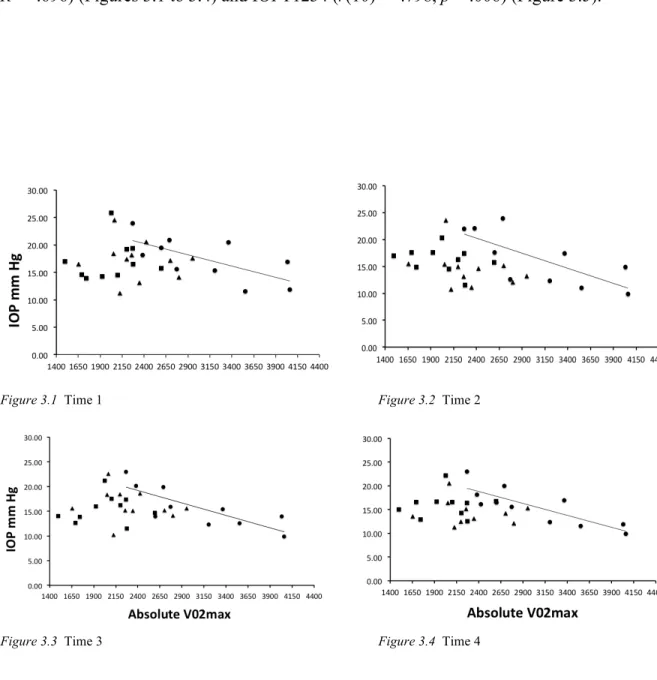
Étant donné le niveau élevé de participants en bonne condition physique dans l'étude 2, la troisième étude a été conçue afin de etude la relation entre la PIO et la condition physique. À l'aide d'analyses corrélationnelles il a été possible d'observer la relation entre le test de vo2max et la moyenne des mesures de PIO prises sur un intervalle de huit semaines. Une relation significative n'existait que pour les participants se situant dans la portion supérieure du continuum de la condition physique.
ii
Conclusion: Les résultats de la présente étude suggèrent que l'effet hypotenseur de l'exercice sur la PIO est probablement une réponse homéostatique à la dérégulation de
l'humeur aqueuse causée par l'initiation de l'exercice et le protocole d'ingestion de fluides pré-exercice.
Mots-clés : la pression intraoculaire, exercice, condition physique, ingestion de liquide, intensité, déshydration, homéostasie, sédentaire, Glaucoma, activité physique
iii Abstract
After over 100 papers on post exercise reductions in IOP it is known that under a vast number of exercise protocols, of differing intensities and durations, the hypotensive effects of exercise on IOP are attenuated in the physically fit. A proposed mechanism is the
parasympathetic nervous system that potentially increases in efficacy with physical training. The general objective of this thesis was to further tease apart those factors that contribute to post exercise reductions in IOP and to elucidate possible mechanisms.
Study 1, a meta-analysis, was conducted to quantify the relative contributions of intensity and duration to the effect of exercise on IOP and the degree to which these variables affect sedentary and normally active populations. A pattern of results emerged such that those persons who are Sedentary experience a greater drop in IOP after aerobic exercise than those who are physically fit (ES = -4.198 mm Hg and -2.340 mm Hg, respectively). A lack of pre-exercise control over covariates such as fluid ingestion was also observed.
Hyperosmolarity (a side effect of dehydration) is one of the proposed mechanisms driving the hypotensive effect of exercise. Study 2 compared reductions in IOP in both a hypo-hydrated (water restricted) and hyper-hypo-hydrated condition before, during and after an ergocycle ride of 90 minutes. After an initial decrease in both conditions, IOP returned to baseline in the Hypo-hydrated condition despite a significant loss of bodyweight and increased in the Hyper-hydrated condition as a result of the hydration protocol.
Given the high level of physical fitness among our participants in Study 2, Study 3 was designed to further elucidate the relationship between physical conditioning and IOP. Using correlational analyses we observed the relationship between a test of VO2max and an average
of IOP measurements made over the course of eight weeks. A significant relationship existed only for those participants in the upper range of the fitness continuum.
iv
Conclusion. The results of the current study suggest that the hypotensive effect of exercise on IOP is likely a homeostatic response to dysregulation of the aqueous humor caused by the initiation of exercise and pre-exercise fluid intake protocols.
Key Words: intraocular pressure, exercise, physical fitness, fluid intake, intensity, dehydration, homeostasis, sedentary, Glaucoma, physical activity
v
Table of Contents
RÉSUMÉ……… i ABSTRACT………... iii TABLE OF CONTENTS………... v LIST OF TABLES………. ix LIST OF FIGURES………... x LIST OF ABBREVIATIONS……… xi ACKNOWLEDGEMENTS……… xiii Chapter 1 General History of the Relationship Between Exercise and IOP………. 1Chapter 2 Intraocular Pressure 2.1 The Eye and IOP……….. 4
2.2 Production and Evacuation of the Aqueous Fluid……… 4
2.3 Types of Measurement Tools………... 5
2.3.1 The Goldmann Applanation Tonometer (GAT)……….... 6
2.3.2 Rebound tonometry (RB)……….. 6
2.3.3 Dynamic contour tonometry (DCT)……….. 6
2.3.4 Pneumatonometer……….. 7
2.3.5 Impression tonometry (IT)……… 7
2.3.6 Non-contact tonometry (NCT)……….. 7
Chapter 3 Fluctuations in Intraocular Pressure (IOP) 3.1 Normal Fluctuations of Intraocular Pressure (IOP)………….. 8
vi
3.1.2 Seasonal variation of IOP……….. 9
3.1.3 The impact of fluid ingestion on normal IOP……… 9
3.1.4.1 Caffeine and IOP………... 10
3.2 Other Factors in the Fluctuation of IOP………... 10
3.2.1 Age……… 10
3.2.2 Pathologically elevated IOP………. 11
Chapter 4 Exercise and IOP 4.1 The Pattern of the Hypotensive Effects of Exercise on IOP……… 13
4.1.1 Aerobic Exercise and IOP………. 13
4.1.2 Effects of intensity and duration on post aerobic exercise reductions in IOP………... 14
4.1.3 Isometric exercise and IOP……… 14
4.1.4 Aerobic versus isometric exercise………... 15
4.1.5 Weightlifting and the Valsalva maneuver………. 16
4.2 The Impact of Long-Term Physical Conditioning on Baseline IOP……… 16
4.3 Long-Term Physical Conditioning and Acute Post Aerobic Exercise Reductions in IOP………. 17
4.4 Potentially Damaging Increases in IOP With Exercise……… 18
4.4.1 Severe Glaucoma and vigorous exercise………... 19
4.4.2 Yoga………... 19
Chapter 5 Mechanisms 5.1 Possible Mechanisms Related to Dehydration and IOP………... 20
5.2 Other Proposed Mechanisms……… 21
5.2.1 Lactic Acid………. 21
5.2.2 Vascular factors………. 22
vii
5.3 Initial Reduction in IOP in the Moments After Beginning Exercise……… 23
5.4 Thesis Objective………... 24
5.5 Objectives by Study ……… 24
5.6 Conclusion……… 24
Chapter 6
Experimental Studies: Research Questions and Hypothesis
6.1 Summary of Study 1: A meta-analysis on post exercise change in IOP via acute aerobic exercise
Objectives……….. 26
Hypothesis………. 26
6.2 Summary of Study 2: Post exercise change in IOP and Dehydration
Objectives……….. 26
Hypothesis………. 26
6.3 Summary of Study 3: Baseline IOP and Physical Fitness
Objectives……….. 27
Hypothesis………. 27
6.4 Article 1: Reductions in intraocular pressure after acute aerobic exercise: a
meta-analysis……… 28
6.5 Article 2: The Progression of Exercise Induced Changes in Intraocular
Pressure as a Function of Dehydration………. 62 6.6 Article 3: Is There a Relationship Between IOP and Physical Fitness?... 91
Chapter 7 General Discussion
7.1 Results Summary: Article 1……… 119
7.2 Results Summary: Article 2………... 120
7.3 Results Summary: Article 3……… 121
viii
the Sedentary……….. 122
7.5 The Usefulness of IOP as a Biomarker of Hydration………... 123
7.6 The Clinical Usefulness of Post Exercise Reductions in IOP……… 125
7.7 Limitations of the Thesis……… 126
7.8 The Future of this Research……… 127
CONCLUSION……… 127
ix
List of Tables
Article 1: Reductions in intraocular pressure after acute aerobic exercise: a meta-analysis
Table 1.1 General characteristics of participants………... 38 Table 1.2 Study descriptions………... 39
Table 1.3 Tests of heterogeneity……… 41
Table 1.4 The contribution of group allocation, exercise intensity, duration and quantity to the overall effect size and Sequential meta-regression to
examine differential group responses………. 42 Table 1.5 Comparison of MET values and relative intensity categories……… 45
Article 2: The Progression of Exercise Induced Changes in Intraocular Pressure as a Function of Dehydration
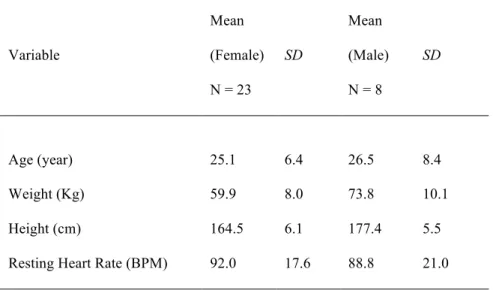
Table 2.1 Descriptive statistics……….. 69
Article 3: Is There a Relationship Between IOP and Physical Fitness?
Table 3.1 Characteristic Data………. 100
Table 3.2 Pearson Correlation table between VO2max and IOP measurements at
each time point. ………. 102
Table 3.3 Pearson Correlation table of VO2max at 3 levels and IOP measurements
x
List of Figures
Article 1: Reductions in intraocular pressure after acute aerobic exercise: a meta-analysis
Figure 1.1 Literature Search and Exclusions……… 37 Figure 1.2 Post exercise Δ IOP with a random effect model plotted for 14
independent groups. The Δ IOP is plotted along the x-axis and the 95% confidence interval is noted for each study. The dotted line
indicates the unstandardized ES of post exercise Δ IOP………. 41
Article 2: The Progression of Exercise Induced Changes in Intraocular Pressure as a Function of Dehydration
Figure 2.1 Change in IOP pre-, during and 30 minutes post exercise for the hyper and hypo-hydrated conditions, plotted as a function of time.
……… 75
Figure 2.2 Change in body weight pre-, during and post exercise for the hyper- and hypo-hydrated conditions plotted as a function of time.
……….. 77
Article 3: Is There a Relationship Between IOP and Physical Fitness? Figures 3.1 to 3.4 IOP Plotted as a Function of Absolute V02max at IOP
measurement Times 1 to 4………. 103
Figure 3.5 IOP values averaged over Times 1 to 4 and plotted as a function of
xi
List of Abbreviations
ACSM American College of Sports Medicine
BP Blood pressure
BMI Body mass index
BPM Beats per minute
CCT Central corneal thickness
CME Continuous moderate exercise
DCT Dynamic contour tonometry
ES Effect Size
GAT Goldmann Applanation Tonometry
HIT High Intensity Training
HR Heart rate
HRmax Maximal heart rate
IOP Intraocular pressure
IT Impression tonometry
METS Metabolic equivalent
MHR Maximum heart rate
mm Hg Millimetres of mercury
NCT Non-contact tonometry
OD Right eye
xii
OU Both eyes
PAR-Q Physical Activity Readiness Questionnaire
POAG Primary Open Angle Glaucoma
Q-AAAP Questionnaire sur l'aptitude à l'activité physique
RB Rebound tonometer
xiii
Acknowledgements
I would like to acknowledge Dave Ellemberg, PhD. and the Department of
Kinesiology at the University of Montreal for allowing me to pursue my interest in the science of physical activity and all things exercise. I would like to thank Jean-Marie Hanssens for allowing me to bring this project to the School of Optometry and disrupt his classes to test participants and for always bringing humour and compassion into our meetings.
I am eternally grateful to the unflappable Jean Marc Laurin for his time and
graciousness under pressure. I am equally grateful to Chantal Daigle without whom I could not have made this work. Running the VO2max tests while enjoying your guidance, patience,
humour and talks was a high point for me.
Of course, there is no experiment without participants! Thank you a million times to the 31 people came in time and again and allowed me to deprive them of water, make them ride for a long time or even just then poke them in the eyes. I don’t know why you did it, but thank you. Extra thanks goes to Amelie Roy for all the translating and encouragement and Jerome Carriott for giving 500%, and then some.
To my family and fiancé I thank you for your patience and love and support through this academic journey. You are my foundation. To Bruno Richards and Nicole Gervais, my stats gurus thank you for the many hours of guidance.
There is a special thank you, to Rick Gurnsey, PhD. at Concordia University, without whom, I would not be the writer, thinker or compulsive editor that I am today. Thank you for believing in me from day one and going beyond the call of duty.
Finally, I would also like to acknowledge, with gratitude the funding I received from NSERC and the FESP throughout my studies.
Chapter 1
General History of the Relationship Between Exercise and IOP
It is well known that exercise helps to control weight, improves musculoskeletal health and reduces the risk of Type 2 Diabetes, hypertension, cardiovascular diseases and numerous other pathologies (Sesso, Paffenbarger, & Lee, 2000; Vuori, 2004; Wannamethee, Shaper, & Alberti, 2000; World Health Organization [WHO], 2010). It also exhibits a hypotensive effect on intraocular pressure (IOP), which is the ratio between production and outflow of the aqueous humour (Reviews: Gale, Wells, & Wilson, 2009; Risner at al., 2009). Early links between exercise and IOP appeared simultaneously in fields such as aerospace medicine (Cooper et al., 1965) and exercise science (Janiszewska, 1963. In: Risner et al., 2009). Currently, there are well over 100 experimental papers on exercise and IOP, as well as case studies and reviews (e.g., Gale et al., 2009; Risner et al., 2009). Much of this research is produced with the intent of exploring the usefulness of the hypotensive effect of exercise on IOP in the management and prevention of certain eye diseases. However, despite decades of research on this topic there is little standardization with regard to exercise protocols and participant stratification across fitness, age and clinical categories. These elements are necessary to ascertain whether the magnitude of decreases in IOP produced by aerobic exercise are reliable, predictable and controllable, and ultimately clinically viable as a
complimentary therapy or even a reliable biomarker of eye health. Neither is there a consensus on the mechanism driving the effect of exercise on IOP possibly because the fluctuating value is part of a simple homeostatic response to aerobic exercise and offers no further benefit outside of the holistic benefit of exercise itself.
Exercise lowers IOP to different degrees after both aerobic and isometric exercise protocols of varying duration and intensity, although some types of resistance exercises can also produce an increase in IOP. In some studies a significant reduction occurs less than 5 minutes after beginning the exercise protocol (Buckingham & Young, 1986; Dane, Koçer, Demirel, Ucok & Tan, 2006a; Orgül & Flammer, 1994; Qureshi, 1995a,b). After the cessation
2
of exercise, IOP returns to baseline, usually within 60 minutes (Risner et al., 2009). Although the magnitude of reductions in IOP differ across studies, in general, the pattern of these findings hold true for healthy, normally active adults of all ages (Era, Parsimony, Kallinen, & Suominen, 1993; Gale et al., 2009; Marcus, Krupin, Podos, & Becker, 1970; Qureshi, Xi, Huang, & Wu, 1996b; Risner et al., 2009), sedentary subjects (Dane et al., 2006a,b; Qureshi, 1995a,b; Qureshi, 1996a; Qureshi et al., 1996b), physically conditioned people (Dane et al., 2006a,b; Harris, Malinovsky, & Martin, 1994; Passo, Goldberg, Elliot, & Van Buskirk, 1987, 1991; Qureshi et al., 1996b; Qureshi, 1996a; Qureshi, Wu, Xi, Yang, & Huang, 1997a; Qureshi, 1997b) and those with elevated IOP (Passo et al., 1991; Qureshi, 1995b; Shapiro, Wolf, Ferber, & Merin, 1983).
Another pattern that characterizes the hypotensive effect of exercise on IOP is emerging from the disparate results across studies. The results of some studies show that participants with greater physical conditioning exhibit lower baseline IOP values than sedentary and elderly participants. Further, there is an attenuated effect on IOP after acute exercise in those who are physically fit (Dane et al., 2006a,b; Harris et al., 1994; Passo et al., 1987; 1991; Qureshi, 1996a) but there is also evidence to the contrary (Dane et al., 2006a; Era et al., 1993). In the exploration of mechanisms driving the hypotensive effect of exercise the stratification of participants is especially important. A physically conditioned body will react differently to various intensities of exercise than will a sedentary one and many mechanisms proposed throughout the literature on exercise and IOP are involved in thermal and fluid regulation and are themselves conditioned by exercise (deVries & Housh, 1994a-e, Harris et al., 1994).
The general objective of this thesis was to further tease apart those factors that contribute to post exercise reductions in IOP and to elucidate possible mechanisms. To first establish the magnitude of the hypotensive effect of aerobic exercise and make a possible step toward quantifying a pattern of dose-response, the first study will compare the relative
3
The literature search pertaining to the relationship between aerobic exercise and IOP contains many suggestions as to the mechanism driving the relationship between exercise and IOP and it is often suggested that ocular hyperosmolarity such as might occur during systemic dehydration plays a role (Hunt, Feigl, & Stewart, 2012; Passo et al., 1987; Sollanek et al., 2012; Qureshi, 1996a; Williams, 2009). However, there are studies that produced results to the contrary (Harris et al., 1994; Martin, Harris, Hammel, & Malinovsky, 1999). It is possible that systemic dehydration could contribute post exercise reductions in IOP provided the duration of the exercise protocol is long enough. However, there is often an initial drop in IOP that could not possibly be related to dehydration (Buckingham & Young, 1986; Orgül & Flammer, 1994; Qureshi, 1995a; Dane et al., 2006a).
Given this potential relationship between IOP and dehydration, and based on the findings of Study 1, Study 2 will explore the notion that dehydration could ultimately cause hyperosmolarity that correlates with a decrease in IOP. To that end we will observe
participants exercising in both a state of Hypo-hydration (water restricted) and Hyper-hydration.
Finally, given the high fitness level of the participants both across the literature and within our own studies, Study 3 will explore the relationship between baseline IOP and
increased physical conditioning. V02max, one test of maximal aerobic capacity, will be used to
examine a possible correlation such that the higher a person’s V02max the lower the baseline
intraocular pressure.
The sheer number of variables attached to every aspect of the relationship between exercise and IOP demands that the current exploration begin with an overview of the variations that occur during measurement as well as those factors unrelated to exercise specifically but which contribute to the overall fluctuation of IOP. These fluctuations in IOP are often of the same magnitude as those produced by aerobic exercise and will therefore affect study results in terms of response magnitude.
4 Chapter 2 Intraocular Pressure
2.1 The Eye and IOP
Post aerobic exercise reductions in IOP are produced time and again under many circumstances. To fully understand the nature of these reductions it is necessary to first understand the cycle of the production and outflow of the aqueous humour, a clear fluid that circulates the orb of the eye and is responsible for hydration, nutrition of the avascular cornea and lens, and the removal of metabolic waste products.
2.2 Production and Evacuation of the Aqueous Fluid
The aqueous fluid is formed by secretion of the epithelium of the ciliary processes, the folded layers of the vascular area of the eye known as the choroid. First sodium, chloride and bicarbonate ions are transported into spaces in the epithelial cells. This results in osmosis of water from blood capillaries lying below the same epithelial spaces. This solution washes from the posterior chambers of the eye, passes around the equator of the lens, and flows through the pupil into the anterior chamber of the eye (Guyton & Hall, 2006a, Quigley, 2011).
The aqueous fluid leaves the eye via drainage canals between the cornea and the outer edges of the iris and then through the trabecular meshwork into a circular channel in the eye (Canal of Schlemm) that collects the aqueous humor and finally delivers it into the
bloodstream where it is absorbed. This process of production and removal generates IOP. When IOP is approximately 15 mm Hg it means that the amount of fluid leaving the eye is averaging 2.5 microlitres per minute thus approximating the production inflow (Guyton & Hall, 2006a; Quigley, 2011). As such IOP is a relatively simple homeostatic function. It can be expressed as:
5
Where F = aqueous fluid formation rate, C = outflow rate, EPV = episcleral venous pressure [of the movement away from the eye] (Guyton & Hall, 2006a; Quigley, 2011).
This regulatory control of IOP is well documented and the range of normal IOP levels are generally thought to range from 10 to 21 millimetres mercury (mm Hg). Clinically high IOP is often differentiated by repeated readings over 21.0 to 24.0 mm Hg (Bengtsson & Heijl, 2005; Quigley, 2011; Wilson, 1997).The transient reductions in IOP after exercise are usually between 1.4 and 5 mm Hg. These fluctuations are in a small range ultimately affected by many variables in addition to those produced by exercise. For example, there is an abundance of literature that examines the disruption of this homeostatic control of IOP after fluid ingestion (Diestelhorst & Krieglstein, 1994). As previously mentioned, exercise protocols are not standardized across the literature and pre-exercise fluid ingestion is one factor that could be greatly affecting study results (See section 3.13). This relationship between IOP and fluid ingestion is examined further in Study 2.
2.3 Types of Measurement Tools
Given the small range of values of post exercise reductions in IOP it is important that the measurement of IOP be as precise as possible. There are however, a great many factors involved in obtaining IOP measurements. IOP is most often measured with a process known as applanation or indentation tonometry, whereby the resistance to pressure used to applanate (flatten) or indent a small area of the cornea is quantified. The problem with most forms of applanation tonometry is that the repeated pressure of the instrument itself during the course of a study interferes with the regulation of IOP possibly by increasing the outflow of the aqueous humour (Molina, Milla, Bitrian, Larena, & Martíneza, 2010; Whitacre & Stein, 1993).
The resulting IOP values are further compromised by the thickness of the cornea.
Central corneal thickness affects most applanation measurement tools by varying resistance to the tonometer probe. A thick cornea gives rise to a greater probability of an IOP being
overestimated and a thinner cornea causes underestimation all of which can affect the results of studies on exercise and IOP. (Lee, Khaw, Ficker, & Shah, 2002).
6
The following non-exhaustive list outlines some of the differences and difficulties with the tools used to measure IOP across the literature to date.
2.3.1 The Goldmann Applanation Tonometer (GAT). The GAT is considered the gold standard in applanation tonometry (Kaufmann, Bachmann, & Thiel, 2004; Molina et al., 2010; Tonnu et al., 2005; Whitacre & Stein, 1993). The GAT uses a disinfected prism
mounted on the tonometer head, which is placedagainst the cornea. Local anesthetic drops are administered as the probe sits on the eye for number of seconds. The GAT has an
inter-observer variability of 0.4 mm Hg and an intra-inter-observer reliability of 1.7 mm Hg, 95% Limit of agreement [± 2.6 mm Hg] (Kotecha, White, Shewry, & Garway-Heath, 2005). It is the GAT to which other methods of measurement are compared.
2.3.2 Rebound tonometry (RB). The rebound tonometer uses a very lightweight probe to make momentary contact with the cornea. The higher the IOP, the faster the probe decelerates and the shorter the contact time. The measurement is barely noticed by the patient and anesthesia is not required (Kim, Jeoung, Park, Yang, & Kim, 2013). At lower GAT values the rebound tonometer can overestimate IOP but it still shows a good correlation with GAT (r = 0.6995, p < 0.001) (Kim et al., 2013). The rebound tonometer will be described in detail in the Method section of Study 2.
2.3.3 Dynamic contour tonometry (DCT). DCT uses the principle of contour
matching instead of applanation. The tip contains a hollow the same shape as the cornea with a miniature pressure sensor in its centre. In contrast to applanation tonometry it is designed to avoid deforming the cornea during measurement and is therefore less influenced by corneal thickness. However, because the shape of the tip is designed for the shape of a normal cornea it is more influenced by corneal curvature. In one comparative study the group with the lowest baseline IOP produced the greatest differences between GAT and DCT (3.55+/-3.1), the intermediate baseline group showed a negative relationship (-1.86+/-2.60), and the highest group more negative still (-3.88+/-3.3; P<0.0001) (Francis et al., 2007).
7
2.3.4 Pneumatonometer. A pneumatonometer utilizes a pneumatic (a piston floating on an air bearing) sensor. Filtered air is pumped into the piston and travels through a small (5-mm diameter) perforated membrane at one end, which is placed against the cornea. The balance between the flow of air from the machine and the resistance to flow from the cornea affect the movement of the piston and this movement is used to calculate the intra-ocular pressure. The pneumatonometer has a mean difference of 0.72 ± 2.82 mm Hg from the GAT (Molina et al., 2010).
2.3.5 Impression tonometry (IT). IT measures the depth of corneal indentation made by a small plunger carrying a known weight. The higher the intraocular pressure, the harder it is to push against and indent the cornea. The movement of the plunger is measured using a calibrated scale. The Schiøtz tonometer, which has a mean difference from GAT of +0.24 (SD = 3.18) mm Hg, is the most common device to use this principle, however it is not widely used in current research (Jain, Saini, & Gupta, 2000).
2.3.6. Non Contact Tonometry (NCT). Currently the emphasis is on creating a measurement instrument that does not interfere with the circulation of IOP around the eye. This means developing instruments that have limited, or no contact with the eye such as non-contact tonometry, which uses a rapid air pulse to applanate the cornea. Intraocular pressure is estimated by detecting the force of the air jet at the instance of applanation. Historically, non-contact tonometers were not considered to be an accurate way to measure IOP in the lab. However, modern non-contact tonometers correlate well with the GAT (mean difference from GAT ≈ 1.5 mm Hg, 95% Limit of agreement ≈ ± 3.0; Ogbuehi, 2006).
8 Chapter 3
Fluctuations in Intraocular Pressure (IOP)
3.1 Normal Fluctuations of Intraocular Pressure (IOP)
Complicating the process of obtaining accurate IOP measurements, there is a circadian fluctuation of IOP and there are a number of variables that can affect that natural rhythm (Liu & Weinreb, 2011; Liu, Zhang, Kripke, & Weinreb, 2003a; Sit, 2014). It is well known that fluctuations of IOP are ongoing throughout the day (Hamilton et al., 2007; Liu & Weinreb, 2011). They are influenced by any number of variables that are difficult to control for in any one study and greatly affect the possibility of accurate comparisons of the hypotensive effect of exercise across studies. Therefore the protocols governing IOP measurements during research need to control for these factors. Relevant to the current discussion are those factors that would necessarily affect an examination of the hypotensive effect of exercise on IOP and mechanisms related to either increased physical fitness or dehydration.
3.1.1 Diurnal variation of IOP. IOP fluctuates significantly over the course of a 24-hour period (Liu & Weinreb, 2011; Liu et al., 2003a; Liu, Bouligny, Kripke, & Weinreb, 2003b; Sit, 2014). In the general population, IOP ranges between 10 and 21 mm Hg with a mean of about 15 or 16 mm Hg, plus or minus 2.75 mmHg to 3.5 mm Hg during a 24-hour cycle (Liu & Weinreb, 2011; Quigley, 2011). It is observed that IOP quickly increases by about 3mm Hg to 4mm Hg in normal eyes when a person assumes a supine posture (lying down) regardless of the time of day. After the initial increase IOP settles at an elevated plateau, possibly because of a redistribution of body fluid in the supine position which results in a decrease in aqueous humour production (Liu et al, 2003a; Liu et al., 2003b). However, although aqueous humour production decreases at night, IOP increases nocturnally, regardless of posture (Brubaker, 1991; Liu et al., 2003b; Mosaed, Liu, & Weinreb, 2005). When a person wakes IOP is initially elevated before decreasing back to the current baseline IOP. Because the fluctuations caused by nocturnal and diurnal variation are so great, fluctuations of IOP can be greater than the post exercise reductions in IOP produced in many studies. For this reason
9
most studies on exercise and IOP are constrained to the daylight hours, usually at the same time each day and all measurements are taken in an upright position (Brubaker, 1991; Gale et al., 2009; Risner et al., 2009; Liu & Weinreb, 2011). However, it is also important to control for the activities of the participants in the hours leading up to the actual experiment, especially close to the participant’s normal waking hour.
3.1.2 Seasonal variation of IOP. It also common, in the exploration of exercise and IOP, to find that studies are confined to one of the four seasons because there is literature to suggest that IOP is subject to seasonal as well as diurnal variation. IOP is low in the summer and high in the winter and can fluctuate as much as 0.14 to 0.39 mmHg (p ≤ 0.02; Gardiner, Demirel, Gordon, & Kass; 2013), with a peak in January or February (Gardiner et al., 2013; Qureshi et al., 1996c). The mechanism responsible for seasonal fluctuations remains unclear. One suggestion is changes in the secretion of Melatonin from the pineal gland, which is affected by the daily total amount of light entering the eyes. Melatonin affects the anterior pituitary gland, and the resulting increase in the secretion of progesterone and estrogen could be increasing the outflow of IOP in the summer months (Gardiner et al., 2013). Regardless, given the small range produced by most experimental studies on exercise and IOP a change from winter to summer, or vice versa could easily obscure study results.
3.1.3 The impact of fluid ingestion on normal IOP. The ingestion of fluid has a direct and lasting effect on IOP. Yet, the protocols of many studies do not allow for comparison of this variable, although there are exceptions (Hunt et al., 2012; Moura,
Rodrigues, Waisberg, de Almeida, & Silami-Garcia, 2002). This is important with regard to the discussion of mechanisms governing post exercise reductions in IOP. In the short term, water ingestion might interfere by elevating IOP, while hyperosmolarity, caused by
dehydration, would be modulated by pre-exercise water ingestion in exercise protocols of a longer duration. Control of covariates such as pre-exercise fluid intake would greatly improve the generalization of results across studies (Sollanek et al., 2012).
A test used to diagnose pathologically elevated IOP, the water provocation test, requires that the patient rapidly drink one litre of water, then IOP is measured at 10 to
15- 10
minute intervals. Greater increases are thought to mean greater risk (Diestelhorst & Krieglstein, 1994). In one study that looked at water drinking and IOP in normally active people without ocular disease, one litre of water caused a 2.0 mm Hg increase in IOP at ten minutes post consumption and another increase at 70 minutes to 4.0 mm Hg. Baseline IOP was not regained for over 140 minutes (Buckingham & Young, 1986). These increases are as great as some post exercise reductions in IOP and would serve to nullify the effect of exercise if water is consumed to close to the beginning of the exercise protocol.
3.1.4.1 Caffeine and IOP. Because caffeine is a stimulant it has a slightly different
pattern of effect than simple water on IOP and is important to this study with regard to the coffee habits of participants in experimental studies. Tachycardia (abnormally rapid heart rate), such as can occur after coffee consumption, and increased blood flow through the vessels increases aqueous production efficacy. The results of one study found that two cups of coffee produces a rapid increase in IOP of 3.3 mm Hg that peaks between 20 and 30 minutes. IOP returned to basal values 95 minutes later (Buckingham & Young, 1986). Another study finds the same magnitude of increase and longer recovery times (Okimi, Sportsman, Pickaerd, & Fritsche, 1991). It should be noted that a more recent study found that the effect of caffeine on IOP differs with population, those with normal IOP saw no effect, while those with
pathologically elevated IOP and ocular hypertension saw a significant increase (Li, Wang, Guo, Wang, & Sun, 2011).
3.2 Other Factors in the Fluctuation of IOP
3.2.1 Age. Although hemodynamics do not often correlate with changes in IOP after exercise (Harris et al., 1994; Karabatkis et al., 2004, Kiuchi et al., 1994; Passo et al., 1987; 1991), there could be a relationship between IOP and age mediated by the dual effects of systolic blood pressure and aging (Klein & Klein, 1981; Klein, Klein, & Knudston, 1995; Leske and Podger, 1983; McLeod, West, & Quigley et al., 1990; Qureshi, 1995c; Schulzer & Drance, 1987). However, Schulzer and Drance (1987) suggest that systolic blood pressure does not necessarily rise with age before IOP begins to increase. Qureshi (1995c) observed that IOP was significantly negatively correlated with systolic blood pressure in 8036
11
participants. A progressive analysis revealed that the increase is non-significant until 40 years of age but highly significant (P < 0.001) from 41 to 60 years of age. Interestingly there is a nominal decrease during the ages of 61 to 70 and another, greater, increase in participants 70 years and older. Overall the researchers found an average increase in IOP of 0.28 mmHg per decade (Qureshi, 1995c).
Obviously, as in most research of the human body, factors of aging potentially influence any study of post exercise reductions in IOP. As we age some diseases of the eye (see the following section for an example) become increasingly prevalent, therefore the majority of studies on exercise and IOP use participants under the age of 40.
3.2.2 Pathologically elevated IOP. Glaucoma is a group of eye diseases characterized by a progressive loss of retinal ganglion cells. It is often diagnosed because of repeated higher than normal IOP measurements (Quigley, 2011). Currently Glaucoma is described as a
neurodegenerative disease with many unknown factors. However, increased IOP is still the most easily recognizable and treatable symptom of Glaucoma (Bengtsson & Heijl, 2005; Quigley, 2011). Primary Open Angle Glaucoma (POAG) is the most common subtype of Glaucoma and it occurs when the aqueous humour cannot drain properly or at all. Pressure builds within the eye damaging the sensitive nerve fibres that run from the retina to the optic nerve. Eventually visual information is lost before it reaches the cortex (Quigley, 2011). The pattern of visual field loss for those with Glaucoma is not vastly different than that of normal aging of the eyes. For that reason, coupled with the fact that elevated IOP is not painful unless the drainage canals are fully blocked, Glaucoma is often not detected until there has already been irreversible visual field loss (Gordon & Kass, 1999; Jay & Murdoch, 1993; Quigley, 2011). This is a problem when screening participants for inclusion in this type of research. Traditionally, participants with elevated IOP are not included unless the study is specifically targeting a clinical population, although that does not necessarily mean the participant has Glaucoma, especially in the absence of other factors.
The majority of studies on post-exercise reductions in IOP, which compared a clinical population to normally active or physically fit individuals, find that there is a greater reduction
12
in post-exercise IOP for those with Glaucoma (Passo et al., 1991; Qureshi, 1995b). It is for this reason that research on exercise and IOP is often elaborated with the aim of
complimentary therapy. Although clinical populations are not represented in the studies included in this thesis, it is important to understand that this is one of the motivations driving this body of literature.
Space does not permit a thorough examination of all factors that could potentially affect IOP during exercise. Therefore, the current discussion focused on those factors that appeared most often within the literature on the hypotensive effects of aerobic exercise on IOP and which are most relevant to the studies contained herein. However, there are many more factors at play such as second hand effects on IOP through systemic diseases affecting the cardiovascular system, Type 11 diabetes, and conditions that affect the normal contraction of intraocular and extraocular muscles (Bengtsson & Heijl, 2005; Gale et al., 2009; Portmann et al., 2011; Quigley, 2011).
13 Chapter 4
Exercise And IOP
4.1 The Pattern of the Hypotensive Effects of Exercise on IOP
As previously mentioned there are decades of research on the hypotensive effects of exercise on IOP. For the most part the general protocol of most experimental studies proceeds in the following manner. First, there is a pre-exercise measurement of IOP and of the vitals of the participants. After which, the participant engages in an exercise intervention of some kind, usually 90 or less minutes, the intensity of which is determined by a test of maximal (or sub maximal) capacity. IOP might or might not be measured during exercise. Finally, post exercise measurements of IOP are conducted, continuing up to 2 or 3 hours after exercise in some studies (Reviews: Gale et al., 2009 and Risner et al., 2009). It is there that the similarities between studies end. There are large variations in types of exercise, durations and intensities of exercise, fluid protocols, group descriptions, and the list goes on. For that reason the relationship between exercise and IOP, while it certainly does exist, is difficult to fully characterize.
4.1.1 Aerobic Exercise and IOP. Aerobic or dynamic exercise is generally defined as moderate intensity (≈60%) exercise that is within the cardio respiratory system’s capacity to replenish oxygen in the working muscles (Guyton & Hall, 2006b). The majority of research on the hypotensive effects of IOP centre on the acute effects produced after one bout of moderate aerobic exercise. On average research shows reductions in IOP from pre-exercise values on the order of 1.4 to 8.0 mm Hg in sedentary and normally active populations. (Reviews: Gale et al., 2009 and Risner et al., 2009).
When it comes to reductions in IOP however, all aerobic exercise is not equal. For example, Qureshi (1995b) showed that IOP decreased 2.43 mm Hg (±0.30) after walking, 3.85
14
mm Hg (±0.55) after jogging, and 4.0 mm Hg (±0.37) after running. The effects were magnified in a clinical population with elevated IOP but the pattern remained the same (Qureshi, 1995a). This discrepancy between reductions is constant in those studies that compared exercise intensity (Harris et al., 1994; Kiuchi et al., 1994; Qureshi et al., 1996b). It is suggested by these authors that exercise intensity is the limiting factor in the magnitude of reduction in IOP that can be expected post exercise.
4.1.2 Effects of intensity and duration on post aerobic exercise reductions in IOP. Across the literature there is a general consensus that relative intensity rather than duration is correlated to post exercise reductions in IOP (Harris et al., 1994; Kiuchi et al., 1994; Qureshi, 1995a,b; Qureshi et al., 1996b). The interaction between duration and intensity with regard to the hypotensive effect of exercise is less clear. Field running for 15 minutes produced
reductions in IOP of 4.3 mmHg in normally active people (Kiuchi et al., 1994) and running up and down seven flights of stairs, which takes only 2 minutes but is a higher intensity exercise also produced a reduction of 4.3 mmHg(Buckingham & Young, 1986). Finally, Ashkenazi, Melamed and Blumenthal (1992) also found a decrease of 4.1 mm Hg after a 24-hour march.
An interesting study from Conte et al. (2014), found that 30 minutes of high intensity interval training (HIT), which included 2 minutes of walking at 50% of heart rate reserve alternated with 1 minute of jogging at 80% heart rate reserve, and 30 minutes of continuous moderate exercise (CME), jogging at 60% of heart rate reserve, exerted an equally
hypotensive effect on IOP. It appears that intensity is indeed a factor in the post exercise reductions in IOP but there is a potential interaction between duration and intensity that bears further examination.
4.1.3 Isometric exercise and IOP. Static exercise, such as gripping a bar or holding a lunge, involves predominantly isometric activity (the muscle and joint angles do not change during contraction) and the active muscles usually require the anaerobic metabolism. Some research finds nominal decreases after isometric exercise, although the magnitude is
15
Dayanir, 1999; Marcus, Edelhauser, Maksud, & Wiley, 1974; Ozmerdivenli, Simsek, Bulut, Karacabey, & Saygin, 2006; Rüfer et al. 2014).
Isometric exercise can lead to hyperventilation and hypocapnia (decreased carbon dioxide levels), which is thought to correlate with reductions in IOP (Imms & Mehta, 1989; Kielar, Teraslinna, Rowe, & Jackson, 1977; Marcus et al. 1974). The results of one study showed a reduction in IOP of 2.7 mm Hg after isometric exercise (Harris, Malinovsky, Cantor, Henderson, & Martin, 1992). However, when participants maintained a normal breathing pattern rather than hyperventilating, thus maintaining carbon dioxide levels, no reduction in IOP was observed (Harris et al., 1992).
Even when discussing only isometric exercise, the type of exercise is still a factor. Chromiak, Abadie, Braswell, Koh and Chilek (2003) found the return to baseline IOP was slower after lower-body resistance training than upper-body resistance training (Chromiak, Abadie, Braswell, Koh, & Chilek, 2003). This same group also found that IOP was reduced following chest press and leg press exercises, provided the intensity of the exercise amounted to 70% of a repetition’s maximum force (Chromiak et al., 2003).
4.1.4 Aerobic versus isometric exercise. A couple of studies attempted to compare directly the disparate effects of isometric and aerobic exercise on IOP. Ozmerdivenli et al., (2006) found that aerobic exercise produced a 27% change from baseline IOP as compared to a 17% change caused by isometric exercise in a study using matched duration rather than matched intensity (Ozmerdivenli et al. 2006). Conversely. Kielar et al. (1975) compared aerobic and isometric exercise of a matched intensity and found no significant difference in the reductions in IOP.
Rüfer et al., (2014) compared aerobic exercise on a cycle ergometer to isometric exercise on a leg curl machine for the lower limbs and on a butterfly machine for the upper body. The researchers found a reduction in IOP of 2 mm Hg after cycling and did not find any reductions in IOP after upper or lower body resistance. The researchers suggested that the nominal increase (<1 mmHg) after upper body exercise might be related to an involuntary
16
Valsalva maneuver (a forced exhalation against closed lips) (Rüfer et al., 2014).
4.1.5 Weightlifting and the Valsalva maneuver. During a sustained isometric muscular contraction or extreme effort participants sometimes perform what is known as a Valsalva Manoeuvre, which is a forceful exhalation against a closed airway. When this happens during an isometric contraction, such as during weightlifting, IOP typically increases (Dickerman et al., 1999; Kiss et al., 2001; Vieira, Oliveira, de Andrade, Bottaro, & Ritch 2006). When the contraction is relaxed IOP gradually returns to baseline (Marcus et al., 1974; Movaffaghy, Chamot, Petrig, & Riva, 1998; Vieira et al., 2006).
With respect to weightlifting specifically it was found that the increase in IOP occurs whether the breath is held or not, but the magnitude of that increase changes. Vieira, Oliveira, de Andrade, Bottaro and Ritch (2006) found that IOP increased 4.3 mm Hg (±4.2) when participants held their breath and only 2.2 mmHg (±3.0) when breathing was normal (Vieira et al., 2006). Brody, Erb, Veit, and Rau (1999) further showed that a Valsalva maneuver
increases IOP whether one is exercising or not.
4.2 The Impact of Long-Term Physical Conditioning on Baseline IOP
There is evidence that physical conditioning(Harris et al., 1994; Passo et al.,
1987,1991; Qureshi, 1996a; Williams, 2009) and physical labour in the workplace (Qureshi et al., 1997a), induce adaptations of the sympathetic nervous system that contribute to an overall reduction in baseline IOP. Study 3 explores this notion further but in general a greater
reduction in IOP after exercise is observed in sedentary populations, some of who exhibit a higher baseline IOP, as compared to those who are physically active, however, this is not often quantified (Harris et al., 1994; Passo et al., 1987, 1991; Qureshi, 1996a). As of the writing of this thesis there are very few controlled studies on the long-term effects of exercise on IOP and the relationship between levels of IOP and level of physical fitness are far from clear.
In one field study, Qureshi, Wu, Xi, Yang and Huang (1997a) divided 150 male volunteers from a steel factory into two groups. The subjects of Group 1 were sedentary
17
workers, whereas the job descriptions of Group 2 included regular heavy exertion. Physical fitness was evaluated by the measurement of maximal oxygen uptake (VO2max). IOP was
significantly lower in those whose job description included moderate or severe exertion. The VO2max difference between Groups 1 and 2 was found to be 5.1 ± 1.1 ml/kg/min (p <0.001)
and the difference in baseline IOP was 1.9 ± 0.7 mmHg (p <0.001).
Passo, Goldberg, Elliot and Van Buskirk (1987) found that baseline IOP was reduced by 1.3 mmHg (p <0.02) after long-term exercise conditioning of three months and it returned to pre-conditioning levels after three weeks. Qureshi (1996a) replicated this pattern of results in a study of 32 sedentary age-matched males, categorized equally into control and exercise groups. After three months, baseline IOP values decreased by 0.31 mm Hg (+/- 0.11, p < 0.05) and 1.37 mm Hg (+/- 0.15, p < 0.001) in control and exercise groups, respectively (Qureshi et al., 1996b). The combined evidence suggests those who are physically fit could potentially maintain a baseline IOP that is lower than those who are sedentary (Harris et al., 1994; Passo et al., 1987, 1991; Qureshi, 1996a).
Conversely,Sargent et al. (1981) found that although the physically conditioned participants in their study had a lower baseline IOP as compared to those who were sedentary, both groups experienced a significant and comparable decrease in IOP over 6 months of conditioning. The researchers concluded that there is no correlation between physical fitness and baseline IOP. They performed a multiple regression analysis for each individual group and for combined groups and found that changes in IOP were not dependent upon changes in physical fitness. However, IOP is generally higher in the winter. Because the study was 6 months in duration and covered fall to winter it is possible that the seasonal drop in the
summer months obscured the results between the groups (Gardiner et al., 2013; Qureshi et al., 1996c).
4.3 Long-Term Physical Conditioning and Acute Post Aerobic Exercise Reductions in IOP
post- 18
aerobic-exercise reductions as well as baseline IOP, such that those who are physically fit experience a blunted effect of exercise on IOP.In the aforementioned study, Passo et al. (1987) found that before 3 months of training, acute exercise decreased IOP in Sedentary participants by 41% from baseline. After three months of exercise conditioning, three days per week, acute exercise reduced IOP by 12% from baseline, a reduction that persisted for an average of three weeks in some participants (Passo et al., 1987).
Qureshi and colleaguesreplicated the decrease in baseline IOP after exercise in a number of studies (1995b, 1996b, 1997a, 1997b). In one study the acute decreases following the first exercise test were 4.18 mmHg (±0.41) and 4.38 mmHg (±0.47) in control and experimental groups, respectively. After 3 months these values were 4.12 (±0.45) and 2.69 (±0.28) mmHg and the mean recovery time, post exercise, was reduced by 43.03% (Qureshi et al., 1996b).
The opinion on the effect of physical fitness on reductions in IOP is not unanimous however. A study by Dane et al. (2002a) showed that highly conditioned athletes produced a significant increase in IOP before decreasing to baseline. In the sedentary group IOP
immediately decreased and remained decreased at 30 minutes and up to 2 hours post exercise (Dane et al., 2002a,b). Ozmerdivenli et al. (2006) found IOP was significantly decreased compared with pre-exercise values when measured after both aerobic and anaerobic exercise in both athletes and sedentarians. However, they also found that the magnitude of the decrease was not significantly different between the two groups (Ozmerdivenli et al., 2006).
4.4 Potentially Damaging Increases in IOP With Exercise
It is important to note that in some clinical populations the effect of vigorous exercise on IOP is a negative one and participant selection criteria should be designed accordingly. Although this thesis does not deal with clinical populations, this section serves to illustrate the transient nature of the relationship between exercise and IOP.
19
4.4.1 Severe Glaucoma and vigorous exercise. The majority of studies suggest that exercise not only lowers IOP in those with Glaucoma, but that it does so to a greater degree than in normal populations. However, there is some evidence to show that vigorous aerobic exercise might be damaging to those with severe Glaucoma. The results of three case studies in young adults show a transient visual field decrease in patients with Glaucoma after vigorous aerobic exercise (Uhthoff’s Syndrome). Although the researchers were unable to infer the mechanism of the transient vision loss, processes related to demyelination of the optic nerve and disruption of the optic blood flow were discussed (Haynes, Johnson, & Alward, 1992; Shah, Whittaker, Wells, & Khaw, 2001).
4.4.2 Yoga. There is also some controversy regarding the effect of regularly practiced headstands, such as during yoga classes. One notable study looked at the effects of the
headstand on IOP in 75 long-term yoga practitioners. They found that despite a two-fold increase in IOP during the headstand, across age groups, there was no increased incidence of ocular hypertension, and no correlation between risk factors contributing to Glaucoma and the magnitude of the increase in IOP (Baskaran et al., 2006). However, other studies find that repeated and prolonged headstands can potentially cause deficits in the visual field
(Bertschinger, Mendrinos, & Dosso, 2007; Gallardo, Aggarwal, Cavanagh, & Whitson, 2006; Jonas, 2007).
Although the aforementioned anomalies exist, overall, the literature on the hypotensive effect of exercise on IOP is of a positive nature, or at least part of a normally functioning ocular system. There is no doubt that exercise has an effect on IOP. Whether the effect is hypotensive or hypertensive, IOP fluctuates with all exercise, to some degree, in the majority of populations. The enormous variety of pre-exercise control and exercise protocols across the literature make the results of these studies difficult to synthesize. Further, a possible
relationship between physical fitness and IOP could have significant implications regarding the mechanism or mechanisms driving the hypotensive effect of exercise on IOP.
20 Chapter 5
Mechanisms
There is no consensus on what mechanisms contribute to the reduction of IOP after acute aerobic exercise. Over the decades changes in colloid osmotic pressure (one factor in capillary fluid exchange), increases in plasma osmolarity, ocular blood flow, increased blood lactate, and decreases in blood PH were all posited as possible mechanisms that initiate a reduction in IOP (Harris et al., 1992; Harris et al., 1994; Hunt et al., 2012; Karabatakis et al., 2004; Kiuchi et al., 1994; Martin et al., 1999). However, Ashkenazi et al. (1992) found no correlation between the magnitude of reduction in IOP and blood lactate level, pH, serum proteins or haematological parameters after a 24-hour march that produced reductions in IOP of 4.1 mm Hg (Ashkenazi et al, 1992).
Although all of the aforementioned mechanisms are present in both anaerobic and aerobic exercise, increased osmolarity (hyperosmolarity) is found only during aerobic
exercise. Hyper-osmolarity, such as occurs during systemic dehydration, has received renewed interest in recent literature as a possible modulator of exercise induced reductions in IOP in exercise protocols of longer durations (Hunt et al., 2012; Moura et al., 2002; Sollanek et al., 2012).
5.1 Factors Related to Dehydration and IOP
When people sweat over time processes such as an increase in plasma osmolarity, which results in low sodium, potassium and chlorine (electrolytes) and colloid osmotic pressure (pressure exerted by proteins in blood plasma) occurs. This is because the sweating that occurs during moderate to heavy exercise results in shift of fluid from the plasma to the interstitial fluid (Guyton & Hall, 2006b, c, d). To maintain normal osmotic pressure water diffuses in the direction necessary through cell membrane. This raises the concentration of non-diffusible substances of interstitial fluid, resulting in water transfer across cell membranes of various tissue cells from intra to extracellular components therefore the tissues also become
21
dehydrated. Thus a higher proportion of electrolytes (sodium, potassium and chlorine) are secreted through sweat (deVries & Housh, 1994a, b, d; Guyton & Hall, 2006c, d). This homeostatic process has the potential to cause osmotic changes in the retinal and uveal
vasculature. It is suggested that it could that ultimately could reduce the volume and formation of intraocular fluids, thereby reducing IOP (Guyton & Hall, 2006b, Martin et al., 1999).
As humans acclimatize to progressive heat through training they sweat more profusely which increases the plasma volume and diminishes the loss of electrolytes, thereby
maintaining plasma osmolarity (deVries & Housh, 1994a, b, d; Guyton & Hall, 2006d). Via this mechanism, dehydration is delayed and possibly the deregulation of IOP as well (Martin et al., 1999). Other indices of hydration such as hematocrit and plasma protein concentration are not shown to exert effect on IOP (Feitl & Krupin, 1996). Because the sweating mechanism is known to improve with physical conditioning, it is an important variable in any study of IOP as a possible marker of hydration.
There are many other proposed mechanisms that are not as widely studied in the current literature on exercise and IOP but were posited as contenders in the past. In all cases the proposed mechanisms are a part of systems that increase in efficacy with long-term physical conditioning and they bear mentioning because of their relationship to the fitness level of the participants.
5.2 Other Proposed Mechanisms
5.2.1. Lactic Acid. The discrepant results across studies with regard to the role of lactic acid in post exercise reductions of IOP might be explained by differences in how our energy system works under different conditions. When exercise is so vigorous (>75% VO2max) so as not to allow sufficient oxygen exchange, the metabolic cycle is abbreviated
resulting in lactate production (deVries & Housh, 1994b; Guyton & Hall, 2006b). Therefore, a long moderate run and a short sprint will use different energy systems and might lower IOP through different mechanisms (Harris et al., 1994).
22
It is also argued that the relationship between IOP and increased lactate is seen only in anaerobic exercise (Kielar et al., 1975). In people who are extremely physically fit lactate production is slower to occur as such they can perform at high intensities longer than those who are sedentary before build up occurs (deVries & Housh, 1994b; Farrell, Wilmore, Coyle, Billing & Costill, 1979; Harris et al., 1994). Although the exact punitive effects of increased lactic acid on IOP are unknown, a correlation between reductions in IOP and increased lactate production would suggest a relationship to absolute rather than relative intensity markers contrary to much of the literature on post exercise reductions in IOP.
5.2.2 Vascular factors. There are many other factors that potentially contribute to normal fluctuations in IOP that have to do with the hemodynamics of the body and eyes. With regard to exercise their influence is widely debated. The majority of studies on exercise and IOP report no relationship with IOP and blood lactate, blood PH, diastolic blood pressure, heart rate or ocular perfusion pressure or blood flow (Harris et al., 1992; Karabatakis et al., 2004; Kiuchi et al., 1994; Krejci, Gordon, Moran, Sargent, & Magun, 1981; Passo et al., 1987; Qureshi, 1996a). The studies contained within the current thesis did not pursue the vascular influences on IOP during exercise therefore they are not discussed in detail here.
5.2.3 Adrenaline. Another possible mechanism driving the hypotensive effect of exercise on IOP is hormonal regulation by an increased release of adrenaline (Güngör et al., 2002; Qureshi et al., 1997a; Qureshi, 1997b). There is the suggestion that the extra adrenaline increases outflow through the trabecular meshwork and reduces aqueous humour formation (Wang, Hayashi, Yablonski, & Toris, 2002). In clinical practice, patients often begin treatment with β-adrenergic antagonist eye drops to lower IOP (Quigley, 2011). However, there is a steeper increase in metabolic demand when sedentary people begin exercising causing the adrenaline to be released in a different time pattern than that of very fit participants.
To further complicate the characterization of the relationship between exercise and IOP, the results of some studies show an initial drop in IOP that could not possibly be related to dehydration (Buckingham & Young, 1986; Dane et al., 2006a; Orgül & Flammer, 1994; Qureshi, 1995a,b) and would likely be driven by a different mechanism.
23
5.3 Initial Reduction in IOP in the Moments After Beginning Exercise
The progression of reductions in IOP during exercise is not clearly linear. Often, when exercise first begins IOP drops significantly within the first 5 minutes, after which IOP usually fluctuates to varying degrees, most often decreasing further as exercise continues
(Buckingham & Young, 1986; Dane et al., 2006a; Orgül & Flammer, 1994; Qureshi, 1995a,b; Qureshi et al., 1996b).
Orgül and Flammer (1994) took a closer look at this pattern and found that even 8 to 10 seconds of deep knee bending produces nominal post-exercise reductions of 1.9 +/- 0.3 mmHg in 17 young men, compared with 0.8 +/- 0.2 mmHg for the 15 men who did nothing before the second IOP measurement. If hyperosmolarity is indeed a factor in the mechanisms that govern post exercise IOP it could not occur in the first 5 minutes of exercise. Orgül and Flammer (1994) found a correlation between the relative decrease in IOP and increase in heart rate, a correlation not often found after longer durations (Harris et al., 1992; Karabatakis et al., 2004; Kiuchi et al., 1994; Krejci et al., 1981; Passo et al., 1987; Qureshi, 1996a; Qureshi et al., 1996b). Possibly, mechanisms related to acute homeostatic balance are at play for shorter duration exercise protocols or when exercise is initiated.
There is no doubt that exercise exerts an effect on IOP. The effect can be nominal or robust, and occurs under a vast number of combinations of intensity and duration of exercise. The hypotensive effect of IOP seems to present in participants differently dependent on their level of physical conditioning. It is possible that exactly for that reason, the mechanism, or mechanisms remain unknown. It is also possible that different mechanisms are at play for the initiation of exercise and for exercise protocols of longer durations.
24 5.4 Objective of Thesis
The general objective of this thesis was to further elucidate the pattern of results emerging from the vast literature on the effect of exercise on IOP and begin to clarify a possible direction for the standardization of exercise protocols in this area of study. A further aim of the current thesis is to elucidate the mechanisms at play during post aerobic exercise reductions in IOP, specifically those that relate to the parasympathetic nervous system.
5.5 Objectives by Study
In the first study of this thesis, a meta-analysis will be conducted to quantify the relative contributions of intensity and duration to the effect of exercise on IOP and the degree to which these variables affect sedentary and normally active populations (Section 6.4, Study 1). It is posited that the effect will be greater for those that are deemed to be physically fit than for those who are sedentary.
In the second study, we will observe participants riding an ergocycle for 90 minutes to further explore relationship between dehydration and post exercise reductions in IOP (Section 6.5, Study 2). We propose that after an initial decrease, further reductions in IOP will correlate with loss of body weight when fluids are restricted and that there will be little movement in IOP when fluids are held constant.
Finally, Study 3 will attempt to clarify the relationship between physical fitness and baseline IOP by correlating four discrete baseline measures conducted over an eight-week period, and a single test of VO2max on an ergocycle (Section 6.6, Study 3). We suggest a
linear relationship between baseline IOP and V02max such that the higher a person’s V02max
the lower the baseline intraocular pressure.
5.6 Conclusion
The hypotensive effect of exercise is widely studied and much debated. Study protocols and the magnitude of results are inconsistent across the literature, regardless, there are patterns emerging from these results that bear examination. One pattern shows that
25
reductions in IOP are blunted for those who are physically fit compared to those who are sedentary or who have elevated IOP. The attenuated effect of exercise in a conditioned person is possibly related to an increased efficacy of the parasympathetic system. A better
understanding of the way exercise impacts the IOP of people of differing fitness levels and how the duration and intensity of the various exercise protocols factor into that relationship, is necessary to elucidate our understanding of the mechanisms that drive the hypotensive effects of exercise on IOP.
26 Chapter 6
Experimental Studies: Research Questions and Hypothesis
6.1 Study 1. A meta-analysis on post exercise change in IOP via acute aerobic exercise
Objectives. The meta-analysis was designed to analyse the data from a group of studies that investigated the relationship between acute aerobic exercise and IOP, in order to obtain a quantitative estimate of the overall effect of this intervention. Specifically, our objective was to quantify the relative contributions of intensity and duration to the effect of exercise on IOP and the degree to which these variables affect sedentary and normally active populations.
Hypotheses.
H1) We propose that the hypotensive effect of exercise on IOP will be robust and will differ between populations that are sedentary and those that are physically fit.
6.2 Study 2. Post exercise change in IOP and Dehydration
Objectives. To observe a possible correlation between progressive reductions in IOP during exercise and systemic dehydration participants will perform a 90-minute ride on an ergocycle. In the hyper-hydrated condition water will be available during the ride. In the hypo-hydrated condition water will be restricted. Both weight and IOP will be measured before, during and after the exercise protocol.
Hypotheses.
H1) Using change in body weight as a measure of hydration, we propose that IOP will correlate with loss of body weight when fluids are restricted and that there will be little movement in IOP when fluids are held constant.
27
H2) It is possible that we will also replicate initial reductions in IOP when the exercise begins that are unrelated to dehydration and more likely related to changes in level of activity.
6.3 Study 3. The Correlation Between Baseline IOP and Physical Fitness
Objectives. To clarify the relationship between maintained physical conditioning and baseline IOP the current study will perform four discrete baseline measures conducted over an eight-week period, and a single test of VO2max on an ergocycle. In this way we hope to
analyze the correlation between baseline IOP and a person’s level of physical conditioning.
Hypothesis.
H1) There will be a negative correlation between baseline IOP and V02max such that
the higher a person’s V02max the lower the baseline intraocular pressure.
H2) At the higher end of V02max values, it is further proposed that baseline IOP will
6.4 Article 1
29
A meta-analysis on post exercise change in IOP via acute aerobic exercise: Looking toward prevention of POAG.
Gabrielle Roddy1, Daniel Curnier1 and Dave Ellemberg1 University of Montreal, Department of Kinesiology