Abdirahman M. Omar
1,2
, Are Olsen2,
1
, Truls Johannessen
2,1
, Mario Hoppema
3
, Helmuth Thomas
4,5
, and Alberto V. Borges
6
1Geophysical Institute, University of Bergen, Allégaten 70, 5007 Bergen, Norway.2Bjerknes Centre for Climate Research, University of Bergen, Allégaten 55, N-5007 Bergen, Norway.
3Alfred Wegener Institute for Polar and Marine Research, Climate Sciences Department, Postfach 120161, 27515 Bremerhaven, Germany.
Spatiotemporal variations of fCO
2
in the North Sea
(Published: Ocean Science Discussion, 6, 2009)
Geophysical Institute University of Bergen
4. Seasonal/spatial variations
Throughout the North Sea, fCO
2show clear seasonal changes (Fig 2,
upper middle) driven by mixing plus biology, sea surface temperature
(SST) changes, and air-sea CO
2flux (Fig 3, upper far right).
Strongest gradients were observed along the meridional transect where
fCO
2decreased northwards (-12 µatm per degree latitude). This is
maintained partly by northward decreasing solar radiation input (through
SST). The rest is probably maintained by permanent mixing (which brings
up remineralized carbon into the surface) in the southern North Sea.
Averaged over the whole basin, the NS is CO
2undersaturated throughout
the year and thus an annual sink of atmospheric CO
2. However, the
southern parts become a source during summer and fall (Fig 2B) .
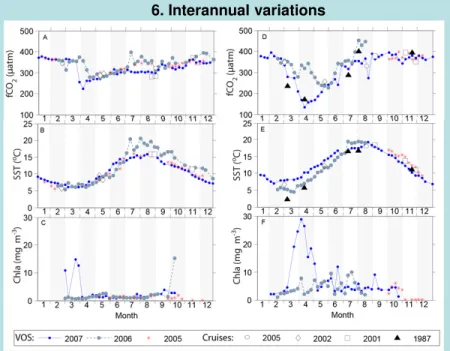
Year-to-year fCO
2variations are large throughout the basin and driven
mainly by changes in SST and spring bloom (Fig 4, lower middle).
However, changes in alkalinity and eutrofication level may also be
important in the south.
Data from Jan - Feb showed the least year-to-year differences (±10 μatm,
Fig 4A and 4D) suggesting that only observations from these months may
be appropriate for the determination of any decadal fCO
2trend due to
increased atmospheric CO
2.
Shelf seas are thought to be substantially contributing to the global
ocean’s uptake of atmospheric CO
2(Chen and Borges 2009 and
references therein).
The North Sea (NS) is one of the best studied shelf seas and acts as
”continental shelf pump”—local uptake of atmospheric carbon followed by
formation and transport of subsurface water to the deep ocean (Thomas et
al., 2004). Despite this, neither the seasonal fCO
2cycle nor its year-to-year
variability is well documented.
This work analyses the first high frequency fCO
2dataset from the NS
gathered along two transects (Fig. 1) by Voluntary Observing Ships (VOS).
Here we focus on the spatiotemporal variations from seasonal to
interannual time scales.
2. Summary of results
1. Introduction
5. Seasonal forcing
Figure 3: Monthly changes in fCO2as
observed (A) and expected due to: SST changes (B), air-sea CO2exchange (C),
SSS changes (D), and biology plus mixing (E). Negative values reflect a decrease in fCO2 compared to the
previous month and vice versa
7. References
Chen, C.T.A. and Borges, A.V.: Reconciling opposing views on carbon cycling in the coastal ocean: continental shelves as sinks and near-shore ecosystems as sources of atmospheric CO2, Deep-Sea Res. II, in press, doi:10.1016/j.dsr2.2009.01.001, 2009.Omar. Thomas, H., Bozec, Y., Elkalay, K. and De Baar, H.: Enhanced
open ocean storage of CO2 from shelf sea pumping, Science, 304, 1005–1008, 2004.
A. M. Omar, A. Olsen, T. Johannessen, M. Hoppema, H. Thomas, and A. V. Borges: Spatiotemporal variations of fCO2in the North Sea, Ocean Sci.
Discuss., 6, 1655-1686, 2009.
8. Acknowledgements
OBSERVED SST AIR-SEA FLUX SSSBIO & MIXING
3. Data
Figure 1: Map of the North Sea with tracks (blue) of the
VOS ships (Nuka Arctica and Trans Carrier) during 2005 – 2007. Dashed rectangles indicate two sites at which the interannual variability is investigated using data from years and locations shown on the insets where blue indicates VOS tracks; red, green, and grey denote cruise tracks with underway fCO2measurements; black show cruise stations.
Figure 2: Hovmöller plots of SST (A and C) and fCO2difference (∆fCO2) (B and D) between the atmosphere and ocean along the meridional (A and B) and zonal
(C and D) transects (see Fig 1). The seasonal cycles shown in the figure are for a composite year and comprise data acquired in 2005-2007. Negative ∆fCO2values indicate a CO2flux directed into the ocean and vice versa.
6. Interannual variations
Figure 4: Seasonal cycles for fCO2(A and D), SST (B and E), and co-located SeaWiFS Chlorophyll-a (C and F) for different years. All data was
averaged weekly. Panels A-C show data acquired from a 1.0°x1.0° site on the northern North Sea (Fig 1) for which underway fCO2and SST data
from 2001, 2002, and 2005-2007 are available. Panels D-F show data acquired from a 0.6°x1.0° site in the southern North Sea (Fig 1) for which also station data from 1987 are available in addition to underway data from 2001, 2002, and 2005-2007.
This is a contribution to the EU IP CARBOOCEAN (Contract no. 511176-2). This work would not have been possible without the generosity and help of liner companies SeaTrans AS and Royal Arctic Lines, and the captains and crew of Trans Carrier and Nuka Arctica.