aKey Laboratory of Agro-products Quality and Safety Control in Storage and Transport Process, Ministry of Agriculture and Rural Affairs/Institute of Food Science and Technology, Chinese Academy of Agricultural Sciences, Beijing 100193, PR China
bState Key Laboratory for Biology of Plant Diseases and Insect Pests, Institute of Plant Protection, Chinese Academy of Agricultural Sciences, Beijing 100193, PR China cInstitute of Chinese Medicinal Materials, Mianyang Academy of Agricultural Sciences, Mianyang 621023, PR China
dNational Resource Center for Chinese Materia Medica, China Academy of Chinese Medical Sciences, State Key Laboratory Breeding Base of Dao-di Herbs, Beijng 100700, PR China
eGembloux Agro-Bio-Tech, University of Liège, Passage des Déportés 2, 5030 Gembloux, Belgium
A R T I C L E I N F O Keywords:
UHPLC-MS/MS Pesticides Multiresidues
Traditional Chinese Medicine Modified QuEChERS
A B S T R A C T
A robust and high-throughput method was developed for the determination of 108 pesticide residues in Traditional Chinese Medicines (TCMs) simultaneously using a combination of UHPLC-MS/MS analysis and the modified QuEChERS method. Extraction was carried out in acetonitrile containing 0.75% (v/v) acetic acid with ultrasonication for 15 min; MgSO4and C18 were used as the dispersive-solid phase extraction sorbents. The
method exhibited good linearity (r2 > 0.9901), in addition to good selectivity, precision and repeatability.
More than 92% of pesticides exhibited high rates or recovery in the 70–120% range. This method showed high sensitivity, with Limits of Quantitation in the 0.01–20 ng/mL range in Cortex Moutan, and 0.01–50 ng/mL in the other TCMs. The method was employed for the analysis of 39 real samples from different habitats, and pesticides were detected in 92.3% of the samples, with 26 pesticides being detected in these three TCMs. More than four pesticides were detected in a third of the samples. Among them, tebuconazole was detected in all the three TCMs with 0.22–22.02 μg/kg concentration, which was lower than the provisions in GB 2763-2019 (50 μg/kg). In addition, the paclobutrazol detection rate in Ophiopogon japonicus was 100%, and the detected concentrations of 9 samples exceeded the Maximum Residue Levels defined for vegetables (50 μg/kg). Considering there are no regulations that govern the limits of pesticide residues in the three TCMs in China, we recommend the accel-eration of efforts to introduce appropriate regulations.
1. Introduction
Traditional Chinese Medicine (TCM) has a long history in China and is gaining popularity globally for the treatment of various diseases. The tuberous roots of Ophiopogon japonicus (Thunb.) Ker-Gawl. (Liliaceae), called Maidong in Chinese and mainly produced in the Sichuan Province, are a popular TCM. It is used to treat acute cough, numerous cardiovascular diseases and sore throats with relatively few side effects [1–3]. The rhizomes of Polygonatum odoratum (Mill.) Druce, called Yuzhu in Chinese, which are mainly produced in the Hunan Province, are used to treat fever, dry cough, heart disease, diabetes, tuberculosis, etc. Cortex Moutan, the bark of Paeonia suffruticosa Andr, which is
called Mudanpi in Chinese, and is produced mainly in the Anhui Pro-vince, promotes blood circulation and resolves blood stasis. Previous studies have reported that 65–80% of the global population prefer treatments based on medicinal plant products over chemical treatments [4,5]. In addition to their medicinal effects, O. japonicus and P. odor-atum are incorporated widely in daily diets in China.
In recent years, safety of TCMs has gained more attention in China, owing to their therapeutic effects and edible safety. Similar to other food products, TCMs are exposed to contaminants external con-taminations such as pesticides, which are used in the course of growth, harvesting, storage and processing. The high demand for TCM has in-creased their scale of artificial cultivation. In addition, pesticides are
https://doi.org/10.1016/j.jchromb.2020.122224
Received 23 February 2020; Received in revised form 3 May 2020; Accepted 4 June 2020
⁎Corresponding authors at: Key Laboratory of Agro-products Quality and Safety Control in Storage and Transport Process, Ministry of Agriculture and Rural
Affairs/Institute of Food Science and Technology, Chinese Academy of Agricultural Sciences, Beijing 100193, PR China (B. Fan, Z.-Q. Kong and X.-F. Dai). E-mail addresses:fanbeicaas@163.com(B. Fan),kongzhiqiang@caas.cn(Z.-Q. Kong),daixiaofeng_caas@126.com(X.-F. Dai).
1These authors contributed equally to this paper.
Available online 07 June 2020
inevitably used to increase their production both in the wild and in artificial systems, and pesticide residues may affect the safety of such TCMs.
The World Health Organization[6]has established guidelines and criteria to ensure TCM quality. However, currently, China has only defined a few limits for pesticide residues in TCMs; which has led to inconsistencies in standards between exporting and importing coun-tries, which, in turn, affects the global trade in TCMs. In China, Max-imum Residue Levels (MRL) for approximately 600 pesticides have been defined for food. However, limits for only 5 organochlorine pes-ticides have been defined for only 5 TCM materials such as ginseng[1]. The European Pharmacopoeia and the United States Pharmacopoeia have set much more limits for pesticide residues in TCMs. The European Pharmacopoeia (EP8.0) [7] and the United States Pharmacopoeia (USP38) [8]have established MRLs for a total of 105 pesticides in-cluding organophosphorus, organochlorine and pyrethroid pesticides. However, the standards do not specifically target the TCMs studied in this article; therefore, to take into account the Limits of Quantitation (LOQ) of the instrument and the pesticide residues in the real samples, the limits will be compared with those in GB 2763-2019[9]. We con-ducted field investigations in Sichuan Province and observed that pa-clobutrazol, a growth retardant used in large-scale, was applied in the cultivation of O. japonicas to increase production. However, some stu-dies have shown that the application of paclobutrazol could affect ac-tive substances, for example, by inhibiting saponin accumulation in O. japonicas, in turn, affecting its quality [10,11]. Therefore, the devel-opment of a convenient, accurate, quantitative, and sensitive methods for the analysis of pesticide residues in TCMs is essential for the ap-propriate application of different types of pesticides during TCM cul-tivation.
The Quick Easy Cheap Effective Rugged and Safe multiresidue (QuEChERS) method is a novel sample preparation methodology for pesticide multiresidue analysis which was first reported in 2003[12]. The main reason why QuEChERS is widely used is that it can achieve rapid and effective extraction. Some researchers have modified the method and made it applicable in some complex matrix like TCM [13–16]. Due to complex components of TCMs and trace amounts of pesticides in herbs, it is difficult and challenging to detect pesticides in TCMs. Various analytical methods have been developed for the detec-tion of pesticide residues in TCMs, in addidetec-tion to some novel detecdetec-tion technologies and rapid inspection technologies like dual-readout im-munochromatographic assay [17], sweeping-micellar electrokinetic chromatography [18], and enzyme inhibition method [19], some common methods such as gas chromatography or liquid chromato-graphy coupled with different detectors including flame photometric detector (FPD) [20,21], electron capture detector (ECD)[22,23], ni-trogen phosphorus detector (NPD)[24]are often used. However, the most common methods are gas chromatography-mass spectrometry (GC–MS) [13,25], gas chromatography-tandem mass spectrometry (GC–MS/MS)[26–29], and liquid chromatography-tandem mass spec-trometry (LC-MS/MS) [30–34]. Since most pesticides decompose at high temperatures, derivatization may be required while using GC, which makes the method complicated and time consuming[34]; thus, LC-MS/MS is the most commonly used detection method. Ultra High Performance Liquid Chromatography coupled to Tandem Mass Spec-trometry (UHPLC-MS/MS) can provide qualitative and quantitative information for a wide range of analytes[35]. Its dynamic multiple reaction monitoring (dMRM) mode not only has the advantages of MRM mode, such as reduced interference and improved instrument analysis accuracy[36], but can also scan in positive and negative ion modes simultaneously. This saves analysis time and improves efficiency considerably. Owing to these features, the popularity of the technology is increasing gradually.
The aim of this study was to develop a robust and high-throughput method for the simultaneous determination of 108 pesticides (including insecticide, fungicides, herbicides and plant growth regulators) in
TCMs. This approach is based on the rapid and sensitive UHPLC-MS/MS method coupled with a modified QuEChERS method, which uses a dispersive-solid phase extraction (d-SPE) clean-up procedure. The de-tection was optimized for the qualification and quantitation of each analyte within 21 min per sample. We investigated the optimal volume of the water and the extraction solvent, acid concentrations, ultrasonic extraction time, type and amount of the sorbent, because these are the major factors which affect the extraction and clean-up efficiency. To assess the efficacy of the method, it was used to analyze 108 pesticides in several batches of O. japonicus, P. odoratum and Cortex Moutan.
2. Materials and methods
2.1. Chemicals and reagents
A total of 108 pesticides with purity exceeding 98.0% were pur-chased from Dr. Ehrenstorfer (LGC Standards; Augsburg, Germany). Acetonitrile, methanol, formic acid, and ammonium acetate were HPLC-grade and were purchased from Thermo Fisher Scientific (Fisher, NJ, USA). Sodium chloride (NaCl) and anhydrous magnesium sulfate (MgSO4) were purchased from Beijing Chemical and Reagent (Beijing,
China). Primary secondary amine (PSA), octadecylsilyl (C18), graphi-tized carbon (GCB), TPH (500 mg/6 mL) and TPT (500 mg/6 mL) SPE cartridges were obtained from Agela technologies Co., Ltd (Tianjin, China). Nanomaterials including different sizes of multi-walled carbon nanotube (MWCNT) (< 8nm, 10–20 nm, 20–30 nm) and Al2O3
(10–20 nm) were purchased from Macklin Biochemical Co., Ltd (Shanghai, China). Multi-plug filtration clean-up (m-PFC) was obtained from Lumiere Tech Ltd (Beijing, China). Ultra-pure water was obtained using a Milli-Q water purification system (Millipore, Bedford, MA, USA). O. japonicus, P. odoratum and Cortex Moutan used in method optimization and validation processes were obtained from the test field, where it could be verified that no target pesticides had been applied. The real samples of the three TCMs were purchased online from Tmall.com. A total of 12 samples of O. japonicus were purchased, and 11 samples originated from Sichuan and the other sample originated from Zhejiang; 14 samples of P. odoratum were purchased, and 13 samples originated from Hunan and the other sample originated from Anhui; 13 samples of Cortex Moutan were purchased, and 12 samples originated from Anhui and the other sample originated from Yunnan. All the TCM samples were ground into fine powder using a high-speed pulverizer and passed through a 0.25 mm sieve and then stored at −20 °C prior to analyses.
2.2. Chromatography and mass spectrometry conditions
Chromatographic separation was carried out on a 1290 Infinity UHPLC system coupled to a 6495A Triple Quadrupole mass spectro-meter (Agilent Technologies, Wilmington, DE, USA) equipped with a degasser, a binary pump, and an electrospray ionization source (AJS ESI), with dynamic multi reaction monitoring for detection to obtain the highest response and best sensitivity. All target pesticides were separated in an alternative column, Agilent Poroshell 120 EC C18 column of 100 mm × 3.0 mm, 2.7 μm (Agilent Zorbax Eclipse), at 40 °C. This column enables a good peak shape and separation for these target analytes and moderately reduced the coeluting interference from the matrices. In addition, the composition of the mobile phase could considerably influence the separation of the analytes and the perfor-mance of the ionization process. The mobile phases were water con-taining 0.05% formic acid and 2.5 mmol/L ammonium acetate (phase A), and pure methanol (phase B). Furthermore, gradient elution was carried out as the follows: 0–0.5 min, 10% B; 0.5–5 min, 10–50% B; 5–20 min, 50–100% B; 20–21 min, 100% B; 21–21.1 min, 100–10% B; finally, the mobile phase was maintained for 2 min under the initial conditions to rebalance the system before the subsequent injection with a flow rate of 0.4 mL/min. Under such gradient elution conditions, the
detection can be completed within 21 min; with every pesticide well separated and good peak shapes. Afterwards, 2 μL of the sample or standard solution was injected into the column. The target pesticides were determined using dMRM, where both positive ion and negative ion mode exist simultaneously. For the mass spectrometry analysis, nitrogen was supplied as the nebulizer and the collision gas. The ion source parameters were set as follows: a capillary voltage of 3.5 kV for the positive mode and 3 kV for the negative mode; a source temperature of 150 °C; a desolvation temperature of 325 °C; a sheath gas (argon) flow rate of 15 L/h; and a drying gas (nitrogen) flow rate of 11 L/h. The retention time, parent ion, daughter ion, mode, and collision energy
were optimized individually for each of the analytes and are listed in Table S1. The UHPLC-MS/MS dMRM chromatograms of the 108 pes-ticide standards and TCM samples have been illustrated inFig. 1. 2.3. Standard solution preparation
The stock solutions of each of the pesticides were prepared at a concentration of 1000 mg/L in acetonitrile or methanol. Prior to the analysis, a stock of multi-standard solution containing 10 mg/L of each pesticide was prepared in acetonitrile, and stored at −20 °C. To avoid the degradation of the analytes, various concentrations of standard
working solutions need to be prepared daily by appropriately diluting the stock multi-standard solutions in blank matrix extracts or acetoni-trile. All solutions need to be filtered through a 0.22 μm membrane prior to analysis.
2.4. Sample preparation
2.4.1. Extraction method optimization
Extraction method optimization involved the optimized volume of the water, the extraction solvent, acid concentrations, and ultrasonic extraction time. We designed 25 sets of experiments, listed in Table S2. Homogenized samples (2.00 g) were placed into 50 mL centrifuge tubes and certain amounts of 10 mg/kg pesticide mixed standard solutions added to achieve a final concentration of 100 μg/kg, and then mixed with A mL water. In addition, C mL acetonitrile containing B% acetic acid was added to the mixture, and then extracted ultrasonically for D min at room temperature. The sample was centrifuged at 8195 g for 5 min. Finally, the supernatant was filtered through a 0.22 μm nylon organic membrane and transferred to the injection vial prior to the UHPLC-MS/MS analysis. The proportion of pesticides with a recovery rate between 70% and 120% among 108 pesticides under different extraction conditions was calculated. In addition, the average recovery rates and their Relative Standard Deviations (RSDs) were determined during analyses. The preferred recovery rate is one close to 100% with an RSD < 20%.
2.4.2. Clean up method optimization
This procedure consisted mainly of sorbent type and amount opti-mization. First, the pesticide recoveries of the sorbent used alone were investigated, and then the effect of the combined application of dif-ferent sorbent dosages was examined (16 sets of experiments, listed in Table S3). Finally, the results of the optimal combinations were com-pared with those of commercially available products. The exact pro-cedure was as follows: after extraction, 1.0 mL of the upper organic layer was introduced into a new Teflon centrifuge tube containing different dosages of sorbent. They were mixed and then vortexed for 1 min, then centrifuged at 16,725 g for 5 min. Finally, the supernatant was filtered through a 0.22 μm nylon organic membrane and trans-ferred into an injection vial prior to the UHPLC-MS/MS analysis. The proportions of pesticides with recovery rates in the 70–120% range among 108 pesticides under different clean up conditions, average re-covery rates and RSD, were determined.
2.4.3. Optimized sample preparation
Homogenized samples (2.00 g) were placed into 50 mL centrifuge tubes and mixed with 10 mL water. In addition, 6 mL acetonitrile containing 0.75% acetic acid was added to the mixture, and ultra-sonically extracted for 15 min at room temperature. The sample was centrifuged at 8195 g for 5 min. Thereafter, 1.0 mL of the upper organic layer was introduced into a new Teflon centrifuge tube containing 150 mg anhydrous MgSO4and 25 mg C18. Mixed them and vortexed
for 1 min, then centrifuged at 16,725 g for 5 min. Finally, the super-natant was filtered through a 0.22 μm nylon organic membrane and transferred to the injection vial prior to the UHPLC-MS/MS analyses. 2.5. Method validation
The method was validated with regard to linearity, sensitivity, precision (intra- and inter-day variability) and accuracy. The calibra-tion curves are linear equacalibra-tions of peak area in relacalibra-tion to solucalibra-tion concentration. Each calibration curve was plotted with at least five appropriate concentrations (generally 0.05–0.2 mg/L, for pesticides with LOQ > 0.05 mg/L, the concentration levels are LOQ-0.2 mg/L) in triplicates. The limits of determination (LODs) and the LOQs for each target pesticides were determined at the minimum detection levels with signal-to-noise ratios (S/N) of approximately 3 and 10, respectively.
Precision was assessed by replicating the analyses (n = 6) of standard samples within a day (intra-day variation) and in three consecutive days (inter-day variation). The accuracy of the method was determined by adding the target pesticides at four different concentrations (10 μg/ L, 50 μg/L 100 μg/L, and 200 μg/L) to the sample that were previously analyzed. The repeatability of the method was determined by analyzing the six independently prepared solutions of sample that spiked the same concentration of standard solvent. Stability was evaluated by repeat analyses of the same spiked sample solutions at 0 h, 3 h, 6 h, 12 h, 18 h and 24 h at room temperature. The formula for calculating the average recovery rates was: recovery (%) = (amount detected/amount added) × 100%.
2.6. Matrix effect
To assess the matrix effect (ME), serial concentrations (5 ng/mL, 20 ng/mL, 50 ng/mL, 100 ng/mL, and 200 ng/mL) of standards which were prepared in three types of blank matrix extract (O. japonicus, P. ordoratum and Cortex Moutan) and in solvent, respectively. The ME was calculated using the following equation: ME (%) = kmatrix/
ksolvent × 100, kmatrixis the slope of the matrix-matched calibration
curve and ksolventis the solvent-only calibration curve. In general, if the
ME (%) is between 80% and 120%, we can ignore the ME, a value greater than 120% is considered a signal enhancement, while a value < 80% is considered signal suppression. Data processing was performed using Excel (Microsoft Corp., Redmond, WA, USA) (2016) and Origin v8.5 (OriginLab Corp., Northampton, MA, USA).
3. Results and discussion
3.1. Extraction method optimization
Previously, the QuEChERS method was used to extract pesticides in fruits and vegetables [12]. Now, QuEChERS method is used widely because it can achieve a quick and effective extraction, this method enables introduction of various modifications at almost each step of analysis[37].
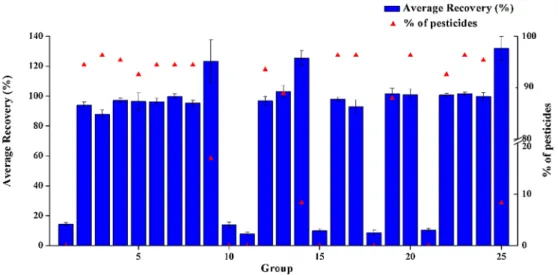
To detect pesticide residues in TCMs, improved extraction methods are required for superior analysis results for the target analytes. Most commercial TCMs have a moisture content < 10%. The QuEChERS method requires the sample to have a certain level of moisture; there-fore, it cannot be applied directly, and some water has to be added to a sample to make pores in the sample accessible during extraction [30,38]. We investigated the effects of adding different volumes of water (0 mL, 5 mL, and 10 mL) on extraction efficiency. We did not use methanol as the extraction solvent considering its high polarity, which may inhibit the complete extraction of non-polar or mid polar pesti-cides. In addition, extraction with methanol would extract high amounts of sugars and make the extraction solution dark and sticky [39]. Hence, in this study we selected acetonitrile as the extraction solvent. In the multi-residue analyses, the use of acid may influence the efficiency of the extraction and the stability of some pesticides; it can improve the extraction efficiency of pesticides, especially plant growth regulators[40]. Therefore, this study investigated the volume of acetic acid (0%, 0.75%, 1.5%) added to acetonitrile while investigating the addition volume of acetonitrile (2 mL, 6 mL, 10 mL). For the ultra-sonication process, the most important factor is extraction time; therefore, the effect of ultrasonication time on the analyte extraction between 5 and 15 min was investigated. The results have been pre-sented inFig. 2. Under the experimental conditions of groups 3, 16, 17, 20 and 23, approximately 96% of the pesticide recovery rate was 70–120%; however, under the group 23 condition, the recovery rate was closer to 100% and the RSD was lower than those of the others. Consequently, we selected 10 mL water and 6 mL acetonitrile (con-taining 0.75% formic acid) with 15 min ultrasonic treatment as the extraction procedure. Approximately 96% of the pesticide recoveries
were in the 70–120% range, with RSD < 20%, and the average re-covery rates under such a condition was 101.59%, RSD was 0.9%. 3.2. Clean up method optimization
Owing to the presence of high concentrations of numerous natural molecules and redox-active secondary metabolites or antioxidants (as-corbic acid, carotenoids, flavonoids, polyphenols, glutathione, toco-pherols, tocotrienols and enzymes) and also a polar molecules of es-sential oils such as monoterpenes and sesquiterpenes [41], the extractions and analyses could be hindered, leading to low pesticide recoveries due to either interference or ion suppression. The d-SPE, a key clean-up step, is often used to eliminate the matrix interference.
GCB has a good adsorption effect on color impurities which makes it
a frequently used carbon material[15,20]. However, according to the results inFig. 3A, only 68% and 71% of the pesticides were qualified (average recovery was 86.01% with an RSD of 1.56%, average recovery of 83.22% with an RSD of 3.62%, respectively) after using 25 mg and 50 mg GCB purification. The proportion of the qualified pesticides was much lower than those under the use of other purification sorbents, which could be because the GCB provides a six-membered ring plane. Therefore, using considerable amounts of GCB could retain some tar-geted planar compounds such as ametryn and abamectin[42]; when using 25 mg and 50 mg GCB, the recoveries of these two pesticides were 68.40% and 46.88%, 27.38% and 23.36%, respectively. However, when using other purifiers, the recovery rates could satisfy the re-quirements. FromFig. 3A, we can infer if Al2O3is used, although the
overall recovery is good, the recovery of the most commonly applied
Fig. 2. Effect of different extraction conditions on the recoveries and proportions of qualified pesticides of target compounds.
Fig. 3. Proportions of qualified pesticides and average recovery after using different sorbents to purify (A), different combinations of sorbents to purify (B), and
pesticides in O. japonicus, such as paclobutrazol, is too high (about 125%) and could not satisfy the requirements. Therefore, in the sub-sequent optimization process, these two sorbents were not considered. MWCNT is a novel nanomaterial, with a large surface area and high adsorption capacity, and could be used to eliminate the interferences associated with pigments in fruits and vegetables[43,44], and in other complex matrices such as tea[45]. In addition, it has been reported that MWCNT could enrich pesticides [46]. So this study investigated MWCNTs with three different particle sizes (< 8 nm, 10–20 nm and 20–30 nm), and observed that the purification effect increased with an increase in particle size, with the proportions of qualified pesticides being 83%, 93%, and 94%, respectively, which suggest that small-sized nano-materials can adsorb target pesticides more easily. Although the proportions obtained using 10–20 nm and 20–30 nm MWCNT were similar, the average recovery of the latter (97.23%) was closer to 100% than the former (106%); therefore, we selected 20–30 nm MWCNT. When MWCNT is used as a sorbent, it influences the recovery rate of carbendazim, chlorbenzuron, epoxiconazole, methamidophos, and thiabendazole, and their recoveries were 68%, 59%, 139%, 66%, and 26%, respectively, based on 20–30 nm MWCNT. In addition, PSA and C18 had good results, with about 95% and 96% of the pesticides in a good recovery, respectively. Therefore, we focused on PSA, C18 and MWCNT with a particle size of 20–30 µm. Using these three purifiers, both the proportions of the qualified pesticides and the average re-covery were good.
We observed that the recovery after the combination of the purifiers was significantly lower than when they were used individually (Fig. 3B). The highest proportion of qualified pesticides was observed when using C18 (96% for using 25 mg and 50 mg C18), followed by MWCNT (94%) and PSA (94%). PSA is a weak anion exchanger, and it is reported to have significant retaining activity for organic acids, fatty acids, sugars, and pigments; however, its pair acidity has an adsorption effect on some acidic substances [21]. Therefore, poor recoveries of plant growth regulators such as 2,4-D (12.12%), gibberellin (25.98%), indole acetic acid (56.91%) were obtained. Comparing the recovery of different amounts of C18, we find that the recoveries of the whole pesticides were not considerably different (both were 96%); however, when 50 mg C18 was used, the recovery of paclobutrazol (71.37%) met the requirements but was much lower than that obtained following the use of 25 mg C18 (100.15%). Therefore, we finally opted to use a combination of 25 mg C18 and 150 mg anhydrous MgSO4.
Because there are already many purifying agents for TCMs and some complex matrices, this study compared the average recoveries of the commercially available purifiers with the sorbents selected in the pre-sent study (Fig. 3C) and observed that the proportions of qualified pesticides of 150 mg anhydrous MgSO4 combined with 25 mg C18
(96%) was superior to those of other purifying agents (83% for m-PFC of simple matrix; 92% for m-PFC of high fat matrix; 79% for TPH; 90% for TPT).
3.3. Matrix effect
When using LC-MS/MS as the detection instrument, the potential for the ME to occur should be assessed, because the co-eluted substances could be protonated easily in competition with analytes in the ESI source. They may cause some quantitation challenges owing to signal enhancement or suppression, which would be a major drawback for LC-ESI-MS/MS. In this paper, the ME may cause inhibition or enhancement of ionization, which could lead to quantification errors. Therefore, The MEs for all the target pesticides in the three TCMs are illustrated in Fig. 4, where the MEs of most of the target pesticides were in the 80–120% range, and it is noticeable that 13 and 21 pesticides showed different degrees of signal enhancement or signal suppression in P. odoratum and O. japonicus, respectively. In Cortex Moutan, the matrix effect was more evident, which could be because of the presence of high concentrations of numerous natural molecules such as paeonol and
paeoniflorin which may cause interferences or ion suppression [47]. Approximately 42 pesticides (39%) exhibited different degrees of signal enhancement or suppression, which means that during the HPLC-MS/ MS analysis, some specific ingredients in the TCMs could have caused the ME. In addition, for pesticides with a strong ME, the scatter graph showed that pesticides with shorter RTs are more likely to cause signal suppression, while pesticides with longer RTs are more likely to lead to matrix enhancement effects.
To obtain accurate quantitative results, the most effective way of correcting errors caused by ME is calibration using the standard addi-tion method, which is referred to as matrix-matched calibraaddi-tion. In this study, we used this method to compensate for the ME and, in turn, achieve accurate quantification of pesticide residues. Subsequent method validation results also showed that UHPLC-MS/MS could be used to analyze pesticide residues in TCM samples prepared using the QuEChERS method.
3.4. Method validation
The LODs and LOQs are listed inTables 1, S7 and S8. The method proposed above exhibited high sensitivity, with the LOQs ranging from 0.01 to 20 ng/mL in Cortex Moutan and 0.01–50 ng/mL range in the other TCMS, which is lower than the MRL value for agricultural pro-ducts specified in the national standard. In all three TCMs, r2s of the
calibration curves for all analytes were higher than 0.9901 which showed good linearity. The measurement of intra- and inter-day variability was used to determine the precision of the developed method. In O. japonicus, the precisions (based on RSD values) were in 1.08–11.91% (intra-day) and 1.32–16.16% (inter-day) ranges with 0.53–15.05% (intra-day) and 0.15–26.56% (inter-day) for P. odoratum and 0.46–19.07% (intra-day) and 0.25–18.86% (inter-day) for Cortex Moutan, indicating that the proposed method is highly sensitive and meets the regulatory requirements. The repeatability of the method for O. japonicus, P. odoratum and Cortex Moutan for the 108 pesticides was not more than 11% and the stabilities were in the 1.99–16.95%, 1.36–25.09% and 1.99–16.95% ranges, respectively. In O. japonicus, except for cyromazine, tetramethirn, phorate sulfoxide, methiocarb, chlorbenzuron, diflubenzuron, fenamiphos, hexaflumuron, IBA, pho-rate sulfone, sulfotep and epoxiconazole, the recoveries of the other pesticides (89%) were in the 70.30–119.96% range, with RSD < 19%. In P. odoratum, excluding cyromazine, GA3, IAA, IBA and malathion, the recoveries of the other pesticides (96%) were in the 63.89–119.70% range, with RSD < 18%. In Cortex Moutan, excluding cyromazine, thiabendazole, phorate sulfoxide, methiocarb, diflubenzuron, IBA, chlorpyrifos methamidophos, phorate, pendimethalin, triazophos, bi-tertanol, 6-BA and diazinon, the recoveries of the other pesticides (87%) were in the 71.48–119.08% range with RSD < 19%. The results confirmed that the method was accurate.
3.5. Application to real samples
The modified method was applied for the analysis of 39 samples including O. japonicus (n = 12), P. odoratum (n = 14) and Cortex Moutan (n = 13) collected from different regions in China. In different samples, Tables S4–S6 show that pesticides are widely applied in TCM cultivation activities to increase yield. In this study, totally 26 pesti-cides were detected in the three TCMs, and only 7.69% samples did not detect any pesticides, while more than four pesticides were detected in 1/3rd of the samples (Fig. 5A).
The detection of some pesticides was not necessarily due to the application of pesticides. TCM contamination could be caused by the pesticide residues in the soil or the migration of pesticides sprayed on other crops. Among the 26 detected pesticides, more than a half of the pesticides were insecticides and the proportion of fungicides was also large (34.62%) (Fig. 5B). The three pesticides with relatively high de-tection rates (Fig. 5C) were Tebuconazol (69.23%), Triadimefon
(33.33%) and Paclobutrazol (30.77%). Tebuconazol had a high detec-tion rate in all three TCMs while Triadimefon and Paclobutrazol were only detected in Cortex Moutan and O. japonicus, respectively. Although they had high detection rates, their residual amounts were very low and other detected pesticides had low concentrations, excluding Paclobu-trazol (Fig. 5D). Paclobutrazol was detected in all O. japonicus samples at concentrations ranging from 4.18 μg/kg to 783.73 μg/kg. According to the GB 2763-2019 national standard [9], the paclobutrazol con-centrations in most samples exceeded the MRLs set for vegetables (0.05 mg/kg). However, the MRLs of the pesticides in TCMs are not specified in the national standard. The results mentioned above are consistent with the findings of our previous field survey and monitoring data reported by Zhao et al.[48], which indicate that paclobutrazol is a plant growth retardant commonly used in O. japonicus production. Besides that, a high frequency Pyraclostrobin detection (10 of the 13 samples in O. japonicus) was observed and the concentrations in one sample (21.24 µg/kg) exceeded the MRLs set for vegetables (0.02 mg/ kg) according to the GB 2763-2019 standards[9].
Residual concentrations caused by the unsustainable application of pesticides will not only adversely affect the safety of TCMs, but also pollute the environment and affect the growth of subsequent crops planted. Therefore, the establishment of application standards and MRLs for TCMs should be considered in future studies.
4. Conclusion
In this study, a rapid, simple, robust and high throughput method was applied for the determination of 108 pesticide residues in three widely used TCMs, O. japonicus, P. odoratum and Cortex Moutan. This modified QuEChERS method coupled with UHPLC-MS/MS was applic-able to all the three selected TCMs and resulted in excellent selectivity, precision (intra-day and inter-day variability) and repeatability. The method worked in the dMRM mode coupled with an ESI source fa-cilitated the simultaneous quantification of 108 pesticides from the different TCMs with complex compositions within 21 min. After
method optimization, we concluded that extraction conducted in acetonitrile containing 0.75% (v/v) acetic acid with ultrasonication for 15 min and d-SPE clean-up with 150 mg anhydrous MgSO4in
combi-nation with 25 mg C18 achieved satisfactory recoveries. A compre-hensive verification of the method was carried out to demonstrate its high sensitivity, specificity and accuracy. The detection frequencies of paclobutrazol, tebuconazole, etc., which pose very serious environ-mental risks, were high, which indicated that they need to be managed, for example, through the reassessment of their use and the definition of their MRLs in China. Considering the advantages of simple pretreat-ment requirepretreat-ments and high-throughput, the modified method devel-oped in the present study may be applied in the detection of pesticide residues or other contaminants in similar TCMs.
Funding
This study was supported by the National Natural Science Foundation of China (31671942 and 31872006), China Agriculture Research System (CARS-21) and Key Project at Central Government Level: The ability establishment of sustainable use for valuable Chinese medicine resources (2060302).
CRediT authorship contribution statement
Rui-Xing Li: Methodology, Software, Validation, Formal analysis,
Investigation, Data curation, Writing - original draft, Visualization.
Min-Min Li: Methodology, Software, Validation, Formal analysis,
Investigation, Data curation, Writing - original draft, Visualization. Tao
Wang: Methodology, Validation, Investigation, Resources, Visualization. Tie-Lin Wang: Software, Formal analysis, Data curation.
Jie-Yin Chen: Software, Formal analysis, Resources. Frédéric Francis:
Methodology, Validation, Writing - review & editing. Bei Fan: Conceptualization, Formal analysis, Resources, Writing - review & editing, Project administration, Funding acquisition. Zhi-Qiang Kong: Conceptualization, Software, Validation, Resources, Writing - review &
Table 1
Linear ranges, calibration curves, correlation coefficients (r2), limits of quantification (LOQs), matrix effects and recoveries of 108 target pesticides in Ophiopogon
japonicas.
No. Pesticide LOQ (μg kg−1) LOD (μg kg−1) ME (%) Recoveries (%) (RSDs) (n = 6) Precision (%) (RSDs) 0.01 (mg kg−1) 0.05 (mg kg−1) 0.1 (mg kg−1) 0.2 (mg kg−1) Intra-day Inter-day 1 2,4-D 5 2 115.82 99.57 (8.14) 102.13 (5.04) 101.68 (3.88) 93.73 (3.71) 5.05 5.09 2 3-Hydroxycarbofuran 0.05 0.02 85.49 101.33 (7.46) 111.88 (3.38) 105.09 (1.75) 110.47 (2.66) 3.05 3.67 3 6-BA 0.25 0.1 56.60 85.00 (6.49) 89.08 (5.38) 85.64 (3.17) 86.85 (2.02) 2.58 2.27 4 Abamectin 1 0.3 274.05 106.40 (8.27) 103.61 (5.58) 114.36 (1.92) 109.49 (4.09) 11.91 8.90 5 Acephate 10 3 71.29 78.90 (7.70) 92.09 (3.97) 85.53 (1.51) 85.74 (2.75) 1.14 2.90 6 Acetamiprid 0.01 0.005 80.41 114.38 (5.43) 115.49 (2.13) 115.45 (3.02) 120.82 (1.80) 2.46 2.86 7 Aldicarb 5 2 69.03 95.17 (9.89) 102.92 (4.40) 98.94 (3.13) 105.39 (2.12) 1.86 2.24 8 Aldicarb sulfone 0.5 0.15 88.08 103.85 (7.25) 108.87 (4.57) 101.81 (2.25) 108.32 (1.23) 2.15 2.70 9 Aldicarb sulfoxide 0.5 0.15 100.02 90.22 (9.52) 103.90 (3.52) 96.53 (1.89) 100.00 (2.37) 1.96 2.08 10 Ametryn 0.05 0.02 100.07 102.70 (6.05) 109.16 (3.66) 99.73 (2.47) 97.77 (2.62) 3.16 4.09 11 Azoxystrobin 0.25 0.1 92.70 102.63 (6.30) 109.44 (3.75) 108.06 (3.82) 114.36 (2.66) 5.92 5.95 12 Benalaxyl 1 0.3 70.59 98.41 (10.72) 114.64 (4.18) 110.81 (4.90) 117.52 (2.74) 6.46 8.29 13 Benoxacor 0.5 0.15 89.50 102.60 (6.05) 108.50 (3.34) 99.09 (1.52) 106.53 (1.30) 2.88 2.53 14 Bitertanol 5 2 82.94 115.27 (13.17) 108.65 (3.42) 102.84 (6.96) 101.89 (10.85) 4.73 5.76 15 Buprofezin 0.01 0.005 84.11 101.90 (4.86) 102.24 (3.48) 96.67 (1.26) 103.63 (2.01) 5.80 5.60 16 Cadusafos 0.05 0.02 86.05 100.64 (8.38) 107.30 (3.64) 101.50 (4.78) 104.75 (2.17) 2.96 2.22 17 Carbaryl 0.25 0.1 78.94 102.28 (5.75) 113.35 (3.30) 102.00 (2.12) 114.23 (1.03) 2.56 2.21 18 Carbendazim 5 2 89.07 111.05 (8.64) 102.56 (3.52) 100.64 (1.97) 97.87 (0.88) 2.44 2.94 19 Carbofuran 0.01 0.005 80.92 103.28 (6.01) 110.62 (3.68) 100.88 (2.09) 106.47 (0.93) 3.44 3.75 20 Chlorbenzuron 5 2 112.93 101.04 (7.78) 120.36 (5.03) 115.86 (7.35) 128.80 (4.15) 8.92 6.59 21 Chlordimeform 5 2 96.49 99.56 (6.86) 102.08 (3.76) 97.14 (0.95) 104.29 (1.35) 2.43 3.22 22 Chlorfluazuron 0.25 0.1 121.67 109.08 (18.33) 104.08 (3.51) 99.75 (2.84) 114.26 (4.64) 7.08 5.03 23 Chlorpyrifos 10 3 86.92 117.08 (8.56) 115.53 (4.07) 99.82 (2.04) 105.54 (2.26) 4.29 3.60 24 Chlorpyrifos-methyl 20 6 99.64 – 113.78 (8.43) 103.82 (4.92) 106.92 (10.58) 5.29 4.92 25 Coumaphos 0.5 0.15 87.59 100.16 (6.08) 119.50 (4.70) 117.81 (4.72) 121.72 (2.98) 4.96 4.98 26 Cyprodinil 0.25 0.1 90.09 99.33 (4.10) 102.56 (3.23) 102.87 (1.57) 102.55 (3.27) 2.73 2.66 27 Cyromazine 5 2 19.63 31.96 (17.60) 24.47 (5.73) 27.68 (9.09) 28.81 (5.46) 1.08 14.64 28 Diazinon 0.05 0.02 87.36 96.03 (9.93) 112.00 (3.59) 94.54 (4.44) 106.21 (5.75) 3.43 4.22 29 Dichlorvos 5 2 81.35 101.08 (6.39) 103.11 (2.84) 98.02 (1.76) 104.82 (1.83) 1.75 1.60 30 Diclofop-methyl 5 2 90.78 102.54 (9.20) 109.15 (3.24) 101.61 (1.24) 104.02 (3.32) 6.01 4.86 31 Difenoconazole 1 0.3 74.49 110.41 (7.33) 100.82 (20.62) 101.65 (3.80) 106.72 (2.67) 5.44 4.56 32 Diflubenzuron 0.25 0.1 86.77 110.41 (7.33) 149.03 (4.84) 110.71 (4.70) 126.40 (3.43) 4.80 4.00 33 Dimethenamid 0.25 0.1 95.47 97.81 (5.79) 111.39 (3.55) 105.44 (2.69) 110.81 (1.43) 2.99 3.73 34 Dimethoate 0.05 0.02 77.07 99.91 (4.61) 109.22 (4.24) 98.72 (3.31) 108.47 (0.61) 2.32 1.93 35 Dimethomorph 0.25 0.1 86.56 98.05 (4.83) 113.54 (4.63) 102.58 (3.02) 103.39 (2.59) 6.01 5.51 36 Diniconazol 10 3 97.21 103.72 (7.20) 108.92 (2.91) 103.23 (2.20) 101.36 (5.07) 3.91 3.66 37 Diphenylamine 50 15 90.31 – 104.56 (3.35) 101.37 (3.15) 117.79 (2.88) 3.53 4.01 38 Emamectin-benzoate 0.05 0.02 94.86 98.02 (6.77) 102.26 (2.50) 91.35 (3.14) 102.88 (1.24) 7.67 7.29 39 Epoxiconazole 1 0.3 86.92 125.03 (4.13) 167.11 (5.59) 121.13 (4.85) 125.42 (1.93) 6.39 6.54 40 Ethoprophos 0.1 0.03 90.12 97.96 (7.67) 106.56 (6.50) 94.13 (3.16) 104.64 (4.48) 2.68 3.10 41 Etofenprox 0.25 0.1 81.99 98.95 (2.50) 104.68 (4.16) 99.31 (1.74) 106.33 (1.85) 8.63 4.99 42 Fenamiphos 0.05 0.02 69.92 106.82 (2.26) 171.73 (3.37) 105.21 (5.46) 115.04 (1.55) 5.24 3.74 43 Fenarimol 5 2 101.96 113.29 (11.30) 112.49 (2.36) 103.52 (2.02) 114.49 (2.41) 5.69 6.72 44 Fenbuconazole 5 2 69.25 112.72 (4.25) 117.05 (6.16) 99.54 (3.58) 105.80 (9.52) 9.17 8.37 45 Fenitrothion 5 2 90.07 99.90 (6.41) 109.86 (4.17) 106.78 (1.98) 112.35 (2.28) 2.31 2.24 46 Fenobucarb 0.01 0.005 86.37 100.43 (6.73) 112.74 (5.33) 101.34 (1.14) 105.37 (2.25) 3.06 2.98 47 Fenpropathrin 5 2 83.02 105.44 (4.12) 119.59 (4.98) 96.02 (2.05) 100.56 (2.80) 4.25 3.20 48 Fenpyroximate 0.1 0.03 96.87 102.71 (7.79) 105.44 (4.12) 105.21 (3.47) 104.67 (2.19) 6.70 4.95 49 Fenthion 5 2 88.41 95.35 (10.72) 103.71 (6.37) 90.59 (3.69) 106.94 (3.23) 2.14 4.49 50 Fipronil 0.1 0.03 97.35 95.94 (3.03) 115.63 (3.56) 103.36 (2.96) 119.96 (2.95) 3.53 4.81 51 Fipronil sulfide 0.1 0.03 93.07 103.01 (6.43) 115.26 (3.79) 103.75 (2.34) 107.74 (6.08) 4.83 6.73 52 Fipronil-desulnyl 0.1 0.03 87.53 104.30 (7.02) 106.54 (5.36) 96.61 (3.41) 98.86 (1.82) 5.18 7.49 53 Fipronil-sulfone 0.01 0.005 95.47 95.33 (8.03) 113.45 (3.41) 112.63 (2.67) 109.60 (2.51) 5.19 6.89 54 Flufenoxuron 1 0.3 100.57 116.17 (10.70) 103.56 (4.91) 85.54 (2.04) 99.54 (5.55) 7.27 5.99 55 Fluometuron 0.1 0.03 85.13 98.64 (7.83) 106.17 (2.81) 105.24 (2.10) 107.59 (2.47) 3.52 3.55 56 Flusilazole 1 0.3 81.26 106.39 (9.70) 132.71 (4.92) 101.16 (2.70) 107.40 (2.35) 5.66 5.45 57 GA3 10 3 98.50 94.12 (17.47) 105.18 (8.26) 105.55 (5.99) 95.47 (3.39) 6.62 8.51 58 Hexaconazole 0.5 0.15 92.59 101.55 (8.38) 113.69 (6.13) 98.32 (2.23) 114.90 (2.46) 4.90 5.97 59 Hexaflumuron 10 3 93.74 126.23 (18.77) 132.11 (11.39) 112.97 (3.05) 108.08 (9.44) 3.75 15.28 60 Hexythiazox 0.25 0.1 76.92 104.77 (5.92) 105.77 (5.40) 102.08 (4.15) 108.10 (2.40) 6.91 4.82 61 IAA 5 2 82.70 119.02 (4.90) 114.76 (3.35) 107.73 (1.62) 107.14 (2.30) 3.22 3.37 62 IBA 10 3 100.00 113.44 (21.41) 109.44 (31.41) 107.65 (9.31) 111.99 (11.93) 4.46 5.06 63 Imidacloprid 0.1 0.03 82.33 108.92 (6.73) 115.93 (3.47) 103.18 (1.77) 116.09 (1.76) 2.52 2.22 64 Isazophos 0.05 0.02 90.12 105.51 (6.97) 111.52 (2.15) 90.86 (3.53) 111.17 (4.60) 7.43 8.50 65 Isofenphos 0.1 0.03 92.26 105.54 (5.11) 112.73 (6.50) 109.63 (3.76) 108.93 (5.16) 3.12 2.22 66 Iso-malathion 0.05 0.02 92.97 102.88 (5.62) 112.88 (3.55) 104.52 (3.56) 116.77 (2.41) 4.19 2.81 67 Isoprocarb 0.01 0.005 82.13 106.55 (6.44) 110.55 (3.73) 103.96 (2.92) 109.34 (1.34) 3.31 3.98 68 Isoprothiolane 0.25 0.1 85.85 104.28 (5.89) 107.47 (3,45) 102.69 (2.53) 115.28 (2.82) 2.89 3.54 69 Malaoxon 0.05 0.02 77.51 105.65 (6.55) 113.52 (3.80) 98.55 (1.79) 111.79 (2.58) 5.18 5.85 70 Malathion 0.01 0.005 89.66 107.57 (5.71) 110.80 (5.04) 117.56 (5.11) 114.13 (3.15) 7.77 16.16 71 Metalaxyl 0.01 0.005 92.09 103.21 (5.90) 113.10 (5.30) 102.58 (2.97) 106.62 (2.91) 2.54 2.69
editing, Project administration, Funding acquisition. Xiao-Feng Dai: Conceptualization, Validation, Writing - review & editing, Supervision, Project administration, Funding acquisition.
Declaration of Competing Interest
The authors declare that they have no known competing financial interests or personal relationships that could have appeared to influ-ence the work reported in this paper.
87 Phosmet 0.25 0.1 89.30 103.42 (6.08) 106.76 (4.53) 104.75 (1.93) 105.84 (1.53) 4.76 4.64 88 Phoxim 0.01 0.005 80.27 99.77 (7.16) 105.52 (7.80) 103.69 (5.77) 108.95 (3.01) 3.71 6.55 89 Pirimicarb 0.05 0.02 83.65 101.70 (6.26) 107.37 (3.95) 98.39 (2.95) 103.21 (2.53) 2.55 2.51 90 Prochloraz 5 2 91.55 106.58 (9.68) 102.93 (3.70) 99.39 (2.93) 107.39 (2.70) 5.78 5.02 91 Profenofos 0.01 0.005 87.27 108.04 (11.35) 105.87 (4.99) 98.78 (2.85) 108.18 (2.97) 5.06 3.98 92 Prometryne 0.01 0.003 94.77 99.02 (7.34) 103.45 (5.20) 101.90 (3.57) 105.20 (3.04) 2.18 2.07 93 Propargite 0.5 0.15 79.08 101.39 (8.24) 108.39 (3.66) 90.34 (1.40) 105.51 (2.18) 8.03 5.56 94 Pyraclostrobin 0.25 0.1 92.19 102.98 (7.76) 114.98 (6.62) 93.15 (4.47) 115.02 (3.98) 6.41 5.54 95 Pyridaben 0.05 0.02 96.32 98.79 (6.53) 107.21 (3.48) 98.49 (2.31) 106.51 (2.5) 7.98 5.06 96 Pyrimethanil 0.05 0.02 91.36 102.08 (5.11) 106.29 (2.38) 98.98 (2.10) 105.33 (1.97) 3.02 2.82 97 Quinalphos 0.5 0.15 80.53 104.70 (8.65) 134.70 (3.31) 105.13 (5.64) 111.99 (5.62) 4.17 3.79 98 Sulfotep 0.1 0.03 88.24 99.12 (6.84) 103.06 (6.99) 128.47 (9.91) 108.08 (4.06) 3.81 4.18 99 Tau fluvalinate 0.5 0.15 104.00 105.48 (6.65) 110.39 (4.35) 98.87 (3.40) 106.30 (3.10) 7.52 5.27 100 Tebuconazol 1 0.3 86.93 96.28 (6.87) 109.39 (5.45) 100.27 (4.46) 111.40 (4.35) 5.25 5.39 101 Terbufos 5 2 86.47 109.07 (13.75) 108.33 (3.91) 91.59 (2.40) 105.70 (2.62) 3.83 2.77 102 Tetramethirn 0.5 0.15 94.71 106.93 (12.86) 118.93 (3.73) 122.10 (3.63) 121.63 (2.88) 3.63 3.01 103 Thiabendazole 1 0.3 89.64 90.56 (5.66) 96.83 (3.88) 89.23 (1.33) 96.84 (2.41) 3.48 4.66 104 Thiamethoxam 0.01 0.005 79.06 102.68 (6.87) 109.07 (3.05) 102.84 (1.42) 110.93 (2.56) 3.26 3.70 105 Triadimefon 5 2 94.40 108.30 (8.22) 110.24 (6.09) 100.38 (3.99) 113.73 (2.02) 6.15 6.28 106 Triadimenol 5 2 99.51 102.93 (9.38) 109.97 (4.10) 113.71 (2.70) 109.52 (3.03) 7.64 8.65 107 Triazophos 0.25 0.1 70.00 103.33 (8.58) 108.53 (3.61) 99.64 (4.48) 102.74 (3.81) 4.45 4.23 108 Zoxamide 0.25 0.1 89.70 107.04 (5.26) 113.37 (3.62) 105.73 (3.79) 119.29 (2.98) 4.09 4.23
Fig. 5. Proportions of pesticide residues in real samples (A), proportions of detected pesticide types (B), three pesticides with relatively high detection rates in three
Appendix A. Supplementary material
Supplementary data to this article can be found online athttps:// doi.org/10.1016/j.jchromb.2020.122224.
References
[1] Chinese Pharmacopeia Commission, Pharmacopoeia of People's Republic of China. Chemical Medical Science Press, 2015.
[2] Y.F. Zhou, L.L. Wang, L.C. Chen, T.B. Liu, R.Y. Sha, J.W. Mao, Enrichment and separation of steroidal saponins from the fibrous roots of Ophiopogon japonicus using macroporous adsorption resins, RSC Adv. 9 (2019) 6689–6698,https://doi. org/10.1039/C8RA09319A.
[3] S.B. Zhang, H.Y. Sun, C.Y. Wang, X.M. Zheng, X.H. Jia, E.B. Cai, Y. Zhao, Comparative analysis of active ingredients and effects of the combination of Panax ginseng and Ophiopogon japonicus at different proportions on chemotherapy-in-duced myelosuppression mouse, Food Funct. 10 (2019) 1563–1570,https://doi. org/10.1039/c8fo02354a.
[4] N.S. Shaban, K.A. Abdou, N.E.-H.Y. Hassan, Impact of toxic heavy metals and pesticide residues in herbal products, Beni-Suef Univ. J. Basic Appl. Sci. 5 (2016) 102–106,https://doi.org/10.1016/j.bjbas.2015.10.001.
[5] V. Tripathy, B.B. Basak, T.S. Varghese, A. Saha, Residues and contaminants in medicinal herbs—a review, Phytochem. Lett. 14 (2015) 67–78,https://doi.org/10. 1016/j.phytol.2015.09.003.
[6] W.H.O. Who, Guidelines for Assessing Quality of Herbal Medicines with Reference to Contaminants and Residues, World Health Organization, 2007.
[7] The European Pharmacopoeia, 8 ed. (Ph. Eur. 8.0), European Directorate for the Quality of Medicines. Strasbourg, 2013.
[8] The United States Pharmacopeia and The National Formulary, 39th ed. (USP39-NF34). United States Pharmacopeial Convention, Rockville. 2016.
[9] GB 2763-2019. National food safety standard-maximum residue limits for pesticides in food. National Health and Family Planning Commission of the People's Republic of China and Ministry of Agriculture of the People's Republic of China, China, 2020. [10] Q.X. Lin, M. Li, H.Y. Zhou, C. Liu, M. Ren, C.Y. Zhao, Study of the influence of plant
growth regulators on Ophiopogon Japonicus’s total saponins and total poly-saccharide content, [in Chinese, English abstract], Mod. Chin. Med. 16 (2014) 399–409,https://doi.org/10.13313/j.issn.1673-4890.2014.05.013.
[11] F.M. Wu, R.S. Yang, L. Tao, M. Li, S.J. Gao, X.H. Bao, J. Zhou, Comprehensive evaluation of use of paclobutrazol in the cultivation of Ophiopogonis Radix based on safety and efficacy, Chin Pharmacol J. 52 (2017) 20–24,https://doi.org/10. 11669/cpj.2017.01.004[in Chinese, English abstract].
[12] M. Anastassiades, J. Lehotay, D. Štajnbaher, J. Schenck, Fast and easy multiresidue method employing acetonitrile extraction/partitioning and “dispersive solid-phase extraction” for the determination of pesticide residues in produce, J. AOAC Int. 86 (2003) 412–431,https://doi.org/10.1093/jaoac/86.2.412.
[13] R.H. Dai, X.D. Ren, X. He, Y.S. Huo, Convenient analytical method for quantitative determination of 23 pesticide residues in herbs by gas chromatography-mass spectrometry, Bull. Environ. Contam. Toxicol. 86 (2011) 559–564,https://doi.org/ 10.1007/s00128-011-0264-5.
[14] Xiao-qin Liu, Yun-fei Li, Wen-ting Meng, Dong-xiang Li, Henry Sun, Ling Tong, Guo-xiang Sun, A multi-residue method for simultaneous determination of 74 pesticides in Chinese material medica using modified QuEChERS sample preparation proce-dure and gas chromatography tandem mass spectrometry, J. Chromatogr. B 1015-1016 (2016) 1–12,https://doi.org/10.1016/j.jchromb.2016.01.029.
[15] Z.H. Zhang, M.F. Dong, X.H. Hao, L.J. Han, S.Y. Song, W. Yao, Evaluation of cleanup procedures in pesticide multi-residue analysis with QuEChERS in Cinnamon Bark, Food Chem. 276 (2019) 140–146,https://doi.org/10.1016/j. foodchem.2018.10.019.
[16] Y.G. Hou, H. Chen, X. Li, Y.Y. Liao, M. Tsunoda, Y.X. Zhang, S.M. Deng, Y.T. Song, A modified QuEChERS method for determination of pyrethroid residues in traditional Chinese medicine oral liquids by high-performance liquid chromatography, Molecules 24 (2019),https://doi.org/10.3390/molecules24081470.
[17] H. Ouyang, Q. Lu, W.W. Wang, Y. Song, X.M. Tu, C.Z. Zhu, N.S. Jordan, D. Du, Z.F. Fu, Y.H. Lin, Dual-readout immunochromatographic assay by utilizing MnO2 nanoflowers as the unique colorimetric/chemiluminescent probe, Anal. Chem. 90 (2018) 5147–5152,https://doi.org/10.1021/acs.analchem.7b05247.
[18] J.C. Wei, J. Hu, J.L. Cao, J.B. Wan, C.W. He, Y.J. Hu, H. Hu, P. Li, Sensitive de-tection of organophosphorus pesticides in medicinal plants using ultrasound-as-sisted dispersive liquid–liquid microextraction combined with sweeping micellar electrokinetic chromatography, J. Agric. Food Chem. 64 (2016) 932–940,https:// doi.org/10.1021/acs.jafc.5b05369.
[19] J. Liu, D.Q. Luo, B.J. Fan, R.X. Qiao, H.J. Liu, Quick easy cheap rugged safe and enzyme inhibition method for the determination of pesticide residues in 8 different parts of Chinese herbal medicines, [in Chinese, English abstract], Northwest Pharm. J. 32 (2017) 702–707,https://doi.org/10.3969/j.issn.1004-2407.2017.06.007. [20] H.M. Liu, W.J. Kong, Y. Qi, B. Gong, Q. Miao, J.H. Wei, M.H. Yang, Streamlined
pretreatment and GC-FPD analysis of multi-pesticide residues in perennial Morinda roots: a tropical or subtropical plant, Chemosphere 95 (2014) 33–40,https://doi. org/10.1016/j.chemosphere.2013.07.085.
[21] Y.H. Yang, W.J. Kong, L.H. Zhao, Q.X. Xiao, H.M. Liu, X.S. Zhao, M.H. Yang, A multiresidue method for simultaneous determination of 44 organophosphorous pesticides in Pogostemon cablin and related products using modified QuEChERS sample preparation procedure and GC–FPD, J. Chromatogr. B 974 (2015) 118–125, https://doi.org/10.1016/j.jchromb.2014.10.023.
[22] H.M. Liu, W.J. Kong, B. Gong, Q. Miao, Y. Qi, M.H. Yang, Rapid analysis of multi-pesticides in Morinda officinalis by GC–ECD with accelerated solvent extraction assisted matrix solid phase dispersion and positive confirmation by GC–MS, J. Chromatogr. B 974 (2015) 65–74,https://doi.org/10.1016/j.jchromb.2014.10.017. [23] R. Xu, J.W. Wu, Y.G. Liu, R.H. Zhao, B. Chen, M.H. Yang, J. Chen, Analysis of
pesticide residues using the Quick Easy Cheap Effective Rugged and Safe (QuEChERS) pesticide multiresidue method in traditional Chinese medicine by gas chromatography with electron capture detection, Chemosphere 84 (2011) 908–912, https://doi.org/10.1016/j.chemosphere.2011.06.013.
[24] E.R. Attallah, D.A. Barakat, G.R. Maatook, H.A. Badawy, Validation of a quick and easy (QuEChERS) method for the determination of pesticides residue in dried herbs, J. Food Agric. Environ. 10 (2012) 755–762,https://doi.org/10.1016/j.jcs.2011.10. 005.
[25] Y.C. Hu, L. Wan, J.M. Zhang, F. Yang, J.L. Cao, Rapid determination of pesticide residues in Chinese materia medica using QuEChERS sample preparation followed by gas chromatography–mass spectrometry, Acta Pharm. Sin. B 2 (2012) 286–293, https://doi.org/10.1016/j.apsb.2012.03.005.
[26] T.P. Ahammed Shabeer, Rushali Girame, Sagar Utture, Dasharath Oulkar, Kaushik Banerjee, D. Ajay, Ranjith Arimboor, K.R.K. Menon, Optimization of multi-residue method for targeted screening and quantitation of 243 pesticide multi-residues in cardamom (Elettaria cardamomum) by gas chromatography tandem mass spectro-metry (GC-MS/MS) analysis, Chemosphere 193 (2018) 447–453,https://doi.org/ 10.1016/j.chemosphere.2017.10.133.
[27] X.Y. Duan, L. Tong, D.X. Li, Z.G. Yu, Y.L. Zhao, A multiresidue method for si-multaneous determination of 116 pesticides in Notoginseng Radix et Rhizoma using modified QuEChERS coupled with gas chromatography tandem mass spectrometry and census 180 batches of sample from Yunnan province, Chromatographia 81 (2018) 545–556,https://doi.org/10.1007/s10337-017-3460-6.
[28] E. Rutkowska, B. Łozowicka, P. Kaczyński, Three approaches to minimize matrix effects in residue analysis of multiclass pesticides in dried complex matrices using gas chromatography tandem mass spectrometry, Food Chem. 279 (2019) 20–29, https://doi.org/10.1016/j.foodchem.2018.11.130.
[29] S. Li, P.P. Yu, C. Zhou, L. Tong, D.X. Li, Z.G. Yu, Y.L. Zhao, Analysis of pesticide residues in commercially available chenpi using a modified QuEChERS method and GC-MS/MS determination, J. Pharm. Anal. (2019),https://doi.org/10.1016/j.jpha. 2019.01.005.
[30] L.N. Chen, F.R. Song, Z.Q. Liu, Z. Zheng, J.P. Xing, S.Y. Liu, Multi-residue method for fast determination of pesticide residues in plants used in traditional Chinese medicine by ultra-high-performance liquid chromatography coupled to tandem mass spectrometry, J. Chromatogr. A 1225 (2012) 132–140,https://doi.org/10. 1016/j.chroma.2011.12.071.
[31] Jie Liu, Ling Tong, Dongxiang Li, Wenting Meng, Wanyang Sun, Yunli Zhao, Zhiguo Yu, Comparison of two extraction methods for the determination of 135 pesticides in Corydalis Rhizoma, Chuanxiong Rhizoma and Angelicae Sinensis Radix by liquid chromatography-triple quadrupole-mass spectrometry. Application to the roots and rhizomes of Chinese herbal medicines, J. Chromatogr. B 1017-1018 (2016) 233–240,https://doi.org/10.1016/j.jchromb.2016.03.003.
[32] D. Moreno-González, J. Huertas-Pérez, L. Gámiz-Gracia, A. García-Campaña, High-throughput methodology for the determination of 33 carbamates in herbal products by UHPLC–MS/MS, Food Anal. Method. 8 (2015) 2059–2068,https://doi.org/10. 1007/s12161-014-9998-0.
[33] E. Nantia, D. Moreno-González, F. Manfo, L. Gámiz-Gracia, A. García-Campaña, QuEChERS-based method for the determination of carbamate residues in aromatic herbs by UHPLC-MS/MS, Food Chem. 216 (2017) 334–341,https://doi.org/10. 1016/j.foodchem.2016.08.038.
[34] S.R. Cao, X. Zhou, X.L. Li, B.B. Tang, X.W. Ding, C.X. Xi, J.T. Hu, Z.Q. Chen, Determination of 17 plant growth regulator residues by ultra-high performance liquid chromatography-triple quadrupole linear ion trap mass spectrometry based on modified QuEChERS method, Food Anal. Method. 10 (2017) 3158–3165, https://doi.org/10.1007/s12161-017-0885-3.
[35] Y. Kuang, F. Qiu, W.J. Kong, J.Y. Luo, H.Y. Cheng, M.H. Yang, Simultaneous quantification of mycotoxins and pesticide residues in ginseng with one-step ex-traction using ultra-high performance liquid chromatography–electrospray ioniza-tion tandem mass spectrometry, J. Chromatogr. B 939 (2013) 98–107,https://doi. org/10.1016/j.jchromb.2013.09.013.
[36] X. Zhou, S.R. Cao, X.L. Li, B.B. Tang, X.W. Ding, C.X. Xi, J.T. Hu, Z.Q. Chen, Simultaneous determination of 18 preservative residues in vegetables by ultra high performance liquid chromatography coupled with triple quadrupole/linear ion trap mass spectrometry using a dispersive-SPE procedure, J. Chromatogr. B 989 (2015) 21–26,https://doi.org/10.1016/j.jchromb.2015.02.030.
[37] M. Gaweł, T. Kiljanek, A. Niewiadowska, S. Semeniuk, M. Goliszek, O. Burek, A. Posyniak, Determination of neonicotinoids and 199 other pesticide residues in honey by liquid and gas chromatography coupled with tandem mass spectrometry, Food Chem. 282 (2019) 36–47,https://doi.org/10.1016/j.foodchem.2019.01.003. [38] M. Abbas, A. Soliman, H. Elgammal, M. Amer, E. Attallah, Development and vali-dation of a multiresidue method for the determination of 323 pesticide residues in dry herbs using QuEChERS method and LC-ESI-MS/MS, Int. J. Environ. Anal. Chem. 97 (2017) 1003–1023,https://doi.org/10.1080/03067319.2017.1381954. [39] H. Wei, H.Y. Jin, Y. Wang, S.C. Ma, Simultaneous determination of 23 plant growth
regulator residues in Chinese materia medica by ultra performance liquid chro-matography-tandem mass spectrometry, [in Chinese, English abstract], Chin. Tradit. Herbal Drugs. 48 (2017) 1653–1660, https://doi.org/10.7501/j.issn.0253-2670.2017.08.026.
[40] S. Lehotay, K. Mastovská, A. Lightfeld, Use of buffering other means to improve results of problematic pesticides in a fast easy method for residue analysis of fruits vegetables, J. AOAC Int. 88 (2005) 615–629,https://doi.org/10.1080/