Université de Montréal
Differentiable PKC Activation on Pacemaking Activity of Cardiomyocytes Derived from Mouse Embryonic Stem Cells
Par
Merna Ghaffar
Département de pharmacologie et physiologie, Institut de génie biomédical, Faculté de médecine
Mémoire présenté en vue de l’obtention du grade de Maîtrise ès sciences appliquées (M.Sc.A.) en génie biomédical
Décembre 2019
Université de Montréal
Département de pharmacologie et physiologie, Institut de génie biomédical, Faculté de médecine
Ce mémoire intitulé
Differentiable PKC Activation on Pacemaking Activity of Cardiomyocytes Derived from Mouse Embryonic Stem Cells
Présenté par
Merna Ghaffar
A été évalué par un jury composé des personnes suivantes Guy Rousseau Président-rapporteur Philippe Comtois Directeur de recherche Pierre A. Mathieu Membre du jury
Résumé
Les maladies cardiovasculaires sont souvent causées par des arythmies qui proviennent d'une obstruction du système de conduction cardiaque. L'intervenant clé de ce système est le nœud sinu-atrial (SA), qui est responsable de l’initiation de chaque battement cardiaque. L’activation électrique à intervalles réguliers, assurant que le rythme cardiaque est un rythme normal. Le dysfonctionnement du nœud SA entraînerait des instabilités électriques dans le cœur. Une maladie cardiaque acquise, comme la cardiopathie rhumatismale, ou un bloc de conduction ne sont que quelques-uns des nombreux cas qui nécessitent un stimulateur cardiaque électronique pour surveiller la fréquence cardiaque et générer une impulsion lorsqu'elle bat anormalement. Bien que le stimulateur cardiaque électrique soit considéré comme une thérapie fiable, il n'est pas sans limites. Ces limites comprennent les complications chirurgicales, l'infection au plomb ainsi que la durée de vie limitée de la batterie, qui doit être remplacée à intervalles de quelques années, ce qui alourdit le fardeau hospitalier.
Plusieurs approches ont été adoptées pour développer une méthode thérapeutique plus adéquate. Une stratégie qui sera étudiée implique l'utilisation d'une greffe de cellules de stimulateur cardiaque, créant fondamentalement un stimulateur biologique.
Les approches de thérapie cellulaire utilisent des cellules souches embryonnaires pour évoluer vers les lignées de cellules cardiaques, y compris les cellules stimulatrices cardiaques. Ces cellules de stimulation sont caractérisées par une dépolarisation spontanée qui crée les impulsions rythmiques dans le cœur et contrôle la fréquence cardiaque. Un élément important des cellules du stimulateur cardiaque qui donne lieu à la dépolarisation spontanée sont les canaux « hyperpolarization-activated and cyclic nucleotide-gated » qui sont activés pendant l’hyperpolarisation et conduisent le courant sous le nom de « funny current ». Ce courant augmente la perméabilité intérieure de la cellule aux courants de sodium et de potassium conduisant à la dépolarisation de la cellule. D'autre part, le taux de conduction est déterminé par la connexine 30.2 et la connexine 45, qui sont des protéines transmembranaires qui s’assemblent pour former des jonctions lacunaires. L'expression de HCN et l'expression de la connexine ont toutes deux étés liés au facteur T-box 3 (Tbx3) dans le développement des myocytes
auriculaires.
Une approche praticable pour moduler l'expression des gènes et par conséquent l'expression des protéines est l'utilisation du conditionnement chimique. Le Phorbol 12- myristate 13-acétate (PMA) est un activateur de Protéine Kinase C (PKC) lié à l'expression de Tbx3, et par conséquent à l'expression de HCN et de connexine, et entraînant une modification de l'activité spontanée.
Les cellules souches embryonnaires de souris sont des cellules qui sont isolées de la masse cellulaire interne des embryons. Ces cellules ont la capacité de se différencier en tous les types de cellules somatiques. En combinant les facteurs de croissance, ces cellules peuvent se différencier en cardiomyocytes.
Nous émettons l'hypothèse que le conditionnement chronique de cardiomyocytes de souris avec PMA entraîne une régulation à la hausse de l'expression de Tbx3 et par conséquent une régulation à la hausse de l'expression de HCN et de l'expression de connexine, favorisant ainsi le développement des cellules stimulatrices cardiaques dans la population des cardiomyocytes.
Afin de vérifier notre hypothèse, nous avons acheté des cellules de la lignée cellulaire E14TG2A de souris. Ces cellules ont été cultivées dans des pétris et différenciées en cardiomyocytes à l'aide d'un protocole en trois étapes (voir la section Méthodes). Les cardiomyocytes sont ensuite exposés à la PMA à des concentrations variables (0.1 µM vs 1 µM) pendant 1h (exposition aiguë) ou 24 h (exposition chronique). Les résultats variaient d'un groupe expérimental à l'autre par rapport au groupe témoin. Dans toutes les conditions expérimentales, il semble y avoir une augmentation initiale de l'activité spontanée, mais elle s'inverse rapidement à la marque des 24 heures, où le rythme diminue. Différentes concentrations jouent un rôle dose-dépendant dans l'effet inhibiteur de longue durée sur la stimulation des cellules.
Mots-clés : stimulateur biologique, cellules souches embryonnaires, ester de phorbol, activateur PKC
Abstract
Cardiovascular diseases are often caused by arrhythmias that originate from an obstruction within the cardiac conduction system. The key player within that system is the sinoatrial (SA) node, which is responsible for initiation the electrical impulses at a regular interval, insuring the heartbeat at a normal pace. Dysfunction of the SA node would lead to electrical instabilities in the heart.
An acquired heart disease, such as rheumatic heart disease, or a conduction block are just some of many cases that would require an electronic pacemaker to monitor the heart rate and generate an impulse when it beats abnormally. Although the electric pacemaker is considered as a reliable therapy, it is not without limitations. These limitations include surgery complication, lead infection as well as limited battery lifespan, which requires replacement every few years thus adding to the hospital burden.
Several approaches have been taken to develop a more adequate therapeutic method. A strategy that will be investigated involves using a graft of pacemaker cells, fundamentally creating a biological pacemaker.
Cell therapy approaches use embryonic stem cells to evolve into the cardiac cell lines, including pacemaker cells. These pacing cells are characterized by spontaneous depolarization that create the rhythmic impulses in the heart and control the heart rate. An important element of the pacemaker cells that give rise to the spontaneous depolarization are the hyperpolarization- activated and cyclic nucleotide-gated (HCN) channels that are activated during hyperpolarization and conduct the funny current by increasing the cell’s inward permeability to sodium-potassium currents. On the other hand, the conduction rate is determined by connexin 30.2 and connexin 45, which are transmembrane proteins that assemble to form gap junctions. Both HCN expression and connexin expression has been linked to T-box factor 3 (Tbx3) in the development of atrial myocytes.
A practicable approach to modulate gene expression and consequently protein expression is using chemical conditioning. Phorbol 12-myristate 13-acetate (PMA) is a Protein Kinase C (PKC) activator that has linked to Tbx3 expression, and consequently HCN and
connexin expression, and lead to a modification in spontaneous activity.
Mouse embryonic stem cells (ESCs) are cells that are isolated from the inner cell mass of early embryos. These cells can differentiate into all somatic cell types. Given the proper combination of growth factors, these cells can differentiate into cardiomyocytes.
We hypothesize that chronic conditioning of mice cardiomyocytes with PMA lead to an upregulation of Tbx3 expression and consequently an upregulation of HCN expression and connexin expression, therefore promoting the development of pacemaker cells within the cardiomyocyte population.
In order to test our hypothesis, we purchased cells from the mouse E14TG2A cell line. These cells were cultured in glass bottom petri dishes and differentiated into cardiomyocytes using a three-step protocol (shown in Methods section). The cardiomyocytes are then exposed to PMA in varying concentration (0.1 µM vs 1 µM) for either 1h (acute exposure) or 24 h (chronic exposure). The results varied between the experimental groups compared to the control. In all experimental conditions there seems to be an initial increase in spontaneous activity, but this is quickly reversed at the 24 h mark, where pacing decreased. Different concentration plays a dose-dependent role in long-lasting inhibitory effect on the pacing of the cells.
Table of Contents
Résumé ... 1
Abstract ... 3
Table of Contents ... i
List of Tables ... iii
List of Figure ... iv
List of abbreviations ... vi
Acknowledgements ... vii
Introduction ... 8
1. The Heart Physiology ... 8
1.1 Heart Organisation ... 8
1.1.1 Working cells ... 9
1.1.2 Pacemaker cells ... 10
1.2 The Electrical Conduction System ... 12
1.2.1 The SA node ... 14
1.2.2 Physiology of natural pacing ... 15
1.3 Pacemakers: regulating the abnormal beating of the heart ... 17
1.3.1 Electrical Pacemakers ... 17
1.3.2 Biological Pacemakers ... 17
1.4 Phorbol 12-myristate 13-acetate (PMA) ... 18
1.4.1 PMA, HCN4, Cx43 connection ... 19
1.5 Project hypothesis ... 20
2. Materials and Methods ... 21
2.1 Cell Culture ... 21
2.1.1 Thawing ES cells ... 21
2.1.2 Passage ES cells ... 21
2.1.3 Cell differentiation ... 21
2.2 Spontaneous Activity Recording ... 23
2.4 Distribution of HCN4 and Cx43 ... 24
2.4.1 Immunofluorescent Staining and Confocal Imaging ... 24
3. Results ... 26
3.1 Videomicroscopy ... 26
3.2 Immunofluorescence ... 35
4. Discussion and Conclusion ... 43
References ... i
List of Tables
List of Figure
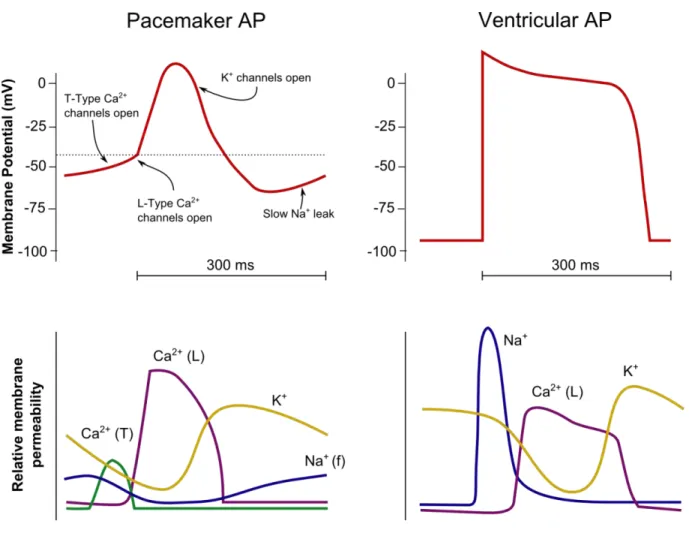
Figure 1. Action potential of a working cardiac cell versus pacemaker cell ... 10
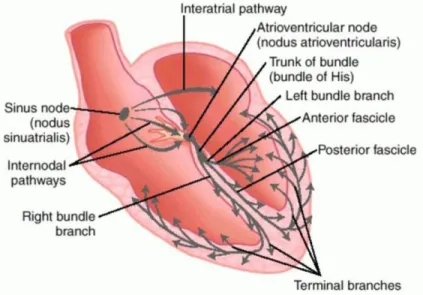
Figure 2. The cardiac conduction system… ... 12
Figure 3. The connexin topology… ... 13
Figure 4. Structure of PMA ... 19
Figure 5. 1 µM PMA versus Control Group ... 27
Figure 6. Sigma value (minus baseline value) of 1 µM PMA versus CTL group ... 28
Figure 7. Effect on period of activity of A) Acute (1h) versus B) chronic (24h) exposure of PMA at 0.1 µM and 1 µM concentrations ... 29
Figure 8. Period minus Baseline values for acute versus chronic PMA exposure experiment ……….………..30
Figure 9. Sigma values of acute versus chronic exposure to PMA of 0.1 µM and 1 µM concentrations ... 31
Figure 10. The effect of PMA at 0.1 µM and 1 µM at 1h exposure ………..…...32
Figure 11. Sigma values for 1 µM and 0.1 µM PMA for 1h exposure ... 33
Figure 12. The effect of PMA at 0.1 µM and 1 µM at 24h exposure ... 34
Figure 13 Sigma values within the groups at 24h of PMA exposure ... 35
Figure 14. cTnT antibody immunofluorescence staining (red) and DAPI staining for nuclei identification (blue). A) with DAPI B) without DAPI ... 36
Figure 15. cTnT antibody immunofluorescence staining (red) and DAPI staining for nuclei identification (blue). A)with DAPI B)without DAP ... 37
Figure 16. Gaussian Filter on HCN4 immunofluorescent image ... 38
Figure 18. Object Identification Filter on HCN4 immunofluorescent image ... 38 Figure 19. The differentiation protocol leads to samples with heterogeneous multilayer cells ... 40 Figure 20… ... 42
List of abbreviations
Ach: Acetylcholine
ANS: autonomic nervous system
ATP: Adenosine triphosphate
AVN : Atrioventricular node
BMP4: Bone Morphogenetic protein 4
CTL : Control
CTnT: Cardiac Troponin T
CX: Connexin
DAG: diacylglycerol
DAPI: 4’,6-Diamidino-2-phenylindole dihydrochloride
ESC: Embryonic stem cells
HCN: Hyperpolarization-activated cyclic nucleotide-gated channels
hFGF/hFGF10: Human Fibroblastic Growth factors
Isl1: Islet 1
M2/M3: muscarinic receptor 2/3
mV : millivolts
NE: norepinephrine
PKC: Protein Kinase C
PLD : Phospholipase D
PMA: phorbol 12-myristate 13-acetate
SA : Sino-Atrial node
Shox2: Short Sature Homeobox 2
SR: Sarcoplamic reticulum
Tbx3: T-Box factor 3
Acknowledgements
Would like to thank Messieurs Philippe Comtois, Jonathan Ledoux, Alain Vinet and Alexandre Blanchette for all their hard work in helping me finishing my thesis. Truly appreciate the time and effort inputted.
To my family, thank you for the constant support.
Introduction
1. The Heart Physiology
1.1 Heart Organization
The heart is a muscular organ that enables the circulation of blood throughout the body. Multiple resident cell types contribute in the physiological function and structural integrity of the heart, with the most abundant being cardiomyocytes, endothelial cells and fibroblasts.
Cardiomyocytes are essentially the primary muscle cells that make up the heart. These perinuclear cells appear tubular and elongated and consist mostly of contractile protein and numerous mitochondria. While mitochondria play the role of the power house that provides energy to the cell, the contractile protein filaments actin and myosin (also known as myofibrils), which make up the thin and thick filaments respectively, bounded to adenosine triphosphate (ATP) allows for muscle contraction regulated by action potentials and calcium concentrations. Other organelles are also found in the cardiac cells such as sarcoplasmic reticulum (SR), which are membrane-bound structures that stores calcium ions. It has been shown that contracting cardiomyocytes are correlated with cardiac troponin T (cTnT) expression [1] and is being used to identify cardiomyocytes via immunofluorescence (using cTnt antibody).
The cardiac muscle cells can be divided into two subtypes: working cells and pacemaker cells [2]. Most myocytes are working cells. These cardiac cell subtypes vary in their action potential patterns, which is characteristic of their roles. For instance, working cells have a stable resting membrane with a prolonged repolarization phase while pacemaker cells have an unstable resting membrane that generate regular spontaneous action potential which produces the intrinsic electrical activity of the heart.
Endothelial cells compose the majority of non-myocyte cells. The intricate arrangement of these cells to cardiomyocytes allows for physiological transport. It has been shown that endothelial-cardiac interaction is essential for normal cardiac development and growth[3]. They
play a vital role in heart development and in promoting cardiomyocyte organization and survival [3].
Fibroblasts also play an essential role in maintaining homeostasis in the heart as well in cellular remodeling in response to changes in gene modification in pathological conditions [4]. They response to stimuli by secreting cytokines and growth factors, differentiating into myo- fibroblast and/or altering the extracellular matrix.
The collective function of the different subtypes of cells is essential for the proper function of the heart.
1.1.1 Working cells
The working cardiomyocytes constitute both atrial and ventricular chambers of the heart. These cells are responsible for conducting impulses and ultimately the contraction that pumps the blood through the body. These contractile cells have a stable resting phase of approximately -80 mV. The electrical pattern is of a rapid depolarization, a plateau phase then a repolarization. The depolarization phase is triggered when positive charges pass from an adjacent cell, causing passive depolarization crossing over the threshold of activation of the voltage-gated sodium channels. Inward sodium current raises the membrane potential more positively, at which point the sodium channels close. The plateau phase develops due to the opening of slow calcium ion channels, allowing calcium ions to enter the cells while potassium ions exit the cell, causing the membrane potential to decline slowly. Once the membrane potential reaches around zero, the calcium ion channel closes while the potassium ion channels remain open, allowing potassium ions to exit the cell. This causes the membrane potential to decrease until the resting levels is reached and the cycle repeats itself. The refractory period is the interval of time after an action potential initiation within a cell where a new action potential cannot be produced. This is due to the fact that the fast sodium channels remain inactive after closing until the membrane potential has fully repolarized. The refractory period is required for the cardiac cell to pump blood effectively before they are capable of firing for a second time [5].
Figure 1. Action potential of a working cardiac cell versus pacemaker cell (Redrawn from Vander’s physiology: The mechanisms of body function, 2008)
1.1.2 Pacemaker cells
Pacemaker cells, on the other hand, are specialized to initiating electrical activity and controlling the rate of contraction of the cardiac muscle. These cells are primarily found within the SA node are known to be the primary pacemaker of the heart. They do not have a “true” resting potential but rather produce regular spontaneous action potentials. Here, depolarization occurs due to calcium ion currents, in contrast to the sodium ion current in working cells. The voltage and calcium clocks (dictated by the rhythmic calcium ion release from the sarcoplasmic reticulum) work together in regulating SA node activity and their activation are interdependent. The spontaneous depolarization triggers the action potential once the membrane potential reaches the threshold (around -30 mV to -40 mV). This leads to the depolarization phase, where more
calcium ions enter the cell. Repolarization follows due to opening of potassium ion channels leading potassium ions to exit the cell. At the end of repolarization, the cell hyperpolarizes, and the membrane potential reaches approximately -60 mV and causes slow, inward sodium ion channels to open, creating what is called “funny current”. These currents cause the membrane potential to begin to spontaneously depolarize, leading to the opening of transient calcium ion channels at around -50 mV, further depolarizing the cell. At -40 mV the long-lasting calcium ion channels open causing more calcium ions to enter the cell until the action potential threshold is reached. The hyperpolarized state is essential to activate the pacemaker channels by activating specific cation channels called hyperpolarization-activated cyclic nucleotide-gated channels (HCN) [6].
HCN channels comprise of four subtypes (HCN1-4) that are expressed in the cardiac cells and neurons. While HCN3 is specifically expressed in neurons, HCN1, HCN2 and HCN4 are found in both the heart and brain. They differ in their activation kinetics: HCN1 is has the fastest conductance and is followed by HCN2 and HCN3 while HCN4 is the slowest channel. They are activated at negative membrane potential resulting a depolarizing current by being permeable to sodium and potassium ions [7].
In the mouse SA node, HCN4 is the predominant channel type, suggesting that it plays a key role in the generation of primary pacemaker potential [8].
HCN channels are also found in atrial and ventricular working myocytes, where HCN2 isoform predominates. This suggests that while HCN4 is correlated with pacemaking activity, HCN2 is essentially correlated with non-spontaneous cells [9]. This further supported by a finding that suggests that HCN channel expression changes during embryonic development. While at an early embryonic stage, where all cells exhibit automaticity, HCN4 and HCN1 isoforms predominate. Upon differentiation to working myocytes, the HCN2 isoform prevail [10].
1.2 The Electrical Conduction System
The cardiac electrical conduction system is composed of specialized cardiac muscle cells that cause contraction of the heart muscle and ultimately control the heart rate. Main components of this system are SA node, AV node, bundle of His and Purkinje fibers. The SA node initiates the sequence of events by releasing an electrical stimulus at a regular rate, which is dictated by the body’s need, and causes the atrial muscles to contract. The electrical impulses reach the AV node after some delay and spreads down the bundle of His and Purkinje fibers, and further spreading into the lower chambers of the heart causing the contraction of the ventricles.
Each component of the system is composed of specialized heart cells that generate and coordinate the transmission of electrical impulses to myocardial cells resulting in a sequential contraction providing effective flow of blood and requires cell to cell transfer of current through cell pore known as gap junctions.
Figure 2. The cardiac conduction system. The components are shown in the diagram as well as directional activation patterns. (Dorland's Medical Dictionary for Health Consumers. (2007). Retrieved on May 3, 2019)
Gap junctions are made of multiple tightly packed protein channels called connexins (Cx) that allows the flow of ions and other small-sized molecules and thus plays an important role in
electrical conduction. They each consist of four transmembrane domains and two extracellular loops that are similar but differ in their amino acid sequences on their intracellular domains, which contribute their specific channel properties [11]. An individual intercellular channel is formed from the interaction of two hemi-channels, also called connexons, formed from six connexins subunits. As shown in Figure 3, many connexons are formed of one connexin isoform, however some are a mixture of subunits. Studies have characterized numerous types of connexins, each with a varying biophysical property which is responsible for the specific channel properties such conduction rate. Therefore, the spatial distribution of the different types of connexins plays an instrumental role in the electrical activation and spreading patterns within the cardiac muscle tissue in the heart [12].
Figure 3. Connexin topology. a) The connexion topology within the lipid bilayer b) illustrates the subclasses and the oligomerization of connexins into homomeric or heteromeric hexamers with other connexins [13].
Multiple combination of connexins are expressed within a tissue and an individual cell express multiple connexins. This means that different tissues of the heart express different
combination of connexins in varying amounts. Consequently, the pattern of the Cx isoform determines the excitation layout within a particular tissue within the heart [14].
It has been shown that the mouse heart express Cx43, Cx45 and Cx40 and Cx30.2 [15]. Cx30.2 and Cx45 are found in the SA and AV node of the mouse heart. These channels exhibit higher resistance and thus have a slower conductance rate. The slow conduction in the AV node allow the contraction of the atrium to occur before the beginning of the contraction of the ventricles by the SA node. This permits the activation of the atrial from a small group of SA node cells. In contrast, atrial and ventricular working cardiomyocytes exhibit more Cx40 and Cx43, both known to be of a high conductance channel, assuring the synchronous contraction of both atria/ventricles. The transitional region between the SA and AV node region and the working myocyte would show all four Cx isoforms [16].
1.2.1 The SA node
SA node forms the uppermost part of the cardiac conduction system. Located in the upper right atrium of the heart, it is the heart’s natural pacemaker. It consists of pacemaker cells that ultimately fire at regular intervals that initiates the electrical propagation of the heart leading the heart to beat. These pacemaker cells are embedded in a dense matrix of fibrous tissue that surrounds it from the atrial cells, which acts as an insulator from the hyperpolarization of the neighboring atrial cells [17].
SA node function depends on the complex tissue architecture and a set of ion channels and gap junctions’ expression [18]. The exact mechanism by which the SA node differentiate during the embryonic period has been a source of interest yet is still indefinite. Nonetheless, there is a specific pattern of gene expression that differentiate these cells from the surrounding myocardium and this expression is directed by certain transcription factors that are shown to have been correlated with the development of the spontaneous activity of these cells [18].
1.2.1.1 Transcriptional Regulation of Pacemaker Cells
Studies have shown that in mouse SAN forms at around embryonic day 10 to 11 from the myocardium of the sinus horns [19]. The SAN has a distinct phenotype than the other
resident cells found in the atria and runs a particular ion channel and gap junction gene expression that is crucial for normal pacemaker function. The mechanism underlying SA node formation is still insufficiently understood although functional analyses of identified transcriptional genes have provided some insight into the molecular program in the formation and maintenance of the SAN. Genetic studies have revealed requirements for several transcriptional genes that play a role in preventing the differentiation of working myocardium or promoting pacemaking activity, which is essentially involved in the formation of the SAN.
T-Box 3 (Tbx3) is a transcription factor highly expressed in the conduction system during the embryonic development. It acts as a transcriptional repressor and imposes the pacemaker phenotype in the cells that are Tbx3 positive. Tbx3 deficiency results in partial loss of the sinoatrial domain and the development of lethal arrhythmias [20] while complete loss can be fatal [21].
Short Stature Homeobox 2 (Shox2) is another homeobox transcription factor that plays a role in repressing myocardial development and is restrictedly expressed in the SAN. It acts by repressing the expression of Nkx2-5, which plays a role in atrial cell development [22]. Shox2 null mutation is embryonically fetal due to the development of cardiovascular defects [23].
Islet1 (Isl1), a LIM homeodomain transcriptional factor, also seems plays a key role in survival, proliferation and function of pacemaker cells and is required for embryonic viability. ISL1 expressing cells have the potential to develop into multiple cell types in the heart. Studies have shown that ISL1 expressing cells are maintained in the SAN and AVN [24].
Evidently there are other transcription factors identified that have been linked SAN development, however our focus rest in the three mentioned above. Nevertheless, it is important to mention that SAN development is due to the integrative work of different transcription factors working collectively.
1.2.2 Physiology of natural pacing
Despite the fact that the intrinsic conduction system coordinates the heart’s electrical activity, the rate of pacing activity is influenced by the autonomic nervous system (ANS) and
endocrine control [24]. This allows the body to respond to changes in tissue needs (oxygen, nutrients, etc.).
The ANS is composed of the sympathetic and parasympathetic nervous system; they exert antagonistic effects on the heart. The cardiac sympathetic preganglionic nerves emerge from the upper thoracic segments of the spinal cords and enter the sympathetic ganglia. From there, the postganglionic fibers extend to the heart. The preganglionic neurons release acetylcholine (ACh), just as most of the preganglionic neurons in the ANS, the postganglionic endings release norepinephrine (NE). Stimulation by the sympathetic nervous system leads to an increase in heart rate (also referred to as positive chronotropic effect), increase in contractility (also referred to as positive inotropic effect) and enhances conductivity of the electrical pulse (also referred to as positive dromotropic effect). There are four types of adrenergic receptors in the cardiovascular system that respond to sympathetic stimulation: β1, β2, α1, and α2. β1 receptors
are expressed in the heart and its activation increases the heart rate and contractility. α1 and α2 are
expressed in cardiomyocytes in small amounts, but mainly expressed in vascular smooth muscle cells, where their activation elicits vasoconstriction while β2 receptor activation has the reverse
effect [25].
The cardiac parasympathetic system plays an antagonistic role to the sympathetic system in regulating the cardiovascular system. It has pre-ganglionic neurones that arise directly from neurons from the mid-brain and synapse with postganglionic fibers within the heart. Unlike the sympathetic nervous system, the postganglionic fiber releases ACh, and slows the contraction of cardiomyocytes by activating muscarinic receptors (M2). There is another type of muscarinic receptor, M3, that is mainly expressed in the vascular endothelial cells and its activation leads to dilation of the vessels. Since the parasympathetic nervous system is said to play an antagonistic role to the sympathetic system, then ultimately it leads to negative chronotropic effect, negative inotropic effect and negative dromotropic effect [25].
In addition to the ANS, the heart rhythm is influenced by hormones. Hormones released from adrenal gland (epinephrine released in fight or flight), pituitary gland (vasopressin released to increase water retention and lead to increase blood pressure), kidney (renin-angiotensin- aldosterone system serves to regulate blood pressure) and from the heart itself (atrial-natriuretic peptide) are a few examples of hormones influencing the cardiovascular function [26].
1.3 Pacemakers: regulating the abnormal beating of the heart
Diseases within the sinus node due to aging, fibrosis, inflammation or other conditions can disrupt the cardiac electrical signaling, cause sinus arrhythmias and lead to sudden death. SAN diseases are diagnosed using an electrocardiograph (ECG) where features of bradycardia (<60 beats/min) or asystolic pause (>3s) are exhibited [27]. Current therapy involves the implantation of an electronic pacemaker. Even though the electronic pacemaker is considered as an effective treatment, more recent research investigative the development of biological pacemaker and in consequence widening the therapeutic armamentarium for conduction system disorders.
1.3.1 Electrical Pacemakers
Electrical pacemaker is the main therapy for slow heart rhythms due to cardiac conduction system disease. It is a small device placed in the chest that monitors and fire an electrical stimulation at abnormal heart rhythm. These implantable electronic pacemakers’ technology continues to evolve providing artificial pacing for different patient populations [28]. While practical, these devices come with a set of risks, such as device malfunction [29], lead- caused infection [30], thrombogenic risks [31] and lacks physiological autonomic response (not ideal for pediatric patients) [32]. Current-generation pacemakers such leadless pacemakers with contemporary battery technologies tackle these concerns [33]. Although these systems are designed to meet the physiological demands, they are unmatched to physiological rate responses.
1.3.2 Biological Pacemakers
Different biological approaches to enhance cardiac automaticity have been investigated over the years. Biological pacemakers generated by gene transfer and cell transplantation approaches have the common goal of regaining automaticity within pacemaker cells in the SA node [34].
Gene-based approaches Gene therapy refers to the manipulation of gene expression in target cells within a tissue for the desired therapeutic outcome. The reprogramming strategy for developing the biological pacemaker involves using a vector to introduce the gene of interest into a target cell and incorporate into in the host genome. The possible gene targets for arrhythmias are wide-ranging. A vector encoding certain transcription factors was successful in transforming the working myocardium into pacemaking cells [35]. Studies have been reported to have successfully convert heart-muscle cells into pacing cells [36,37]. Other gene-based approaches use ‘functional engineering’ whereby manipulating an ionic current, such as an overexpression of inward rectifier potassium ion channels or HCN2, in ventricular cardiomyocytes transforms them into pacing cells [38, 39]. These experiments require large amounts of vector particles for efficacy. Although the feasibility of gene transfer has been demonstrated in both animals and humans, the extent of the gene transfer and expression is low in clinical settings compared to the experimental setting.
Cell-based approaches This approach involves transplanting a collection of pacemaker cells into the SA node to induce automaticity. Multiple candidate cell types have been used in preclinical studies to regenerate the injured heart, including embryonic stem cells (ESCs) [40] and induced pluripotent stem cells (iPSCs) [41][42]. ESCs cells are derived from the inner cell mass of the embryo and have the capacity to replicate and differentiation into any cell type, including cardiomyocytes. However, their unlimited differentiation can lead to forming teratomas once transplanted in their undifferentiated state [43]. They also are ethically problematic since they are obtained from early human embryo [44]. In addition, there is evidence that undifferentiated ESCs are rejected by host immune system [45]. Nonetheless ESCs are the most favored source for cardiac cell therapy. To overcome the ethical controversies, ESCs sources are used from species, other than human for experimental purposes and/or human iPSCs.
1.4 Phorbol 12-myristate 13-acetate (PMA)
Phorbol 12-myristate 13-acetate (PMA) is a phorbol ester used in biomedical research as a protein kinase C (PKC) activator. Naturally found in Euphorbiacaeae and Thymelaeaceae
family plants, phorbol esters are structurally specific. The structure is dependent on the tetracyclic diterpene carbon skeleton known as tigliane. The tigliane is composed of four rings designated as A, B, C, D and the hydroxylation at different positions form a variety of phorbol esters [46].
Figure 4. Structure of PMA (the active phorbol is also referred to as tetradecanoyl phorbol-13-acetate (TPA)) [32]
The interaction of PMA with PKC influence the activity of several enzymes, protein synthesis, cell differentiation and gene expression, just to name a few. The most explored activity of the phorbol ester is the activation of PKC, which plays a crucial role in cell growth and differentiation [46]. It has been proposed that PMA mimics the activity of diacylglycerol (DAG), but a stronger activator, by hyperactivating PKC and is irreversibly inserted into the cell membrane. They are known to promote tumor growth following exposure to a carcinogen [47].
1.4.1 PMA, HCN4, Cx43 connection
It has been shown that PMA increases TBX3 expression incrementally at the transcriptional level through PKC activation via AP-1 in MRC-5 and PNT1A cell lines [48]. An ectopic activation of Tbx3 within embryonic atrial myocytes resulting in inducing HCN4 expression, leading to in a formation of an ectopic pacemaking site [49]. Additionally, it is important to note that the SA node of mice co-express Tbx3 and HCN4 [50] [51] while Cx43 is selectively expressed in atrial myocardium [52].
1.5 Project hypothesis
Our hypothesis is that long term exposure to PMA of mouse embryonic stem cells following a differentiation protocol into cardiomyocytes would lead to an increase in HCN4 and a decrease in Cx43 expression in conjunction with an increase in spontaneous pacing activity within the monolayer.
2. Materials and Methods
2.1 Cell Culture
2.1.1 Thawing ES cells
Mouse embryonic stem cells ES-E14TG2a were purchased from SIGMA-ALDRICH. The cells are quickly transferred from liquid nitrogen directly to 37°C water bath. The vial is thawed until the frozen cell suspension detaches from the bottom and only a small ice clump is visible. Pre-warmed medium containing DMEM (D5796, Millipore Sigma), 2 nM Glutamine (25030081, Gibco), 1% non-essential amino acid (11140050, Gibco), 0.1 mM 2- Mercaptoethanol (M6250, Gibco), 10% Fetal Bovine Serum (F1051, Millipore Sigma) and 1000 U/ml of mouse inhibitory factor (LIF) (ESG1107, Millipore Sigma). The cells are transferred from the vial to 9 ml of pre-warmed ES cell medium in 15ml tube. The cells are then plated in a 60x15 mm culture dish (83.1801, Sarstedt Inc. Newton, NC, USA) pre-coated with ultrapure water 0.1% gelatin (ES-006-B, EmbryoMax). The petri is then left in a humidified 37 °C, 5% CO2 incubator. This step allows the adhesion and proliferation of the ES cells until confluency
reaches 80% (approximately at 48hr) which is when the cells are passed.
2.1.2 Passage ES cells
Petri are rinsed twice with Ca2+‐ and Mg2+‐free Dulbecco’s Phosphate Buffered Saline
(D-PBS) (BSS-1006-B, EmbryoMax). Sufficient 0.05%Trypsin: 0.54Mm EDTA (SM-2002-C, Millipore) solutions is added to cover the cells and is incubated for 2 mins. When the cell layer has loosened, 5ml of ES cell medium is added to neutralize the trypsin and dispersing of cells is done by pipetting up and down a couple of times. The cells are counted and reseeded at a density of 8 x 10^5 cells per 20 mm diameter well glass-bottom culture dishes (D29-20-0-N, in vitro Scientific, Sunnyvale, CA) pre-coated petri with ultrapure water 0.1% gelatin.
2.1.3 Cell differentiation
There is a considerate number of protocol available for differentiation of embryonic stem cells into cardiomyocytes [53][54][55][56]. However, the protocol used here is a simple three-
step monolayer differentiation that produce cardiomyocytes within two weeks of culturing [57]. The cells are washed twice with D-PBS (14190136, Gibco) before changing into IMDM (11765054, Invitrogen) and Ham’s F12 (11765054, Invitrogen), N2 supplement (17502048, Gibco), B27 supplement (17504044, Gibco), 10% bovine serum albumin (BSA) (A1595, Sigma), L-glutamine (25030081,Gibco), Penicillin-Streptomycin (15070063, Gibco), 0.5mM ascorbic acid (A92902, Sigma) and 4.5 × 10⁻⁴ M monothioglycerol (M1753, Sigma) and are kept
for 24 hours. This is followed by mesoderm induction and patterning by adding 5ng/mL of vascular endothelial growth factor (VEGF) (V7259, Sigma), 5 ng/mL Activin A (SRP6153, Sigma) and 0.1 ng/mL BMP4 (SRP3016, Sigma) for two days. The last step specifies the cardiac lineage and maturation by introducing StemPro-34 (10639011, Gibco) medium with 2 mM L- glutamine (25030081,Gibco), 0.5 mM ascorbic acid (A92902, Sigma), 5 ng/mL (V7259, Sigma), 10 ng/mL bFGF (PHG0266, Gibco) and 50 ng/mL human FGF10 (PHG0204, Gibco). The medium is changed every other day for 6 days, at which spontaneous pacing activity can be seen.
In both experiments, baseline values were taken (based on three different videomicroscopic videos for each petri) for all petris (even before separating them into groups) on day 10 post cardiomyocyte differentiation. For the first experiment a total of eight petris were separated into two groups (four petris for each condition, control vs PMA (the experimental group). 1 µM of PMA (P8139, Sigma) added for 48 h for samples of the experimental group while the control group was cultured in parallel. After the 48 h mark, both groups undergone washing with PBS and reintroduced with medium without PMA. Videomicroscopy measurements were taken at 24 h, 48 h (before washing) and every two days post PMA introduction until ten days post PMA introduction For the second experiment (acute vs chronic exposure), five groups of four petris each were studied in parallel; a control group, an experimental group with 0.1 µM PMA introduced for 1h, an experimental group with 1 µM PMA introduced for 1h, an experimental group with 0.1 µM introduced for 24 h and an experimental group with 1 µM PMA introduced for 24h. Measurements in this experiment were taken at the 1h mark, 24 h mark, 48 h and finally at 72 h post the start of the experiment).
2.2 Spontaneous Activity Recording
In order to study the effect of PMA on spontaneous pacing activity, videomicroscopy was taken every other day using a Dalsa HM640 camera (using 60 frames per second) combined with an inverted Nikon Optical microscope (10X magnification). The analysis was done as previously described [58].
Let M(t) be the global camera frame recorded at time t. The composite signal
S
is calculated using the following equation:1 Ny Nx M
(
t)
− M(
t−)
S
(
t)
=i, j i, j , (0.1)
Nx Ny j =1 i=1
where = 3 (or interval between frames), Ny and Nx are respectively the number of horizontal
and vertical pixels. All analysis regarding the period of activity was done after selection of the region of interest following visual observation.
To study the link between thickness and beating activity, a local composite signals are calculated over sub-regions of Nsub,x and Nsub,y pixels from the total FOV with eq. Error!
Reference source not found. (similar to eq. Error! Reference source not found.) .
1 Nsub , y Nsub ,x Mu+ N (y'−1),v+ N (x '−1)+
(
t)
− Mu+ N (y'−1),v+ N (x '−1)(
t −)
Sx ', y '
(
t)
=N N
sub. y sub. x sub. y sub. x
sub. y sub,x u=1 v=1
(0.2) where Nsub,y=Nsub,x=10 and = 1, M(t) is the movie frame at time t, u and v are the local
coordinate within a sub-region of the FOV and x’ and y’ are the new position within the segmented FOV (such that x’=1, y’=1 is the first pixel of the new video calculated from on the individual signals of the pixels y=1 to 10 and x=1 to 10 from the original video).
The energy (E) of the local composite signals are calculated using
1 Nt d S (t) 2
where Nt is the number of frames of the original video. An example of the spatial distribution of
log(Ex’,y’) is displayed in Fig. 8A and the corresponding histogram can be found in panel B. High
energy regions of the FOV are selected using a thresholding approach with threshold value obtained with Otsu’s method.
For each measure on a petri, 3 videos of (duration of the video) duration were obtained. From these, the activation time were detected as in [58] and pooled together to obtain the mean period of activation (P) and its temporal standard deviation
(
P)
.2.3 Statistical Analysis
The analysis of P and o
(
P)
involved a Group effect (comparing the total means of each condition), a time effect (comparison of the mean of all conditions obtained at each time), and a Group*Time interaction (comparison of temporal evolution between groups). For the period the analysis was done with Repeated Measures Anova, using Huyn-Feldt corrected F test to assess significance (IBM-SPSS v24). With this procedure, only petris with measurements across all time points could be included. For experiments 2, for which some petris were withdrawn for molecular expression measures (not mentioned here due to inconsistent results), analysis was repeated using mixed linear model, in which all measures can be included (IBM-SPSS v24). Foro
(
P)
, analysis was done using the non-parametric repeated measures procedure nParLD as implemented in R [59]. For this test, Anova-type statistics was used. As for analysis of(
P)
, non-parametric factorial analysis was done.2.4 Distribution of HCN4 and Cx43
2.4.1 Immunofluorescent Staining and Confocal Imaging
The identification of cardiomyocytes is done by immunofluorescence as well as the evaluation of HCN4 and Cx43 distribution in experimental groups vs. control group. The
cardiomyocytes were identified using anti-cTnT rabbit polyclonal antibody (ab92546, Abcam), the HCN4 using anti-HCN4 rabbit polyclonal antibody (ab66501, Abcam) and Cx43 using anti- Cx43 goat polyclonal antibody (ab219493, Abcam). The cells are stained with cardiac antibodies. This was done by starting off by fixing the cells with 4% paraformaldehyde at room temperature for 20 mins. After washing with PBS three times, the cells are then blocked and permeabilized with 2% normal donkey serum and 0.1% Triton for an hour at room temperature and washed three times with PBS. The cells are then incubated with the antibodies for cardiac troponin protein (cTnT) or HCN4 and connexin 43 (Cnx-43) with 0.05% triton at 4 ºC for 24 hrs. After washing three times with PBS, the secondary antibody is introduced and incubated for an hour at room temperature (both cTnt and HCN4 were identified using donkey anti-rabbit 555 (A32794, Invitrogen), while Cx43 was identified using donkey anti-goat 647 (A32849, Invitrogen). Subsequently 4’,6-Diamidino-2-phenylindole dihydrochloride (DAPI) at 300 mM concentration is added for imaging the cell nucleus and followed by washing three times with PBS. Finally mounting is done with Dabco 4% in order to be visualized.
In order to compare distribution of HCN4 and Cx43, we used the maximum intensity projection images for each condition and examined the overlapping values using CellProfiler; the pipeline started off with Gaussian filter followed by a noise filter and finally an object (in our case, HCN4) identification filter. After obtaining the objects, it measures the intensity of Cx43 overlapping within these HCN4 objects. This allows us not only allows us to quantify HCN4 in terms of numbers of objects identified, but also gives us an assessment of the spatial distributional pattern of HCN4 versus Cx43. Lower and upper bounds on threshold are 0.12 and 1.0 respectively and a threshold correction factor of 1.0.
Confocal imaging was used to look at the spatial characteristics of the samples. This was done by estimating the thickness of the samples using the z-stack of the immuno-images. Regions corresponding to the nuclei was determined using thresholding based on Otsu’s method. The thickness (Δz) for each (x,y) position was calculated as the difference between the first and last position in z of the obtained binary masks. The maximum thickness (Δzmax) was
3. Results
3.1 Videomicroscopy
For the first experiment, the CTL group was compared to the experimental group (1 µM of PMA for 48h). Repeated measure Anova was performed on period and period with baseline value subtracted. In both case, there was no significant Group effect (p=-.08 and p=0.21 respectively, but significant Group*Time (p=0.03 and p=0.04 respectively). We can see that there is a distinct pattern on evolution for each condition, the experimental group evolving oppositely to the CTL group. As shown in Fig. 5, PMA shows a significant inhibitory effect at the two-week mark (T- test p=0.028) and a similar Group*Time effect was significant for (P) (as seen in Fig. 6 with
p=.02 and p=0.03 without and with baseline subtracted respectively). At the two-week mark, PMA increased the temporal variance of the period ( (P) with baseline subtracted, Mann-
Whitney test, p=0.029). This distinctive pattern between the CTL group and the experimental group seem to indicate some long-term inhibitory effect may be caused by PMA activation, which is not manifested in the CTL group.
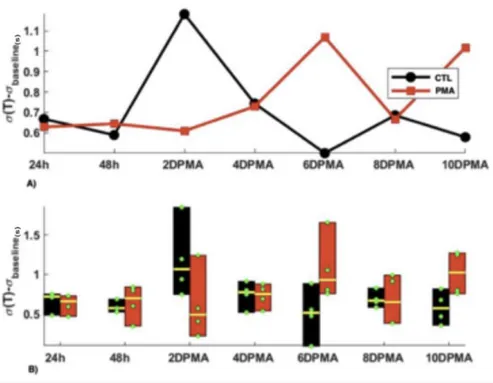
Figure 5. 1 µM PMA versus CTL Group. A) The average period for each condition at each timepoint. Note that in each point, the baseline value was subtracted from the average period. B) The distribution of the period (minus baseline value) within the petris for each condition at different timepoints. Green dots are the period values for each petri and yellow line is the median. 2DPMA= 2 days post PMA introduction
Figure 6. Sigma value (minus baseline value) of 1 µM PMA versus CTL group. This graph shows the pattern for temporal variability. It appears that the pattern mimics that of the average period. 2DPMA= 2 days post PMA introduction
For the second experiment, we looked into the acute vs chronic effect of PMA with varying concentration on the pacing activity of cardiomyocytes. The acute group are the experimental petri dishes that were introduced to 0.1 µM and 1 µM PMA for 1h while the chronic group are the experimental petri dishes that were introduced to 0.1 µM and 1 µM of PMA for 24 h. The petri dishes were separated to five separate groups (CTL group, 0.1 µM PMA 1h, 1 µM PMA 1h, 0.1 µM PMA 24 h and 1 µM PMA 24 h).
While the previous experiment showed a significant inhibitory effect of PMA at the two-week mark, the following experience’s results are quite interesting.
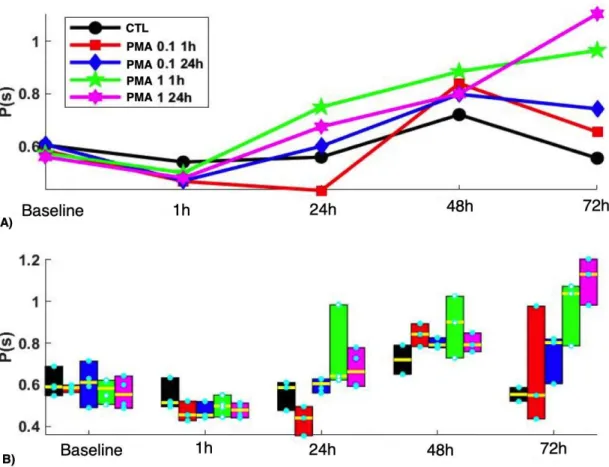
Figure 7. Effect on period of activity of A) Acute (1h) versus B) chronic (24h) exposure of PMA at 0.1 µM and 1 µM concentrations starting on day 10 post cardiomyocyte differentiation.
Both the Repeated measures Anova and the mixed model diagnosed significant effects (Group (p=0.23, 0.004), Time (p< 0.001) and Group*Time (p=0.003, 0.037)).
As shown in the Fig. 7 (see also Fig. 8), from 24hr, the higher concentration of PMA in both 1h and 24h exposure showed a progressive increase in the period of activity, which is delayed for 1 µM 24 hr. At the end, the period is ranked according the concentration and time of applications (highest concentration and longest time having the longest period). The standard deviation also followed a similar pattern (shown in Fig. 9, Group, p=0.04, Time, p<0 .001, Group*Time, p< 0.001). Note that for this second experiment it lasted for 72h (in contrast to the 2 weeks mark of the first experiment).
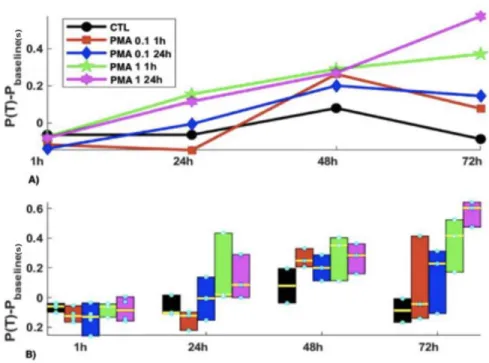
Figure 8. Period minus Baseline values for acute versus chronic PMA exposure experiment. The same graph as Figure 7 but with the baseline values subtracted to look at the net effect of the PMA on the pacing frequency of the cells.
Figure 9. Sigma values of acute versus chronic exposure to PMA of 0.1 µM and 1 µM concentrations
In order to dig deeper at the effect of concentration and the effect of time of exposure, we have decided to separate the results into two separate graphs.
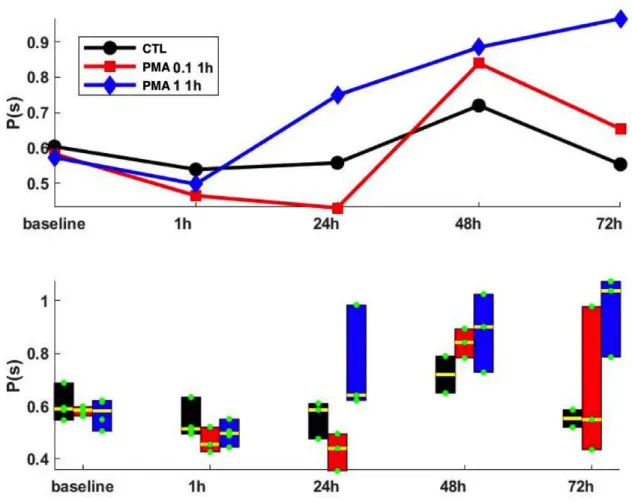
Figure 10. The effect of PMA at 0.1 µM and 1 µM at 1h exposure. Here we can compare the effect of different concentration at a transient exposure of PMA.
At a transient exposure of PMA (1h) we can see there is a small decline in period (an increase in frequency of spontaneous activity) during that 1h of exposure. However, at the time between the 1h and 24 h (which is 24 h period post PMA exposure), there is a distinction between the three groups; the 0.1 µM PMA group show a further decline in period, while 1 µM PMA steeply increases and the control group stays more or less the same.
Figure 11. Sigma values for 1 µM and 0.1 µM PMA for 1h exposure. Looking at the standard deviation we can see that the 1 µM PMA at 1h is increasingly more unstable with time. The 0.1 µM PMA is most unstable at the 72 h mark.
To get more insight on the effect of longer PMA exposure on the pacing activity, we have compared the values of the three groups with 24 h of exposure.
Figure 12. The effect of PMA at 0.1 µM and 1 µM at 24h exposure. Comparing the control group, 0.1 µM PMA and 1 µM PMA with 24 h PMA exposure. There is a comparable performance between the 0.1 µM and 1 µM PMA group, with an initial increase in pacemaking frequency at 1h (decreased period of activity). With time the period of pacemaking activity linearly increases in both groups, with the 1 µM PMA ultimately having the slowest pace at the 72 h mark.
Figure 13. Sigma values within the groups at 24 h of PMA exposure.
3.2 Immunofluorescence
Two sets immunofluorescent experiments took place. The first experiment was done to ensure that we were successful in differentiating mice embryonic stem cells into cardiomyocytes and to able differentiate them from other cells. In order to do so, we used cTnT antibody since they are specific to cardiomyocytes [60].
A.
B.
Figure 14. cTnT antibody immunofluorescence staining (red) and DAPI staining for nuclei identification (blue). A) with DAPI B) without DAPI
A)
B)
Figure 15. cTnT antibody immunofluorescence staining (red) and DAPI staining for nuclei identification (blue). A) with DAPI B) without DAPI
Our second immunofluorescent experiment aimed to look at the distribution of HCN4 and Cx43 within our monolayer. Here the experiment looked at the timeframe at 24 h mark; this means for 0.1 µM and 1 µM PMA 1h exposure, it was 24 h post PMA exposure (delayed effect) and for the 0.1 µM and 1 µM PMA 24 h exposure it was right after medium change (immediate effect). Now since each condition (1h and 24 h) represent different effects, it only makes sense to compare the distributions within different concentrations.
.
Figure 16. Gaussian Filter on HCN4 immunofluorescent image (for control group)
Figure 17. Noise Filter on HCN4 immunofluorescent image (for control group)
Figure 18. Object Identification Filter on HCN4 immunofluorescent image (for control group)
The above Fig. 16, 17, and 18 are examples of the images obtained after each filter in the control group. This was done in all experimental conditions (more figures provided in appendix). Data values from CellProfiler are summarized in Table 1.
Condition Number of HCN4 Object Identified Mean Integrated Intensity of Overlap with CX43 Mean Standard Deviation of Intensity Overlap Percentage Change in Integrated Intensity (compared to control) Control 28 24.60 0.023 - 0.1 µM PMA 1 h 53 123.4 0.031 401.6% increase 0.1 µM PMA 24 h 44 30.78 0.032 25.1% increase 1 µM PMA 1 h 45 8.14 0.009 66.9% decrease 1 µM PMA 24 h 84 36.61 0.024 48.8% increase
Table 1. CellProfiler results for each experimental condition.Using an HCN4 object identification filter, we measured the intensity of Cx43 that overlaps within these HCN4 objects and calculated the mean integrated intensity of the overlap and its mean standard deviation. Finally, in order to compare the results of experimental groups versus control we calculated the percentage change in integrated intensity.
The protocol of differentiation used in this study have been shown to create an important percentage of derived cardiomyocytes. However, not much is known about the spatial characteristics of the differentiated cultures. To check whether the final differentiated cultures were consisting of a flat monolayer, z-stack volumes were acquired and analyzed. An example of labeled region of a culture in CTL is shown in Fig.19A showing that the culture consists of multiple layers of cells as seen on the z cross-sections (top and right of the panel) with a
percentage of the volume expressing actinin thus corresponding to derived cardiomyocytes. Not only the culture has multiple layers of cells but the thickness (thus the number of layers) varies within the sample as shown by spatial heterogeneity of Δz(x,y) in Fig.19B. Although there seems to have no differences between the groups thus pointing to no effect of PMA on thickness (as shown in Fig.19C), more samples and tiling acquisitions to increase the field of view of confocal volumes would help validate that result.
Figure 19: The differentiation protocol leads to samples with heterogeneous multilayer cells. A) Three-dimensional view of a confocal immuno-imaging volume in CTL with actinin labeling (red color) and DAPI labeling (blue color) for the nucleus. B) Thickness (∆z) as of function of position (x,y) of the sample based on the DAPI fluorescence of the image shown in panel A showing spatial heterogeneity. C) Maximum thickness (∆zmax, circles) and mean (bar height) of a set of acquired
z-stack volumes where no trend between groups can be determined. A note that there is only a single sample per group for the highest [PMA].
The heterogeneity in thickness seems to be reflected on the videomicroscopy data. An acquired image of a CTL sample is shown in Fig. 20A showing regions with different brightness. The images are obtained from the transmittance of the sample and, as such, a decrease brightness could reflect an increased path length, thus an increased thickness of the sample. To check if a correlation exists between the thickness of the sample and the presence of spontaneous activity, the image was separated in two groups of pixels: beating and non-beating regions. Beating regions of the sample calculated from the temporal signal energy (see Method for details) are highlighted in green in Fig. 20B. A total of 5 clusters of varying dimensions are found with asynchronized activity as depicted in Fig. 20C. Non-beating regions correspond to the pixels not included in the beating clusters (a negative mask of the cluster binary image). Histograms of the light intensity for the beating (red curve) and non-beating pixels (blue curve) are shown in Fig. 20D showing that a higher ratio of pixels within the beating clusters are found in regions with less light intensity (darker regions) on the image compared to non-beating pixels. Thus, based on the hypothesis of transmittance, it seems that beating clusters are found more in thicker regions of the sample. Calculating the ratio of pixels for beating (Rbeating) and non-beating (R
non-beating) with intensity in the interval 15-50 a. u. for CTL and PMA samples at 24 h is significantly
higher for Rbeating than Rnon-beating (the difference Rbeating - Rnon-beating is presented as circles in Fig.
Figure 20: A) Snapshot of a single frame taken from acquisition of a CTL sample (widefield) showing heterogeneity in brightness with a central darker region. B) Superimposed clusters (6 non-connecting clusters) with spontaneous activity. C) Temporal variation in the composite signal for each cluster where white corresponds to resting activity and each set of double lines corresponds to a contracting activity (first line being the contraction followed by a second for the relaxation). A clear asynchronized activity between clusters is depicted. D) Separating the pixels in the images into a beating vs. non-beating groups where the beating groups corresponds to the pixels in the 6 clusters. A clear difference between the light intensity of the beating vs. non-beating regions is found with a higher ratio of pixels at low intensity (darker regions) for the beating groups. E) At 24 h, samples in both CTL and 1 µM PMA groups showed a higher ratio for beating vs. non-beating regions (circles, Rbeating-Rnon-beating > 0, paired t-test, p < 0.05 for each
4. Discussion and Conclusion
The aim of our study is to look at the effect of PMA on spontaneously beating rates of stem cell-derived cardiomyocytes and into the relationship between the pacemaking activity with HCN4 and Cx43 cell distribution. The first experiment looked at the effect of 1 µM of PMA versus control was a follow-up from a previous student at Dr. Philippe Comtois’ lab [61] using neonatal rat cardiomyocytes in monolayers. The two studies are opposite results: my data exhibit a decrease of pacemaking activity using 1 µM of PMA (increase in period of spontaneous activity) while results with neonatal cardiomyocytes show the opposite.
The experiments, however, have two distinctions: my experiment used mouse embryonic stem cells derived cardiomyocytes with 1 µM PMA introduced for 48h whereas he used 1 µM of PMA on neonatal rat cardiomyocyte for only 24 h. These two distinctions could undeniably play a role in conflicting results. The first distinction addresses the difference of species used. The utility of murine model has contributed to increase our knowledge in cardiopathology and both rat and mice models have been extensively used in biomedical research [62]. Despite the closeness between the two species, there are residing underlying differences within their embryonic development [62]. For instance, when comparing the development potential of rat embryos to mice embryo they performed very differently. PMA has also been shown to effect cardiac function differently from species to species. In rat cardiomyocytes PMA-induced PKC leads to L-type calcium current activation [63] while in guinea pig ventricular cells these L-type calcium currents are inhibited [64]. For this reason, it is interesting to compare cells from various species to understand the underlying mechanism in mammalian development.
As for the second distinction, the contrast in results between the two experiments may be due to the increased chronic exposure of PMA on the cardiomyocytes. Chronic (24 and 48- h) regulation of PKC was quantified using 0.1 µM PMA [65]. The PMA-induced activation resulted in a loss of PKC activity and led to calcium/lipid-independent kinase activity [65] producing a negative inotropic and chronotropic effect [66]. This led to my experiment to look more into the outcome of concentration in acute versus chronic effect. The results seem to correlate with the literature review. Although I have chosen the acute timeframe to be 1h of PMA exposure, it appears that at 5 mins of PMA exposure was enough to activate PKC. Chronic
activation of PMA led to the downregulation of PKC compared to the control group at 20-60 minutes of exposure [67]. It appears that at 1h of 0.1 µM PMA exposure led to the start of dose- dependent PKC downregulation [67]. PMA has been found to induce hypertrophic gene expression as well directly contributing to calcium ion dysfunction in cardiac hypertrophy [68,69]. It has also been found that transient activation of PKC can lead to long-term damaging effects on cardiac function through modifications in the actin cytoskeleton, T-tubule remodeling and in calcium ion handling dysfunction; 30 minutes of PKC activation led to an elevation of PKC activity which later decreased to baseline 24 hours and resulted in a severe disruption of T-tubule structure. Therefore, it would be safe to assume that a longer exposure to phorbol ester would create a greater damage on cardiomyocytes.
PMA seems to also play a role in energy metabolism in cardiac cells. A concentration of 1 nM of PMA was enough to cause a sharp decrease in cardiac function in terms of aortic flow rate (AFR) and coronary flow rates (CFR) due to the stimulation of PKC leading to Na+/H+ exchange activation and PKC dependent calcium channel phosphorylation, which both lead to an elevation of intracellular Ca2+ ion to a toxic level [69].
When comparing the distribution of HCN4 and Cx43 within the different experimental groups, we observe the greatest increase in HCN4 and Cx43 overlap within the 0.1 µM PMA of 1h exposure while the 0.1 µM PMA at 24 h exposure was the lowest (as shown in Table 1). This coincides with the increase in spontaneous activity observed within these cells in times between 1h and 24 h post-PMA introduction (as shown in Fig. 11). It was previously shown that PMA can induce the expression of Cx43 [70]. This ultimately leads to an increase in Cx43 expression, which appears to increase intercellular coupling and consequently myocyte excitability [71]. The results within the other experimental groups more-or-less agree with the videomicroscopy; The 1 µM PMA of 1h of exposure was the only group that showed a decrease in HCN4-Cx43 overlapping while the other two experimental groups (0.1 µM of PMA of 24 h and 1 µM of PMA of 24 h) exhibited nearly similar results. While the longer PMA exposure in both concentration at 24 h of PMA exposure may explain the similarity in HCN4-Cx43 overlapping results, the justification for decrease in overlapping found in the condition 1 µM PMA for 1h is unclear. However, it was demonstrated that PMA reduce the T channel activity through a PKC-mediated shift of the channel activation curve (to more positive values) [72]. Inhibition of low threshold calcium channels by angiotensin II in adrenal glomerulosa cells
through activation of protein kinase [72] which may be a viable explanation. It is also important to note that in all experimental conditions the number of HCN4 identification increased. This support the association between PMA introduction and HCN4 surface expression. It was suggested that HCN4 protein channels are sorted into recycling endosomes in the endoplasmic reticulum to support and respond to external stimuli and phospholipase D (PLD) activity stimulation by PMA induced PKC activation significantly increased surface expression of HCN4, which suggests that HCN surface expression is under the regulatory control of PLD activity [73]. This indicates that while PKC-overstimulation may have an inhibitory effect in pacemaking activity, this is not done by the downregulation of HCN4 expression.
On the account of confocal imaging we show that the embryonic stem cell derived cardiomyocytes did not form a monolayer and varied in thickness within the samples. The maximum thickness was plotted per group and it appears that the difference in thickness correlates with a difference in activity with spontaneous activity occurring in darker regions in videomicroscopy (lower intensity of light thus thicker). A possible explanation for such behavior could be due to electromechanical coupling, where the collective interplay between the different ion channels allows the generation of spontaneous activity [74]. However, there was no difference between the CTL group and 1 µM PMA at 24h and we were short of immuno- images to analyze for further validation.
Lastly it is important to consider possible factors that may have affected our results. Although a fair amount of embryonic stem cells has successfully differentiated into cardiomyocytes, not all the cells were differentiated into spontaneously beating cells, but rather into quiescent myocardial cells and other cell types. That being the case, we identify the pacing cells using HCN4, as it was proposed as an appropriate tool to locate pacemaker cell [75]. Nonetheless the development of these other cell types may have exerted some effect or secreted different factors that have impacted our results. In addition, the pacing cardiomyocytes formed in clusters, not in a uniform tissue as one would assume. This could also contribute to the results, since it was suggested that more confluent tissue could lead to a more pacemaking activity [76]. Our results demonstrate the complexity in understanding the molecular mechanisms underlying the pacemaker activity of cardiomyocytes. It is likely that multiple pathways play a separate but interdependent role in developing and maintaining the coherence of the pacing
cardiomyocytes within the SA node. However, getting more of an understanding of the interplay between these mechanisms is essential in the development of biological pacemakers.
![Figure 3. Connexin topology. a) The connexion topology within the lipid bilayer b) illustrates the subclasses and the oligomerization of connexins into homomeric or heteromeric hexamers with other connexins [13]](https://thumb-eu.123doks.com/thumbv2/123doknet/2036701.4495/19.918.121.823.478.801/connexin-connexion-illustrates-subclasses-oligomerization-homomeric-heteromeric-connexins.webp)
![Figure 4. Structure of PMA (the active phorbol is also referred to as tetradecanoyl phorbol-13-acetate (TPA)) [32]](https://thumb-eu.123doks.com/thumbv2/123doknet/2036701.4495/25.918.338.579.247.487/figure-structure-active-phorbol-referred-tetradecanoyl-phorbol-acetate.webp)