O
pen
A
rchive
T
OULOUSE
A
rchive
O
uverte (
OATAO
)
OATAO is an open access repository that collects the work of Toulouse researchers and
makes it freely available over the web where possible.
This is an author-deposited version published in :
http://oatao.univ-toulouse.fr/
Eprints ID : 4698
To link to this article : DOI :10.1016/j.clay.2010.02.004
URL : http://dx.doi.org/10.1016/j.clay.2010.02.004
To cite this version :
Bouna, L. and Rhouta, B. and Amjoud, M. and Jada, A. and Maury,
F. and Daoudid, L. and Senocq, François ( 2010)Correlation
between eletrokinetic mobility and ionic dyes adsorption of
Moroccan stevensite. Applied Clay Science, vol. 48 (n° 3). pp.
527-530. ISSN 0169-1317
Any correspondance concerning this service should be sent to the repository
administrator: [email protected]
.
Correlation between eletrokinetic mobility and ionic dyes adsorption of
Moroccan stevensite
L. Bouna
a,b,c, B. Rhouta
a, M. Amjoud
a, A. Jada
c,⁎
, F. Maury
b, L. Daoudi
d, F. Senocq
b aLaboratoire de Matière Condensée et Nanostructures (LMCN), Faculté des Sciences et Techniques Guéliz, BP 549, Marrakech, Morocco bCIRIMAT; CNRS-UPS-INP, ENSIACET, 118 Route de Narbonne, 31077 Toulouse, France
c
Institut de Sciences des Matériaux de Mulhouse IS2M LRC 7228— CNRS 15 rue jean Starcky BP 2488, 68057 Mulhouse Cedex, France
d
Laboratoire de Géosciences et Géoenvironnement, Faculté des Sciences et Techniques, Guéliz, BP 549, Marrakech, Morocco
a b s t r a c t
Keywords: Stevensite Dyes Electrophoretic mobility AdsorptionThis study aims at establishing a correlation between the electrical charge of Moroccan stevensite particles and ionic dyes adsorption. The electrophoretic mobility, (Ue), of the stevensite particles in water, was measured at pH 2.5–12 by microelectrophoresis. At pH between 2.5 and 8, Ueremained constant (Ue=−1.610− 8m2/(V s)), as resulting from the permanent charge of the clay mineral planar surfaces. At pHN8, the magnitude of electrophoretic mobility increased (Ue=−2.710− 8m2/(V s)) due to the deprotonation of silanol groups on the surfaces. The anionic Orange G adsorption at the clay mineral–water interface was negligible whereas the methylene blue cations were strongly adsorbed due to the electrostatic attraction.
1. Introduction
The use of dyes is widespread in many industrial activities such as textiles preparation, pulp mills, leather, printing, food, and plastic production. Many of dyestuffs are harmful to humans and toxic to microorganisms. Therefore, treatment of dye wastewaters, before their discharge into receiving natural media, is needed and has received great interest over the past decades. Adsorption on solids has
been proven as an economical and efficient technique. Activated
carbon is widely used due to its high adsorption capacity for organic compounds. Nevertheless, due to its high cost and the difficulty of regeneration, there is a need for cheaper alternative adsorbents. Clay minerals, especially the smectite family, have received considerable attention owing to their physicochemical properties (Bergaya et al., 2006). The surface charges of smectites depend on the ionic strength and the pH of the aqueous medium, and the variation of these two parameters will in turn affect the adsorption of organic dyes (Sondi et al., 1996; Thomas et al., 1999; Czimerova et al., 2004; Ma et al., 2004; Echeverria et al., 2005; Tsuchida et al., 2005; Gürses et al., 2006; Hajjaji et al., 2006; Kosmulski, and Dahlsten, 2006; Weng and Pan, 2007).
The present paper deals with the study of the electrophoretic mobility as a function of pH of trioctahedral Mg-rich stevensite from Jbel Rhassoul clay (Morocco), and the adsorption of cationic methylene blue
(MB) and anionic Orange G (OG), two model pollutants frequently used, for instance in photocatalysis tests (Sarantopoulos et al., 2009). 2. Experimental
2.1. Materials
Homoionic sodium stevensite (labelled Na-stevensite), having particle sizesb2 μm, was isolated and characterized from Moroccan Rhassoul clay according to procedure described elsewhere (Rhouta et al., 2008). Methylene blue (MB) and Orange G (OG) were purchased from Aldrich.
2.2. BET surface area measurements
Nitrogen adsorption isotherms at 77°K were determined by using an ASAP 2020 V 3.01 H Adsorption Analyser from Micromeritics. Prior to the N2adsorption–desorption measurements, the Na-stevensite
sample weighing 0.162 g, was out gassed at T = 150 °C during 24 h.
The specific surface area was determined by the well-known
Brunauer–Emmett–Teller (BET) method (Rouquerol et al., 1998;
Gregg and Sing, 1982).
2.3. Titration of stevensite surface charge and PCD measurements The Na-stevensite surface charge was evaluated by titration of the clay mineral particles with aqueous MB solution at the original pH, i.e. without adding any amounts of hydrochloric acid or sodium
⁎ Corresponding author. Tel.: +33 3 89608709; fax: +33 3 89608799. E-mail address:[email protected](A. Jada).
hydroxide. The procedure and the device (Particle Charge Detector, PCD, Müteck instrument), used for such titration were similar as described elsewhere (Jada et al., 2006). The measuring cell is composed of a cylindrical poly (tetrafluoroethylene) (PTFE) container with a PTFE piston inside. The titratable aqueous clay mineral
dispersion (10 ml) wasfilled into the gap (0, 5 mm) between the
container wall and the piston, and various amounts of the MB aqueous solution were added. The resulting streaming induced potential (SIP) was measured between two gold electrodes located at the top and the bottom of the gap.
2.4. Microelectrophoresis
For the microelectrophoresis measurements, the dispersions were
shaken for a few minutes and thefinal pH was either original or
adjusted at 2.5–12, by adding small amounts of hydrochloric acid or sodium hydroxide solutions. The electrophoretic mobility was measured at ambient temperature using the Zetaphoremeter II model Z3000 (Jada and Ait Chaou, 2003). These measurements were performed in the absence of electrolytes, since the present study did not deal with the salt effect on electrophoretic mobility of the clay mineral particles, but rather with the pH effect. The Zetaphoremeter used in the present work allows the measurement of electrical conductivity of the aqueous dispersions, and the calculation of the electrical double layer (EDL) thickness. The pH effect on the electrophoretic mobility of the clay mineral particles was studied by adjusting the dispersion to the desired pH value. The initial pH was 7.5 ± 0.1.
2.5. Adsorption experiments
Adsorption experiments were carried out in a batch reactor by mixing 25 mg of Na-stevensite in 25 ml of distilled water, and by stirring the dispersion for 2 h. To this dispersion 0.5 ml of MB or OG solutions (10− 3M) were added so that thefinal concentration of the dyes wasfixed to 10− 5M. For studying the pH effect on the dye
adsorption, the procedure was similar to that described above in microelectrophoresis measurements. All adsorption experiments were performed at 25 °C. To determine the non-adsorbed amount of dye, aliquots were taken from the mixture at regular time intervals and centrifuged at 12,500 rpm for 5 min. The dye concentration in the supernatant was obtained from linear calibration curves representing the absorbance of the 664 nm and 480 nm bands versus MB and OG concentrations (UV–Vis–NIR Perking Elmer spectrophotometer). 3. Results and discussion
3.1. Nitrogen adsorption–desorption isotherms
The adsorption–desorption isotherm of nitrogen on Na-stevensite (Fig. 1) was of type IV, with a hysteresis loop of type H4, indicating the presence of both micro- and mesopores. The BET equation was applied for the relative pressure range 0.02≤p/p0≤0.33. The specific
surface area of the stevensite was 150 m2/g.
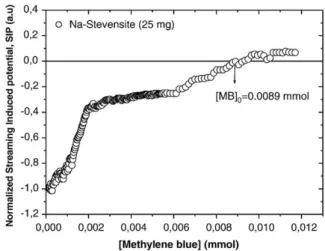
3.2. Specific surface area and surface charge of Na-stevensite by titration with MB
The surface area of Na-stevensite was also determined from the titration curve of stevensite with MB (Fig. 2). The point of zero charge, PZC, was found at 0.0089 mmol MB added. This corresponded to a specific surface area of 279 m2/g taking into account the surface area
of one methylene blue cation (aMB= 130 Å2). As expected, this area
was considerably larger than the specific BET surface area due to the intercalation of the MB cations into the stevensite.
3.3. Electrophoretic mobility
Without adding to the stevensite dispersions hydrochloric acid or sodium hydroxide solution, the electrophoretic mobility was Ue=
−1.610− 8m2V− 1s− 1. The electrophoretic mobility, U
e, of clay
min-erals is determined by the relative proportions of planar and edges surfaces that are exposed to the aqueous solution (Thomas et al., 1999).Mermut and Lagaly (2001)reported that the edge charge of smectite particles is generally between 10 and 30% and on average it is ≈20% of the total CEC. The edge charges represent only around 5% of the total charge for the Na-stevensite (Rhouta et al., 2008).
The variation of Uewith pH is plotted as shown inFig. 3.
Na-stevensite particles remained negatively charged in the pH range between 2.5 and 12. From pH = 2.5 up to pH = 7.5 (zone 1), the negative values of Ue were constant (−1.6 10− 8m2V− 1s− 1).
Between pH = 7.5 and pH = 10.5 (zone 2), the magnitude of Ue
increased from−1.610− 8m2V− 1s− 1to−2.710-8m2V− 1s− 1, U e
remained constant at pH 10.5–12 (zone 3). These results were
different from those reported recently by Gürses et al. (2006)
concerning a mixture of Turkish smectites (montmorillonite and nontronite). In that case, the variation of Ue as a function of pH
exhibited two IEP. Nevertheless, our results were consistent with those reported in literature for montmorillonite (Sondi et al., 1996; Thomas et al., 1999), showing that the silicate charges remained negative at all pH values. The Uevalues at pH 2.5–7.5 indicated the
predominance of the permanent charges. The increase of the magnitude of the mobility at higher pH is due to the deprotonation
Fig. 1. Adsorption–desorption isotherms of N2on Na-stevensite.
Fig. 2. Variation of the streaming induced potential with methylene blue, MB, concentration for Na-stevensite particles in aqueous dispersions.
of the silanol groups at the edges of the stevensite particles, because aluminol surface groups are absent (Leroy and Revil, 2004). Beyond pH = 10.5 the mobility Ue levelling out at −2.710− 8m2V− 1s− 1
indicated the total ionization of all edge silanol groups of the clay mineral particle.
3.4. Adsorption of MB and OG dyes
The absorption spectra of Orange G remained unchanged at all contact times indicating that OG was not adsorbed by stevensite due to repulsive forces between the negatively charged stevensite layers and the anionic dye. In contrast, the absorption spectra of MB, (Fig. 4), revealed that almost all initial MB amounts were retained by the stevensite particles due to the electrostatic interactions between the positive MB species and the negatively charged sites of the stevensite
layers (Rhouta et al., 2008). This high MB uptake was in good
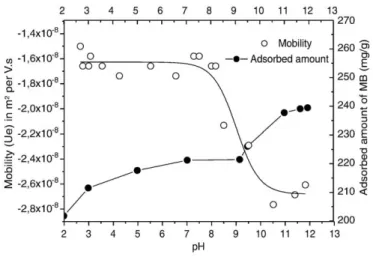
agreement with the electrophoretic mobility data (Fig. 5). At pH 2–9,
the maximum amount of MB adsorbed was about 220 mg/g. At pHN9,
the amount of MB adsorbed increased to 240 mg/g at pH = 11, due to deprotonation of the silanol groups on the edge sites of the clay mineral particles as evidenced by the microelectrophoresis data. 4. Conclusions
A strong correlation was established between the adsorption of ionic dyes onto stevensite from Jbel Rhassoul clay and the nature of surface charge. At pH 2–12, stevensite particles are formed of negatively charged layers responsible via Coulombic attractions of the strong
retention of cationic methylene blue dye by contrast to the anionic Orange dye. Consequently, the highest MB adsorption (240 mg/g) was reached at pH = 12. The adsorption of the anionic dye Orange G was negligible.
Acknowledgments
The financial supports from the “Convention de cooperation
CNRST-Maroc/CNRS-France” (chemistry project no. 04/08), the
“Programme de Coopération Scientifique Interuniversitaire de l'Agence Universitaire de la Francophonie” (project no. 63 13PS826) and the“Programme d'Action Intégrée Volubilis” (project no. MA-08-185) are gratefully acknowledged.
References
Bergaya, F., Lagaly, G., Beneke, K., 2006. Handbook of clay science. In: Bergaya, F., Theng, B.K.G., Lagaly, G. (Eds.), Developments in Clay Science, vol. 1. Elsevier, Amsterdam. Czimerova, A., Jankovic, L., Bujdak, J., 2004. Effect of the exchangeable cations on the spectral properties of methylene blue in clay dispersions. Journal of Colloid and Interface Science 274, 126–132.
Echeverria, J.C., Zarranz, I., Estella, J., Garrido, J.J., 2005. Simultaneous effect of pH, temperature, ionic strength and initial concentration on the retention of lead on illite. Applied Clay Science 30, 103–115.
Gregg, S.J., Sing, K., 1982. Adsorption, Surface Area and Porosity. Academic Press, London.
Gürses, A., Dogar, Ç., Yalçin, M., Açikyildiz, M., Bayrak, R., Karaca, S., 2006. The adsorption kinetics of the cationic dye, methylene blue, onto clay. Journal of Hazardous Materials B 131, 217–228.
Hajjaji, M., Alami, A., El Bouadili, A., 2006. Removal of methylene blue from aqueous solution byfibrous clay minerals. Journal of Hazardous Materials B 135, 188–192. Jada, A., Ait Chaou, A., 2003. Surface properties of petroleum oil polar fraction as investigated by Zetametry and DRIFT spectroscopy. Journal of Petroleum Science and Engineering 39, 287–296.
Jada, A., Debih, H., Khodja, M., 2006. Montmorillonite surface properties modifications by asphaltenes adsorption. Journal of Petroleum Science and Engineering 52, 305–316.
Kosmulski, M., Dahlsten, P., 2006. High ionic strength electrokinetics of clay minerals. Colloid and surfaces A: Physico chem. Eng. Aspects 291, 212–218.
Leroy, P., Revil, A., 2004. A triple-layer model of the surface electrochemical properties of clay minerals. Journal of Colloid and Interface Science 270, 371–380. Ma, Y.L., Xu, Z.R., Guo, T., You, P., 2004. Adsorption of methylene blue on
Cu(II)-exchanged montmorillonite. Journal of Colloid and Interface Science 280, 283–288. Mermut, A.R., Lagaly, G., 2001. Baseline studies of the clay minerals society source clays: layer-charge determination and characteristics of those minerals containing 2:1 layers. Clays and Clay Minerals 49, 393–397.
Rhouta, B., Kaddami, H., Elbarqy, J., Amjoud, M., Daoudi, L., Maury, F., Senocq, F., Maazouz, A., Gerard, J.F., 2008. Elucidating the crystal-chemistry of Jbel Rhassoul stevensite (Morocco) by advanced analytical techniques. Clay minerals 43, 393–404.
Rouquerol, F., Rouquerol, J., Sing, K., 1998. Adsorption by Powders and Porous Solids— Principles, Methodology and Applications. Academic Press, London.
Sarantopoulos, C., Puzenat, E., Guillard, C., Herrmann, J.M., Gleizes, A.N., Maury, F., 2009. Microfibrous TiO2supported photocatalysts prepared by metal–organic chemical
Fig. 3. Variation of electrophoretic mobility of stevensite particles with pH of the aqueous dispersion.
Fig. 4. UV absorption spectra of methylene blue in the supernatant at various contact times.
Fig. 5. Na-Stevensite electrophoretic mobility of the stevensite particles and amounts of MB adsorbed.
vapor infiltration for indoor air and waste water purification. Applied Catalysis B: Environmental 91, 225–233.
Sondi, I., Biscan, J., Pravdic, V., 1996. Electrokinetic of pure clay minerals revisited. Journal of Colloid and Interface Science 178, 514–522.
Thomas, F., Michot, L.J., Vantelon, D., Montargès, E., Prélot, B., Cruchaudet, M., Delon, J.F., 1999. Layer charge and electrophoretic mobility of smectites. Colloids and Surfaces, A: Physicochemical and Engineering Aspects 159, 351–358.
Tsuchida, H., Ooi, S., Nakaishi, K., Adachi, Y., 2005. Effects of pH and ionic strength on electrokinetic properties of imogolite. Colloids and Surfaces A: Physicochemical and Engineering Aspects 265, 131–134.
Weng, C.H., Pan, Y.F., 2007. Adsorption of a cationic dye (methylene blue) onto spent activated clay. Journal of Hazardous Materials 144, 355–362.