Open Archive Toulouse Archive Ouverte (OATAO)
OATAO is an open access repository that collects the work of Toulouse researchers and makes it freely available over the web where possible.
This is an author -deposited version published in: http://oatao.univ-toulouse.fr/ Eprints ID: 2281
To link to this article: DOI: 10.1177/1099636209106070 URL:http://dx.doi.org/10.1177/1099636209106070
To cite this version: SHAHDIN Amir, MEZEIX Laurent, BOUVET Christophe, MORLIER Joseph, GOURINAT Yves. Fabrication and mechanical testing of a new sandwich structure with carbon fiber network core. Journal of Sandwich Structures and
Materials, 2010, vol.12 (n° 5). pp. 569-589. ISSN 1099-6362
Any correspondence concerning this service should be sent to the repository administrator:
Fabrication and Mechanical Testing of a New Sandwich
Structure with Carbon Fiber Network Core
Amir Shahdin1,*, Laurent Mezeix†, Christophe Bouvet§, Joseph Morlier* and Yves Gourinat*
* Université de Toulouse, ISAE/DMSM, Campus Supaero, 10 av. Edouard Belin BP54032, 31055 Toulouse, France
†
Université de Toulouse, INPT-ENSIACET/CIRIMAT, 118 route de Narbonne, 31077 Toulouse, France
§
Université de Toulouse, UPS/LGMT, Bat 3PN 118 route de Narbonne, 31062 Toulouse, France
1
Corresponding author Email: [email protected], Phone no: + (33) 5 61 33 83 86, Fax no: + (33) 5 61 33 83 30
ABSTRACT: The aim is the fabrication and mechanical testing of sandwich structures
including a new core material known as fiber network sandwich materials. As fabrication norms for such a material do not exist as such, so the primary goal is to reproduce successfully fiber network sandwich specimens. Enhanced vibration testing diagnoses the quality of the fabrication process. These sandwich materials possess low structural strength as proved by the static tests (compression, bending), but the vibration test results give high damping values, making the material suitable for vibro-acoustic applications where structural strength is of secondary importance e.g., internal panelling of a helicopter.
KEYWORDS: Sandwich Fiber Network Materials, Mechanical Testing, Vibration Testing,
Damping
BACKGROUND AND MOTIVATION
Characterization of fiber network sandwich materials both statically and dynamically presents a new challenge for the domain of mechanical testing. The determination of the sandwich material behavior under crushing loads and the measurements of the ductile fracture limits is normally done with the help of compression tests [1,2]. Typically, cores are the weakest part of sandwich structures and they fail due to shear. Understanding the shear strength properties of sandwich core plays an important role in the design of sandwich structures subjected to flexural loading [3,4]. Therefore, 3-point bending tests are often performed to find the flexural and shear rigidities of sandwich beams [5-7]. The vibration characteristics of sandwich materials have drawn much attention recently. The dynamic parameters of a structure i.e. natural frequency, damping and mode shapes are determined with the help of vibration testing which provides the basis for rapid inexpensive dynamic characterization of composite structures [8]. D.J Ewins [9] gave a detailed overview of the
vibration based methods. A wide amount of literature is present related to vibration testing of composite sandwich structures [10-16]. The equations that explain the dynamic behavior of sandwich beams are described extensively in the literature and notably in the references [17,18].
The importance of material damping in the design process has increased in recent years as the control of noise and vibration in high precision, high performance structures and machines has become more of a concern. At the same time, composites sandwich researchers have focused more attention on damping as a design variable [19,20]. One way of increasing damping in sandwich materials is by putting a viscoelastic layer as core between the two laminates [21,22]. Jueng and Aref reported that sandwich structures with combined honeycomb-foam cores have higher damping than those with individual honeycomb or solid viscoelastic cores [23].
These advancements have led to the need for developing materials possessing better damping characteristics. New materials like fiber network materials can be used as potential dampers and sound absorbers in specific applications like the inner paneling of a helicopter, where structural strength is not the primary requirement. Fiber network materials are made from natural materials (wool, cotton etc) as well as artificial ones (carbon, steel, glass etc) and are quickly becoming of widespread use as sound absorbers [24]. Bonded metal fibers network materials offer advantages for use as heat exchanger [25] or insulation [26]. These materials possess low relative density, high porosity and are cost-effective. Sandwich structures normally consist of two thin skins separated by a thick core. Traditional core materials are usually honeycomb, foam or balsa. Recently, a novel type of sandwich has been developed with bonded metallic fibers as core material [27-31]. This material presents attractive combination of properties like high specific stiffness, good damping capacity and energy absorption. Fiber network materials with carbon fibers have been also studied for using as core material [32]. Entangled cross-linked carbon fibers present many advantages as core materials i.e., open porosity, multifunctional material or the possibility to reeve electric or control cables on core material. L. Mezeix et al. studied the mechanical behavior of fiber network materials in compression [33]. Mechanical testing has also been carried out on specimens made of wood fibers [34], glass fibers [35] and various matted fibers [36]. There are also some works in the literature related to 3D modeling of wood based fibrous networks based on X-ray tomography and image analysis [37]. Although few works can be found in the scientific literature devoted to the mechanical testing of sandwich fiber network materials, and
in fact no scientific literature can be found related to the vibration testing of sandwich fiber network materials or even simple fiber network materials.
Therefore, the main motivation of this work is to develop a process in order to fabricate sandwich fiber network specimens, and to test them both statically (compression and bending tests) and dynamically (vibration test). Vibration testing is used to diagnose the quality of the fabrication process and to verify the potential damping capabilities of these sandwich specimens.
MATERIALS AND FABRICATION PROCESS
Core Materials
The core of the sandwich test specimens used in this article consists of carbon fibers that are made of a yarn of standard carbon filaments. The specifications and materials properties are presented in Table 1. The fibers are provided by the company Toho-Tenax. For the cross-linking of carbon fibers, epoxy resin is used. The epoxy resin SR 8100 and injection hardener SD 8824 are used provided by SICOMIN. All the test specimens presented in the article are carefully weighed using METTLER balance. A better vaporization is achieved if the resin is heated up to 35°C before being sprayed on the carbon fibers. This allows the mixture of resin and hardener to become less viscous.
Skin Materials
Resin-containing carbon-fiber/epoxy prepreg of T700/M21 is used to fabricate the skin materials. The material is supplied by Hexcel composites, the physical properties are set out in Table 1. The skin materials are made of unidirectional pre-impregnated plies of type T700/M21 [38]. The upper and lower skins consist of four plies each with a stacking sequence of [0/90/90/0] [39]. The skin properties can be further viewed in Table 1.
Table 1. Core and skin properties of the sandwich fiber network material Core Properties
Type of Fibers HTS-5631 Elastic Modulus 240 GPa Length of Fibers 10mm Diameter of Fibers 7µm
Skin Properties
Type T700/M21 No of Plies in the Upper Skin 4 Stacking Sequence [0/90/90/0] No of Plies in the Lower Skin 4 Thickness of Ply 0.125mm Thickness of Upper Skin 0.5mm Density of Laminate 1580 kg/m3 Thickness of Lower Skin 0.5mm
Fabrication Process
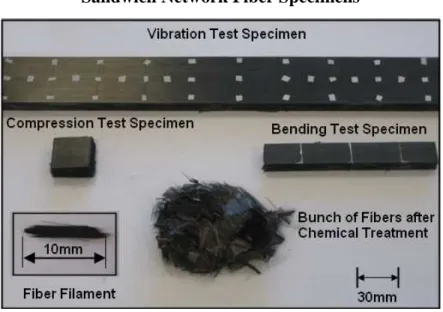
The fabrication of fiber network specimens is often a tedious and complex process. As these types of materials are still mostly in the research phase, so as such standard fabrication processes do not exist. The fabrication procedure used in this article is the one developed by Mezeix et al. [33]. Objective of this fabrication process is to ensure that these test specimens can be successfully reproduced with a relative efficiency, having the same composition. For this purpose, vibration testing is used to diagnose the quality of the fabrication process. The three types of test specimens used in this article are shown in Figure 1 and their specifications are provided in Table 2.
Sandwich Network Fiber Specimens
For the test specimens used in this article, approximately 900 g of fibers of 10mm length are cut manually. The carbon fibers are then treated in a solution of dichloromethane for 24 hours and are then cleaned for 2 hours in methanol. A cut fiber filament along with a bunch of fibers after chemical treatment is shown in Figure 1. These uncoated carbon fibers are then separated by a blast of compressed air. The mixture of resin and hardener is then sprayed on the separated carbon fibers by a spray paint gun. In case of larger test specimens, the volume of carbon fibers is large, so with the current technology it is not easy to spray the resin equally on the carbon fibers. Therefore, sandwich test specimens fabricated from the same mold differ a little in weight due to the inhomogeneous distribution of the manually sprayed resin (Table 4). The fibers vaporized by the resin are then placed in the mold between the two skins of unidirectional composites. In order to polymerize the fiber network sandwich specimens, the mold is then heated in an oven up to 180°C for two hours in a press [38].
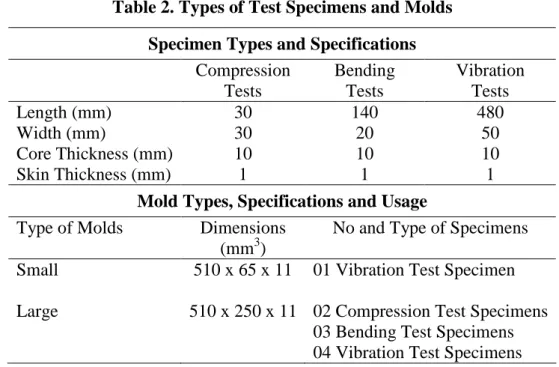
Table 2. Types of Test Specimens and Molds Specimen Types and Specifications
Compression Tests Bending Tests Vibration Tests Length (mm) 30 140 480 Width (mm) 30 20 50 Core Thickness (mm) 10 10 10 Skin Thickness (mm) 1 1 1
Mold Types, Specifications and Usage
Type of Molds Dimensions (mm3)
No and Type of Specimens
Small 510 x 65 x 11 01 Vibration Test Specimen
Large 510 x 250 x 11 02 Compression Test Specimens 03 Bending Test Specimens 04 Vibration Test Specimens
First the small mold is used to fabricate a single vibration test specimen with a fiber core density of 100 kg/m3. This specimen showed that 100 kg/m3 fiber core density is relatively insufficient for a volume of 480 x 50 x 10 mm3, as there are places in the core of the sandwich beam that lack sufficient quantity of fibers. So for the next vibration test specimen, a fiber core density of 150 kg/m3 is chosen. As compared to the previous specimen (fiber core density of 100 kg/m3), the specimen with 150 kg/m3 fiber core density has a far better fiber distribution. Finally a vibration test specimen with a fiber core density of 200 kg/m3 is fabricated by using the same small mold. It is seen that a fiber density of 200 kg/m3 for the core is on the higher side and it is not possible to close the mold properly. So for the fabrication of the next batch of specimens, a fiber core density of 150 kg/m3 is chosen. The
composition of the vibration test specimen having a fiber core density of 150 kg/m3 fabricated from the small mold is presented in Table 3.
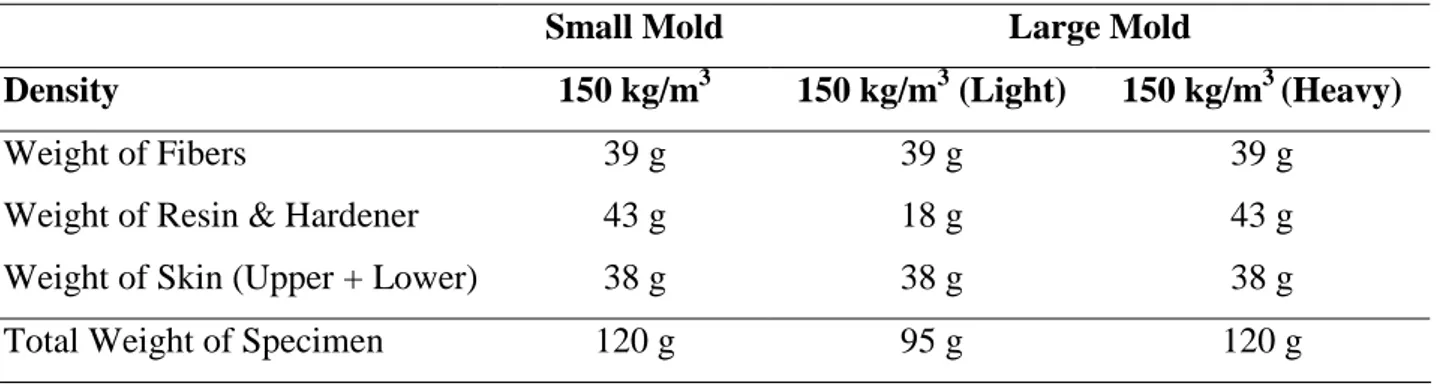
Table 3. Composition of vibration test specimens having fiber core density of 150 kg/m3 fabricated from the small and large mold
Small Mold Large Mold
Density 150 kg/m3 150 kg/m3 (Light) 150 kg/m3 (Heavy)
Weight of Fibers 39 g 39 g 39 g
Weight of Resin & Hardener 43 g 18 g 43 g Weight of Skin (Upper + Lower) 38 g 38 g 38 g Total Weight of Specimen 120 g 95 g 120 g
In the next step a large mold is used to produce multiple test specimens. The aim of using the large mold is to produce multiple test specimens possessing the same characteristics. The fiber core density is kept 150 kg/m3 as discussed previously. The specifications, the quantity and the types of test specimens that can be extracted from the large mold are mentioned in Table 2. First the large mold is used to fabricate test specimens having the same composition as that of the single vibration test specimen fabricated from the small mold. These four vibration test specimens fabricated from the large mold are referred to as heavy specimens in the article. The average composition of the four heavy vibration test specimens is presented in Table 3. Next, the same large mold is used to produce relatively lighter specimens. They have approximately 25 g less mixture of resin and hardener than the previously produced heavier specimens. These specimens shall be referred to as light specimens in future discussions (Table 3). The ratio of the mixture of resin and hardener in the heavy specimens is approximately 2.5 times more than that of the light specimens. The weight comparison of the vibration test specimens fabricated from the small and large mold is presented in Table 4. The difference in weights observed between the specimens is due to the uneven distribution of the manually sprayed resin.
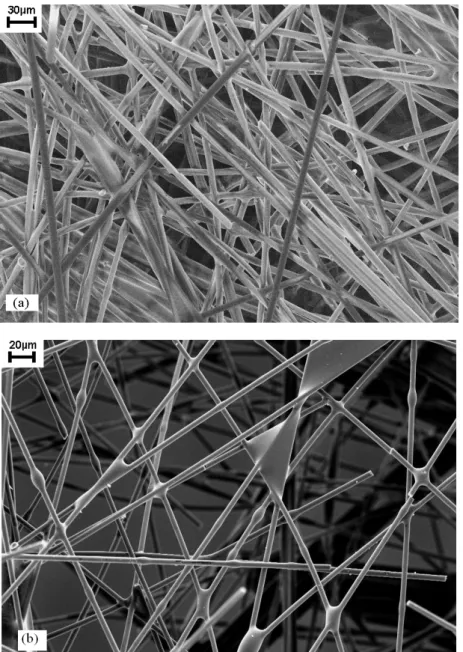
The difference in resin between the heavy and light specimens can also be observed with the help of a scanning electron microscope (SEM). Figure 2 shows SEM observations on heavy and light specimens. In case of the heavy specimen (Figure 2a), the resin can be seen all along the length of the fibers and is seldom in the form of droplets. On the other hand, for the light specimen (Figure 2b), droplets of resin can be seen at the fiber joints but the presence of resin along the fiber lengths is negligible.
Scanning Electron Microscope (SEM) Tests
Figure 2 SEM observations (a) heavy specimen (b) light specimen
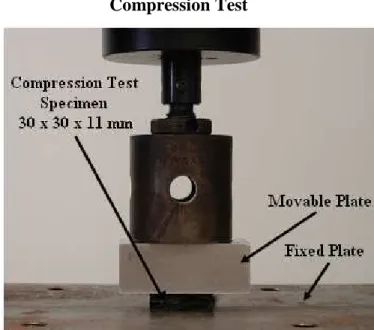
EXPERIMENTAL PROCEDURE Compression Tests
The quasi-static compressive response of the sandwich fiber network test specimens are measured in 100 kN Instron machine. The aim is to calculate the elastic modulus. Both light and heavy compression test specimens are tested. The specimen size chosen for the compression tests is 30 x 30 x 11 mm. The test specimens are placed between the moveable and the fixed plate as shown in Figure 3. The displacement of the machine is used to measure the displacement of the test-specimen. As the entangled materials are not very rigid, therefore a relatively small force is applied to compress the entangled sandwich materials. As the force is small, so it is safe to assume that the displacement of the machine is same as the
displacement of the specimen. The applied velocity of vo = 2 mm/min corresponds to a
nominal strain rate of ε& = 3x10⁻³/s at the beginning of the test. The maximum applied load is 20 kN corresponding to 22.2 MPa. To analyze the experimental results, the following definitions for the true strain and stress are used.
Strain, = o h h ln
ε
(1) Stress, S F = σ (2)where h is the height during compression, ho is the initial height of the sample, S is the area
during compression. So is the initial area and F is the applied force. In our case, the area S
varies very little during the compression tests, so it is assumed that S = So. No lateral
displacement of the test-specimen is observed during the compression tests and the section remains constant. So it can be concluded that there are no barreling effects.
Compression Test
Figure 3 Test Specimen between the fixed and moveable plate during compression test
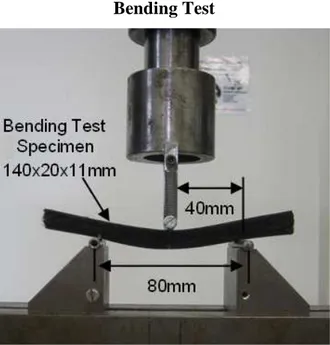
Bending Tests
In order to measure the shear modulus of the test specimens, three point bending tests are carried out on the heavy and light bending test specimens on a 10 kN Instron machine. As discussed previously, these specimens are fabricated from the large mold and have 150 kg/m3 fiber core density. The dimensions of these test specimens are 140 x 20 x 11 mm and the distance between the two supports is 80 mm, the choice of which is based on the three-point bending tests carried out in detail in reference [39]. The applied velocity is vo = 1 mm/min
having a diameter of 6 mm which is not less than one half the core thickness (5 mm) and not greater than 1.5 times the sandwich thickness as per ASTM standards [7]. The three point bending test is shown in Figure 4.
Bending Test
Figure 4 Test specimen between the three supports during 3 point bending test
For the analysis of a sandwich beam under three-point bending, consider a sandwich beam of width b and length l, comprising of two identical face sheets of thickness tf and core
of thickness tc. Also h is the spacing of the mid plane of the face sheets (h = tc + tf), as shown
in Figure 5.
Schematic of a Sandwich Beam under Three-Point Bending Test
Figure 5 Schematic of a sandwich beam under three point bending showing geometrical
The load P is applied at the centre of the beam. The maximum deflection of the beam is due to both flexural and shear deformations. The shear deformation is dominant in the core and hence, the approximate expression for the elastic deflection can be expressed as:
Maximum deflection, S S Pl D Pl 4 48 3 + =
δ
(3)The bending stiffness D and the shear stiffness SS are given by
Bending Stiffness, 2 2 h h t E D= s s (4) Shear Stiffness, SS =bhGC (5)
where Es is the elastic modulus of the skins and Gc is the shear modulus of the core. The
maximum deflection δ is calculated experimentally by the three-point bending test, the only unknown is the shear modulus Gc which is calculated by putting Equation (5) in Equation (3).
Equations (3-5) are only valid for the beginning of the bending tests when the deflections are relatively small.
Vibration Tests
The experimental equipment used to obtain the vibration test results discussed in this paper is shown in Figure 6. The experimental set-up is that of a free-free beam excited at its center, based on Oberst method [40]. The Oberst method states that a free-free beam excited at its center has the same dynamical behavior as that of a half length cantilever beam. The test specimen is placed at its center on a B&K force sensor (type 8200) which is then assembled on a shaker supplied by Prodera having a maximum force of 100 N. A fixation system is used to place the test specimens on the force sensor. The fixation is glued to the test specimens with a HBM X60 rapid adhesive. The response displacements are measured with the help of a non-contact and high precision Laser Vibrometer OFV-505 provided by Polytec. The shaker, force sensor and the laser vibrometer are manipulated with the help of a data acquisition system supplied by LMS Test Lab.
Experimental Set-up for Vibration Tests
Figure 6 Diagram of the experimental set-up
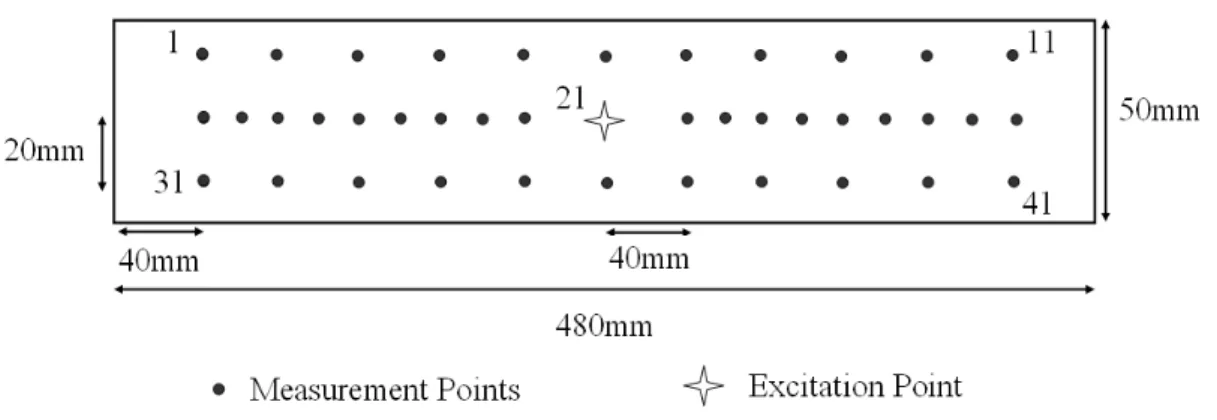
The center of the test specimens is excited at Point 21 as shown in Figure 7. Burst random excitation is used which is a broadband type excitation signal (0-2650 Hz). The signal is averaged 10 times for each measurement point. Hanning windows are used for both the output and the input signals. The linearity is checked and a high frequency resolution (∆f = 0.25Hz) for precise modal parameter estimation is used. Response is measured at 41 points that are symmetrically spaced in three rows along the length of the beam. The modal parameters are extracted by a frequency domain parameter estimation method (Polymax) integrated in the data acquisition system. Polymax is a further evolution of the least-squares complex frequency-domain (LSCF) estimation method.
Vibration Test Specimen
Figure 7 Vibration test specimen specifying the location of excitation and measurement
RESULTS AND DISCUSSION
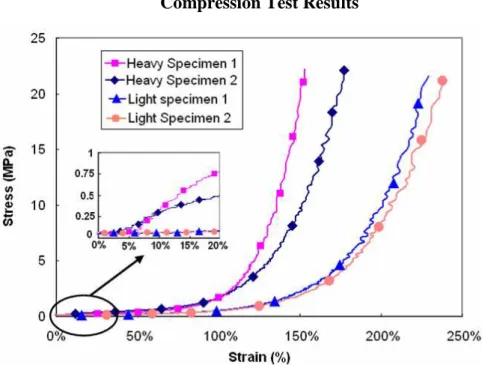
Figure 8 compares the results of the compression tests carried out on the two heavy and two light specimens. As explained previously, the fiber core density of all the four compression test specimens is 150 kg/m3. The ratio of resin and hardener in the heavy specimens is 2.5 times than that in the light ones.
Compression Test Results
Figure 8 Compression stress/strain curves for the heavy and light fiber network sandwich
specimens (150kg/m3 fiber density). The zoomed view shows the linear-elastic phase used for calculating the elastic modulus
From the graph (Figure 8), it can be noticed that there is a good reproducibility of compression tests carried out on the two types of fiber network sandwich specimens. In case of the heavy specimens, compression curves move from the right to the left and the densification starts for smaller strains (100 % for the heavy specimens). The extra resin in the heavy specimens results in better cross-linking of the fibers and increases the initial stiffness of the material which is evident by the linear-elastic phase which is quite prominent (zoomed view in Figure 8). The heavy specimens show a linear-elastic behavior up to around 0.8 MPa.
The calculation of the elastic modulus is based on the linear-elastic part of the curves as shown in the zoomed view in Figure 8. Even if the stress-strain curves shown in Figure 8 are highly non-linear, there is a linear-elastic part in case of the heavy specimens. The elastic modulus is calculated by measuring the slope of this linear-elastic part as explained in the ASTM standard in reference [41]. The average elastic modulus for the two heavy specimens
is around 1.4 MPa. However in case of the light specimens, one has to compress longer in order to achieve densification (strain around 160 %) as they are less rigid as compared to the heavy specimens due to the lack of resin. The linear elastic phase is non-existent in case of the light specimens so the calculation of the elastic modulus is not possible. Unloading has not been performed to reveal the effects of plasticity because it is not in the scope of this work. The authors are mainly interested in the linear-elastic part in order to calculate the elastic modulus which shall be used in future for the modeling of the entangled sandwich beams.
Three Point Bending Test Results
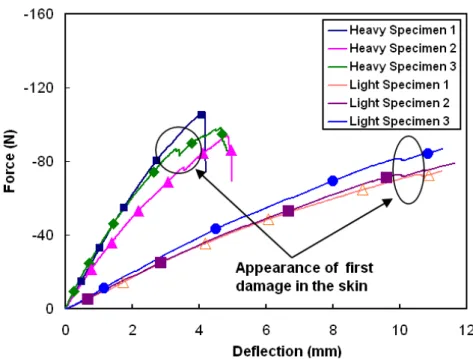
Figure 9 Force-deflection curves measured under three-point bending tests for the two types
of fiber network sandwich specimens. The appearance of the first damage in the skins is indicated
The aim of the bending tests is to calculate the out of plane shear modulus Gc of the
fiber network sandwich materials with the help of the Equations (3-5) as discussed before. It can be seen from the force-deflection curves in Figure 9 that despite the complex nature of the fabrication process, the results of the three heavy as well as the three light specimens show a relatively good correlation. In case of the heavy specimens, the first damage in the skin appears around the 4-5 mm mark, whereas for the lighter specimens the first damage signs are after 10 mm. In addition, lesser force is required in the case of the light specimens to crack the skin. The average shear modulus for the heavy specimens is 10 MPa, and for the light specimens is 4 MPa. The values of the elastic and shear modulli are considerably low from a structural strength point of view. It is important to underline here that these types of sandwich specimens are designed for specific applications only. The main idea behind the fabrication of
these sandwich specimens is to have a material having good damping characteristics even if it does not possess high structural strength.
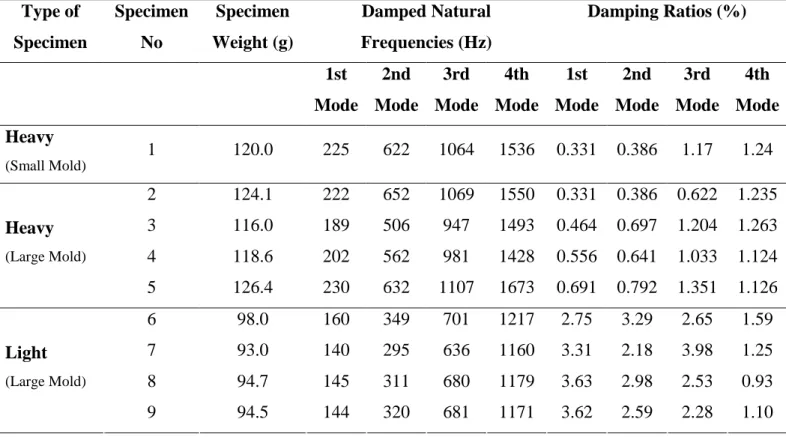
The aim of the vibration testing is to diagnose the variability of the fabrication process and to extract the global modal parameters i.e., natural frequencies and damping ratios. The modal parameters for the first four bending modes are studied. Firstly, vibration tests are carried out on the vibration test specimen fabricated from the small mold and then on the four light and heavy specimens fabricated from the large mold. The modal parameters extracted from 41 high quality frequency response functions with the help of Polymax algorithm integrated in the LMS data acquisition system, are presented in Table 4. As discussed before, the difference in weight between each of the four heavy and light specimens is due to the fact that with the currently available fabrication technology it is difficult to spray the resin equally on the fibers. This difference in weight is also evident in the natural frequencies of these specimens (Table 4). The heavy specimen 5 and light specimen 6 have comparatively high natural frequencies due to them being relatively heavier in weight than the rest.
Keeping in view the difficulty level of the fabrication process, a major aim of this work is to successfully reproduce multiple sandwich fiber network specimens having the same characteristics. For this reason, the intent is to reproduce four vibration test specimens identical to Specimen 1 (150 kg/m3 fiber core density and 43g of epoxy resin) in a large mold. The comparison of the modal parameters of Specimen 1 with those of the heavy specimens (Specimen 2-5) show that large sandwich specimens with fiber network core can be reproduced with a relative efficiency. The natural frequency of the first mode for Specimen 1 is 225 Hz (Table 4), where as for the heavy specimens (Specimens 2-5) the average natural frequency for the first mode is 211 Hz with a standard deviation of 18 Hz. The main reason for this dispersion is the uneven spray of resin on the fibers. So vibration tests have been used here as a diagnostic tool in order to verify the quality of the fabrication process.
On the other hand, the light specimens (Specimens 6-9) possess better damping characteristics because lesser amount of resin increases the friction between the carbon fibers in the sandwich core (weakening the cross-linking between the fibers), which leads to higher values of damping ratios (Table 4). It can be said that the vibration tests verify the results previously found by the compression and the bending tests, which also underline the softness of the light specimens.
Table 4. Modal parameters comparison for the light and heavy vibration test specimens fabricated from the small and large mold (150 kg/m3 fiber core density)
Type of Specimen Specimen No Specimen Weight (g) Damped Natural Frequencies (Hz) Damping Ratios (%) 1st Mode 2nd Mode 3rd Mode 4th Mode 1st Mode 2nd Mode 3rd Mode 4th Mode Heavy (Small Mold) 1 120.0 225 622 1064 1536 0.331 0.386 1.17 1.24 2 124.1 222 652 1069 1550 0.331 0.386 0.622 1.235 3 116.0 189 506 947 1493 0.464 0.697 1.204 1.263 4 118.6 202 562 981 1428 0.556 0.641 1.033 1.124 Heavy (Large Mold) 5 126.4 230 632 1107 1673 0.691 0.792 1.351 1.126 6 98.0 160 349 701 1217 2.75 3.29 2.65 1.59 7 93.0 140 295 636 1160 3.31 2.18 3.98 1.25 8 94.7 145 311 680 1179 3.63 2.98 2.53 0.93 Light (Large Mold) 9 94.5 144 320 681 1171 3.62 2.59 2.28 1.10
The vibration tests results show that the heavy specimens (Specimens 1-5) being more dense are less dissipative in nature thus possessing lower damping characteristics whereas, the light specimens (Specimens 6-9) having higher damping values are more dissipative in nature. This observation can be further explained by studying the comparison of the sum of frequency response functions (FRF) for Specimen 2 (Heavy) and Specimen 7 (Light) in Figure 10. The resonance peaks for the first four bending modes for each specimen are also highlighted.
An interesting global approach is developed next in order to compare the average vibratory level of the specimens. The average vibratory level is calculated by taking the average of the amplitude (in dB) of the sum of the frequency response function for each specimen. The sum of the frequency response functions can be compared for all the vibration test specimens in this article, as same number of measurement points (41) has been chosen i.e. symmetricity has been respected for all the specimens. It can be seen in Figure 10, that the resonance peaks of the heavy specimen are more pointed and possess higher amplitude than the light specimen. The resonance peaks of the light specimens are comparatively rounded specially after 800Hz. The average vibratory level (AVL) is also compared for the two types
of specimens, and it can be seen that the light specimens possess on average a 15 dB lower amplitude than the heavy ones.
Comparison of the Sum of Frequency Response Functions
Figure 10 Comparison of the Sum of Frequency Response Function (FRF) for a light
(Specimen 2) and a heavy specimen (Specimen 7) having 150 kg/m3 fiber core density.
From Figure 10, it can be inferred that the difference in the natural frequencies between the heavy and light specimens signifies a loss in rigidity, whereas the change in vibratory level signifies a reduction in the amplitude of vibration. The percentage change in frequency and the change in vibrational level between the four heavy and four light vibration test specimens (150kg/m3 fiber core density) for the first four bending modes are calculated with the help of Equations (6) and (7) and the resulting values are laid out in Table 5.
Change in frequency (∆f) = ) ( ) ( ) ( k f k f k f H L H − (6)
where fH(k) is the average frequency for the four heavy specimens (Specimens 2-5) for the kth
mode and likewise fL(k) is the average frequency for the four light specimens (Specimens 6-9)
for the kth mode
Change in vibratory level (∆a) =aH(k)−aL(k) (7)
where aH(k) is the average amplitude in dB for the four heavy specimens for the kth mode and aL(k) is the average amplitude in dB for the four light specimens for the kth mode
Table 5. Change in frequency and vibrational level for the light and heavy vibration test specimens for the first four modes
Mode 1 Mode 2 Mode 3 Mode 4
% Change in Frequency (∆f) 30.1 % 45.7 % 34.3 % 23.1 % Change in Vibratory Level (∆a) 10.1 dB 13.7 dB 17.9 dB 17 dB
Table 5 shows that the average change in frequency for the first four bending modes between the light and heavy specimens is approximately 33 %. As the decrease in natural frequency signifies a loss of rigidity, therefore it can be concluded that the lighter specimens are less rigid than the heavy ones.
CONCLUSION
The aim of this article is to fabricate a sandwich material that possesses high damping characteristics for specific applications like the inner paneling of a helicopter cabin, even if the structural strength of this material is on the lower side. For this reason, a new type of sandwich material with fiber network materials as core and unidirectional carbon pre-impregnated plies as skins is fabricated. The advantage of the vibration testing is to diagnose the variability of the fabrication process and to verify experimentally the potentially good damping characteristics of the fiber network sandwich specimens. The static test results show that the structural strength of these sandwich specimens is quite low but this is admissible because the aim of these types of materials is not structural strength. The vibration tests on these specimens showed that the lighter specimens possess five times more damping and on the average a 15 dB lesser vibratory level than the heavier ones. Despite the complexity of the fabrication process, large fiber network sandwich specimens are relatively successfully reproduced.
In future, these types of sandwich test specimens shall be fabricated with glass fibers as core material with a view to improve the strength of the material. These sandwich specimens shall be compared with classical sandwich materials with honeycomb and foam as cores in order to compare their static and dynamic properties. In addition, impact tests shall be carried out on these sandwich materials to study their impact toughness with the help of modal parameter shifts. Furthermore, the authors plan to model the entangled sandwich beam with measured core properties in order to calculate the natural frequencies to compare with the test result. As entangled sandwiches are a new brand of sandwich materials, therefore such comparisons will provide a verification of the measured core properties.
ACKNOWLEDGMENTS
The authors gratefully thank Professor B. Castanié and Samuel Rivallant from Université de Toulouse for his technical support during the experimental work and also to project students J. B. Lecaillon and A. de Nazelle from Saint-Cyr l’Ecole for their help during the fabrication process.
REFERENCES
1. B. Hayman, C. Berggreen, C. Jenstrup and K. Karlsen. (2008). Advanced Mechanical Testing of Sandwich Structures, 8th International Conference on Sandwich Structures ICSS 8, Porto, Portugal. 417-427.
2. ISO 844:2007, edition 5 (2007), Determination of Compression Properties,
International Organization for Standardization.
3. ASTM C 393-62. (1988). Standard test method for flexural properties of flat sandwich constructions.
4. L.S. Sendlein, L.A. Carlsson and L.A. Merry. (1991). Characterization of Face Sheet/Core Shear Fracture of Composite Sandwich Beams, Journal of Composite Materials, 25 : 101-116.
5. Y. frosting and M. Brauch. (1990). Bending of Sandwich Beams with Transversly Flexible Core, AIAA Journal, 28(3) : 523-531.
6. K. Lingaiah and B.G. Suryanarayana. (1989). Strength and Stiffness of Sandwich Beams in Bending, Experimental Mechanics, 1-9.
7. B. Soares, L. Reis and A. Silva. (2008). Testing of Sandwich Structures with Cork Agglomerate Cores, 8th International Conference on Sandwich Structures ICSS 8, Porto, Portugal. 417-427.
8. R.F. Gibson. (2000). Modal Vibration Response Measurements for Characterization of Composite Materials and Structures, Composites Science and Technology. 60 : 2769-2780. 9. D.J. Ewins (1984) Modal Testing Theory and practice, John Wiley & Sons Inc. Pages 269.
10. C. Hwu, W.C. Chang and H.S. Gai. (2004). Vibration Suppression of Composite Sandwich Beams, Journal of Sound and Vibration, 272 : 1–20.
11. J.S. Hu and C. Hwu. (1995). Free Vibration of Delaminated Composite Sandwich Beams, American Institue of Aeronautics and Astronautics Journal, 33(9) : 1-8.
12. D.J. Mead and S. Markus. (1970). Loss factors and resonant frequencies of encastre damped sandwich beams, Journal of Sound and Vibration, 12(1) : 99–112.
13. E. Nilsson and A.C. Nilsson. (2002). Prediction and Measurement of some Dynamic Properties of Sandwich Structures with Honeycomb and Foam Cores, Journal of Sound and
Vibration, 251(3) : 409–430.
14. K. Renji. (2000). Experimental Modal Densities of Honeycomb Sandwich Panels at High Frequencies, Journal of Sound and Vibration, 237(1) : 67–79.
15. K. Renji and S. Narayan. (2002). Loss Factors of Composite Honeycomb Sandwich Panels, Journal of Sound and Vibration, 250(4) : 745–761.
16. S. He and M.D. Rao. (1993). Vibration and damping analysis of multi-span sandwich beams with arbitrary boundary conditions, Journal of Sound and Vibration, 164 (1) : 125–142. 17. M.J. Yan and E.H. Dowell. (1972). Governing Equations for Vibrating Constrained-Layer Damping Sandwich Plates and Beams, Journal of Applied Mechanics, 39 : 1041–1046. 18. D.J. Mead. (1982). A Comparison of some Equations for the Flexural Vibration of Damped Sandwich Beams, Journal of Sound and Vibration, 83(3) : 363–377.
19. B. Wang and M. Yang. (2000). Damping of Honeycomb Sandwich Beams, Journal of
Materials Processing Technology, 105 : 67-72.
20. Z. Li and M.J. Crocker. (2006). Effects of thickness and Delamination on the Damping in Honeycomb-Foam Sandwich Beams, Journal of Sound and Vibration, 294 : 473–485. 21. M. Hao and M. Rao. (2005). Vibration and Damping Analysis of a Sandwich Beam Containing a Viscoelastic Constraining Layer. Journal of Composite Materials, 39 : 1621-1643.
22. M.D Rao and S. He. (1993). Dynamic Analysis and Design of Laminated Composite Beams with Multiple Damping Layers. AIAA Journal, 31(4) : 736-745.
23. W.J. Jung, A.J. Aref. (2003). A Combined Honeycomb and Solid Viscoelastic Material for Structural Damping Application, Mechanics and Materials, 53 (8) : 831–844. 24. M. Garai and F. Pompoli. (2005). A Simple Empirical Model of Polyester Fiber Materials for Acoustic Applications, Applied Acoustics, 66, 1383-1398.
25. L. O. Golosnoy, A. Cockburn and T. W. Clyne. (2008). Optimisation of Metallic Fiber Network Materials for Compact Heat Exchangers, Advanced Engineering Materials, 10(3): 210-218.
26. B. M. Zhang, S. Y Zhao and X. D He. (2008). Experimental and Theoretical Studies on High-Temperature Thermal Properties of Fibrous Insulation, Journal of Quantitative
27. R. Gustavsson. (1998). Formable Sandwich Construction Material and Use of the Material as Construction Material in Vehicles, Refrigerators, Boats, etc. Patent WO 98/01295, 15th January 1998, AB Volvo.
28. A. E. Markaki and T. W. Clyne. (2001). Ultra Light Stainless Steel Sheet Material. US patent 10/000117, filed 31st October 2001, Cambridge University.
29. A. E. Markaki and T. W. Clyne. (2003). Mechanics of Thin Ultra-Light Stainless Steel Sandwich Sheet Material, Part I. Stiffness, Acta Mater, 51 : 1341–1350.
30. J. Dean. (2008). Energy absorption during projectile perforation of lightweight panels with metallic fibre cores, 8th International Conference on Sandwich Structures ICSS 8, Porto, Portugal.
31. D. Zhou, W. J. Stronge. (2005). Mechanical Properties of Fibrous Core Sandwich Panels, International Journal of Mechanical Sciences, 47 : 775-798.
32. L. Mezeix, C. Bouvet, B. Castanié and D. Poquillon. (2008). A New Sandwich Structured Composite with Entangled Carbon Fibers as Core Material. Processing and Mechanical Properties, 8th International Conference on Sandwich Structures ICSS 8, Porto, Portugal.
33. L. Mezeix, C. Bouvet, and D. Poquillon. (2008). Experimental Data and Modelling of Entangled Fibers and Entangled Cross-Linked Fibers During Compression. Accepted January 2008 in Journal of Material Science.
34. P. Castéra. (2002). Comportement Physico-mécanique des Matériaux Fibreux Cellulosiques considéré comme des Milieux Aléatoires, Proceeding of Materiaux, Tours,
France.
35. M. Baudequin (2002), Identification des Mécanismes Physiques mis en jeu lors de la reprise d’épaisseur de la Laine de Verre, PhD Thesis, Université Pierre et Marie Curie Paris VI, France.
36. D. Poquillon, B. Viguier and E. Andrieu. (2005). Experimental Data about Mechanical Behavior during Compression Tests for Various Matted Fibres, Journal of Materials Science, 40(22) : 5963 - 5970.
37. M. Faessel, C. Delisée, F. Bos and P. Castéra. (2005). 3D Modelling of random cellulosic fibrous netwroks based on X-ray tomography and image analysis, Composites
Science and Technology, 65 : 1931 - 1940.
38. HexPly M21, Data Sheet, Hexcel Composites, F.R.
39. Y. Aminanda, B. Castanié, J.J. Barrau and P. Thevenet. (2005). Experimental Analysis and Modelling of the Crushing of Honeycomb Cores, Applied Composite Materials,12(3), 213-227.
40. J.L. Wojtowicki and L. Jaouen. (2004). New Approach for the Measurements of Damping Properties of Materials using Oberst Beam, Review of Scientific Instruments, 75(8),
2569-2574.
41. ASTM E 111-04. (2004). Standard test method for Young's Modulus, Tangent Modulus, and Chord Modulus.