OATAO is an open access repository that collects the work of Toulouse
researchers and makes it freely available over the web where possible
Any correspondence concerning this service should be sent
to the repository administrator: [email protected]
This is an author’s version published in:
http://oatao.univ-toulouse.fr/24431
To cite this version:
Meiffren, Vincent
and Lenormand, Pascal
and Ansart, Florence
and
Manov, Stéphan
Sol-Gel Routes to Replace Chromate Based Treatments for
Protection Against Zinc Corrosion. (2011) ECS Transactions, 35 (17). 75-87.
ISSN 1938-5862
Regarding the environmental consciousness and requirements
relative to industrial processes, researchers and end users have to
move to more green surface treatments. That is why, the use of
toxic compounds such as chromates must be strictly prohibited. So,
in order to replace this element preserving an efficient protection
against corrosion of metals, a new route using sol-gel process
clearly appears as a promising alternative method.
In this paper, we investigated three different sol-gel systems in
various media (alcohol and/or water) and compared their efficiency
in terms of protection against corrosion and environmentally
friendliness. Thus, industrial normalized corrosion test and
electrochemical analyses such as polarisation curves and EIS
measurements were carried out in order to both evaluate and
discuss coatings behaviour in corrosive environment.
Introduction
Protection against corrosion is well known as one of the most important issue in many
fields. Regarding metals, the improvement of the protection leads to an increase of the
lifetime and allows metal using in more applications. Relative to zinc metal, anticorrosive
treatments are needed to slow down oxidation of the surface when pollutants, present in
the atmosphere react with the metal. In fact, under chloride or sulfur exposure, zinc reacts
by forming white rust (1). Instead of the metal degradation, the visual aspect is strongly
damaged, which is a main drawback in the building field. Usually, zinc protection was
obtained by forming conversion coatings on the metal, and like many other metals,
chromates were the most efficient corrosion inhibitor (2). But, nowadays, industrial
processes have to turn to more “green” routes and chromate compounds will be strictly
forbidden in the next years.
So, in this study, our goal is to propose alternative routes to protect zinc avoiding the use
of toxic elements as chromates. Therefore, the amount of VOC contained in the solutions
has to be studied. In order to reach both objectives: good performances and
environmental aspects, sol-gel route has been chosen in association with dip-coating
process because no toxic compounds are used, it is easy-to-use, low cost process and
layers can form efficient physical barriers (3-11).
Based on our previous works (12-14), three different coatings have been studied to define
the best compromise between protection efficiency and environmentally friendliness. The
first one was made from TEOS (tetraethoxysilane) and MAP (γ-methacryloxypropyl
trimethoxysilane) which leads to very high protection against corrosion (12) but with a
too high amount of alcohol. And two other processes correspond to very low alcohol
content in the solution or alcohol free solution, respectively called:
10.1149/1.3641292
Sol-gel routes to replace chromate based treatments for protection against
zinc corrosion
V. Meiffren
a, P. Lenormand
a, F. Ansart
a, S. Manov
a1) GPTMS (3-glycidoxypropyltrimethoxysilane) and ASB (Aluminum-tri-sec
butoxide) (14).
2) Bisamino (Bis [3-(trimethoxysilyl)-propyl] amine) (13).
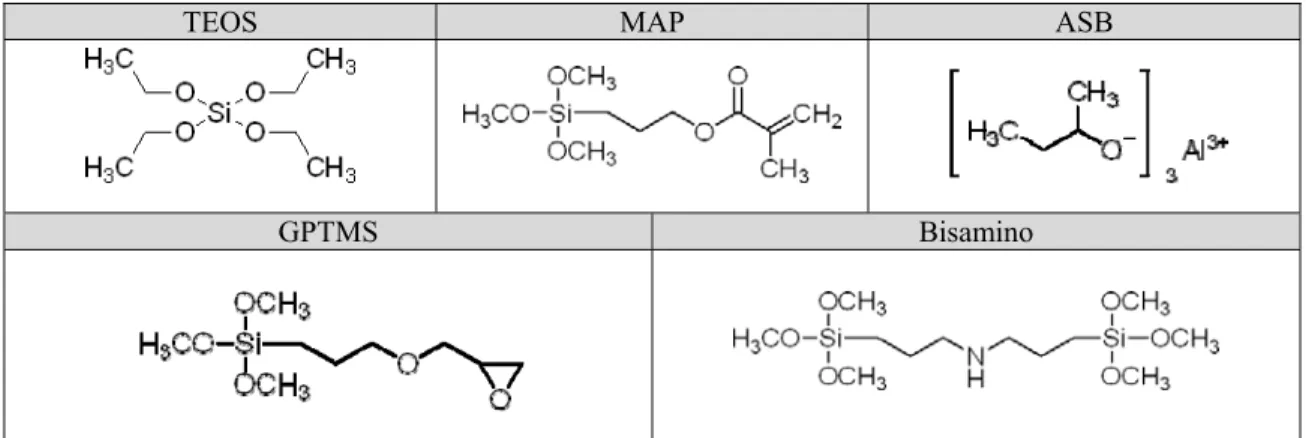
Developed formulas of these precursors are indicated in the figure 1.
TEOS MAP ASB
GPTMS Bisamino
Figure 1. Developed formulas of precursors
To characterize the protective properties, accelerated corrosion tests coupled with
electrochemical analyses were carried out. More precisely, thickness influence on barrier
properties and coatings behavior during long term immersion was investigated in order to
understand the degradation mechanisms.
Material and methods
Pre-treatment of the substrate
Rolled and mechanically brushed zinc strip (0.7mm thick) was used as substrate.
Samples (25x80mm) were cut and cleaned with ethanol, and then immersed in a
commercial alkaline solution (Novaclean®) during 5 min at 80°C in order to remove the
top oxide layer and to improve the wettability. By this way, the cleaned zinc has an
average roughness (Ra) of 0.6µm.
Preparation of sols
Generally, sol-gel precursors for low temperature applications are metallic alkoxides
MOR
ntype, with more often silicon atom as metal. However, many studies have shown
good anticorrosive properties using hybrid layers obtained by adding an organic part to
the network (6,11,15-17). Therefore, precursors containing an organic group linked to the
metal are frequently used such as (R’
mMOR
n) (5).
Relative to the sol preparation, it consists of mixing precursor(s) with solvent(s)
(water and/or alcohol). Two series of reactions started between water and precursor
(hydrolysis [1]) and then with the hydrolyzed precursor and another precursor,
hydrolyzed or not (homo and hetero-condensation respectively [2] and [3]) to form
M-O-M bonds. These bonds are then the elementary units of the future inorganic network
obtained after the drying step.
Hydrolysis:
≡ M−OR + H
2O Æ ≡ M−OH + R−OH
[1]
Condensation:
≡ M−OH + ≡ M−OH Æ ≡ M−O−M ≡ + H
2O
[2]
or
≡ M−OH + ≡ M−OR Æ ≡ M−O−M ≡ + R−OH
[3]
In this study, three sols consisting of different precursors have been prepared:
Sol A: TEOS (tetraethoxy silane) and MAP (γ-methacryloxypropyl trimethoxysilane)
were mixed in a molecular ratio of 8/1 with [TEOS]=1mol/L, then added to the solvent,
ethanol and water in molecular ratio of 1.3/1. Hydrolysis rate ([H
2O]/[precursors] was
fixed at 7/1.
Sol B: GPTMS (3-glycidoxypropyltrimethoxysilane) and ASB (Aluminum-tri-sec
butoxide) mixed to propan-2-ol are vigorously stirred in molar ratio of 7/3/3. Afterwards,
water is added to the solution with a hydrolysis rate of 13.8.
Sol C: Bisamino (Bis [3-(trimethoxysilyl)-propyl] amine) is added to acidified water with
[Bisamino]=[HNO
3] and a hydrolysis rate of 163.
In all sols, 0.01mol/L of cerium nitrate has been introduced with the aqueous phase
because of this concentration corresponds to the best compromise for the corrosion
inhibitive properties (18,19).
Hybrid coatings processing
Before deposition, sols A and B were aged during 24h and only during 10min for the
sol C, depending on the hydrolysis rate and so the reactions kinetics. Coatings were then
performed by dip-coating process using a controlled withdrawal rate of 20cm/min
followed by different thermal treatments. For coating A (obtained from the sol A),
samples were dried at 60°C during 15min. For the coatings B, drying conditions were
20h at 50°C followed by 16h at 110°C. And for the coatings C, thermal treatment
corresponded to 72h at 80°C.
Characterisation techniques
Microstructure of sol-gel coatings has been studied using scanning electronic
microscopy (surfaces and cross sections).
In parallel, corrosion resistance of coated zinc was evaluated through a cyclic
corrosion test which is a more conventional industrial test. Test duration was 10 cycles,
24h each. One cycle consists in different steps alternating wet and dry atmospheres at
different temperatures. During the humidity stage, the chamber was maintained at near
100% relative humidity. In order to estimate the white rust formation, the samples were
weighted before and after all corrosion cycles.
Anticorrosion properties were also evaluated thanks to electrochemical measurements.
On the first hand, polarization curves have been performed in aerated and unstirred
0.5mol/L of NaCl aqueous solution. Saturated calomel electrode, connected to the
working solution through a capillary, was used as reference, and a Pt electrode as
auxiliary electrode. 1 cm² of the working electrode was exposed to the corrosive solution.
Polarization curves were plotted using a PGP 201 Potentiostat/Galvanostat device.
Polarization curves were recorded for all samples in a potential range from free open
circuit potential to -0.850V, in order to study the anodic behavior of treated zinc. On the
TABLE 1. Several values of sols and coatings.
Sol reference %v of alcohol [precursors] Weight gain Thickness Density
A 60% 1.1mol/L 1.1g/m² 1.0µm 1.1
B 3% 2.0mol/L 5.0g/m² 3.0µm 1.7
C 0% 0.6mol/L 0.7g/m² 0.8µm 0.9
Relative to the coating densities, an increase of the network compactness is clearly
shown: for the sol A, that is attributed to the addition of MAP because the methacrylate
functions can crosslink the inorganic network (20). In the same way, GPTMS, in the sol
B, contains an epoxy ring bonded to the organic chain. This ring can be opened during
the thermal treatment (14) and can induce an increase of the network reticulation.
b)
c)
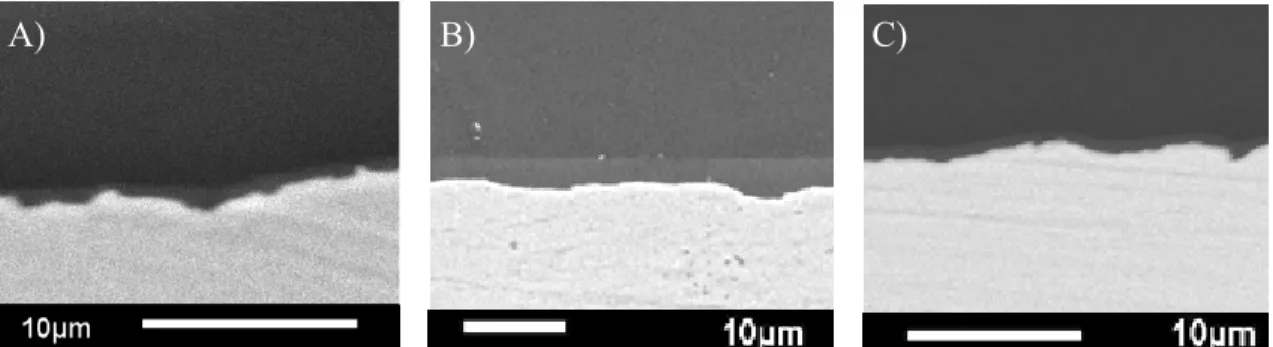
Figure 2. Cross-sections of a) coating A, b) coating B and c) coating C observed by
electronic microscopy.
A)
B)
C)
second hand, EIS measurements were carried out on 5 cm2 covered area in a 0.5mol/L
Na
2SO
4electrolyte. Spectra were recorded over a frequency range between 65kHz and
100mHz with an amplitude of 10mV. Both Bode and Nyquist plots were used to
determine sample behavior. All electrochemical measurements were performed after
stabilization of the potential during 1h.
Results and discussion
Correlation between sols characteristics and coating microstructure
Sols are limpid and homogenous excepted for sol C where some particles appeared
when water was mixed to the precursor. This formation is probably due to the high
hydrolysis rate. Alcohol is generally added to the solution to reduce the hydrolysis
kinetics but, Bisamino compound hydrolysis is extremely quick.
Sol viscosities were quite similar, between 2mPa.s and 3mPa.s respectively for the sol
TEOS/MAP and sol Bisamino, and around 9mPa.s for sol GPTMS/ASB. Viscosity
differences are only due to precursor concentrations. After deposition by dip-coating and
drying as described before, samples were weighted and the weight gain attributable to the
layer formation was noticed. Layer thicknesses were then evaluated on polished cross
sections observed by electronic microscopy (figure 2) and coating densities have been
calculated. All these values are reported in the table 1.
-10 0 10 20 30 40 50 60 70 0 2 4 6 8 10 cycles (day) W ei g ht ga in ( m g/ dm ²)
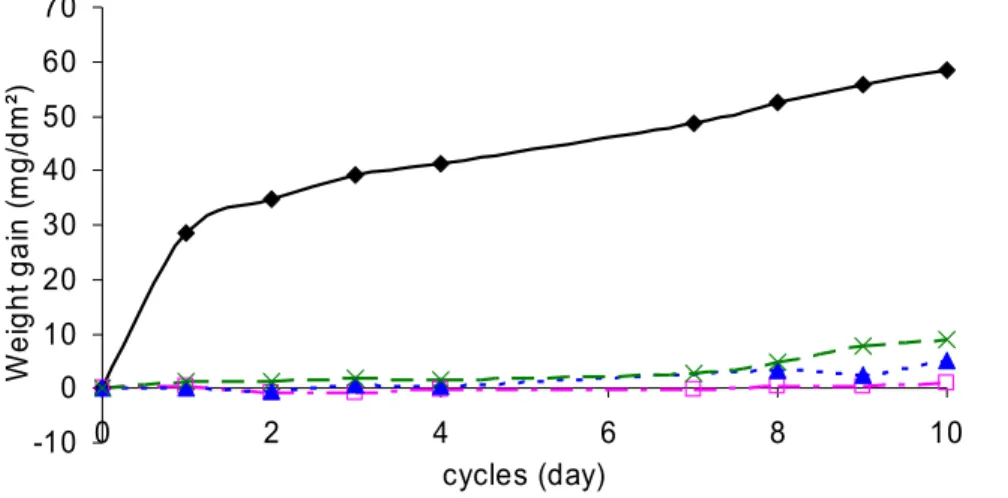
Figure 3. Weight gain of uncoated zinc (
), coating A (
□
), coating B (
▲) and coating C
(
■) during 10 cycles.
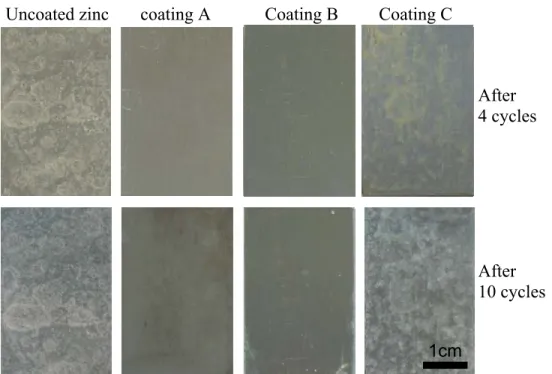
But, looking at sample photographs (figure 4.) after four and ten cycles, it can be
noted that no rust is present on the surface for A & B coated samples. The slight increase
of the weight gain can just be attributed to the white rust forming on edges. This
oxidation is due to an accumulation of sol before the drying step, which induces layer
brittleness on edges (21). However, for coatings C, general corrosion is observed from
the fourth cycle, but the weight gain cannot be seen because it remains under the error bar
(around 1mg/dm²).
Micrographs of cross sections highlight the very good leveling of sol-gel layers on the
substrate for each coated samples. Coatings are conformal and homogenous, and a good
adhesion has been reported by industrial tests (ISO 2409 and 6272).
Durability of coatings under corrosive media
To evaluate corrosion protection efficiency, several analyses were investigated.
Firstly, a typical industrial accelerated corrosion test has been carried out to highlight
white rust formation under alternation of wet and dry atmospheres. This test is frequently
used to predict corrosion resistance in real exposure conditions. Secondly,
electrochemical analyses as polarization curves and EIS measurements have been
performed to underline protection mechanisms of the systems immersed in an electrolyte.
Accelerated corrosion test. Three coated samples for each system (A, B, C) were
placed in the exposure chamber. For all systems, the average weight gain due to the white
rust formation was recorded after each cycle. Plots of sample weight gains, compiled in
the figure 3, underline the strong reduction of the oxidation for all coated samples in
comparison of the uncoated zinc. Before the fourth cycle, no oxidation is noted for coated
samples. Besides, after the seventh cycle, plots show a slight increase of the weight gain.
Figure 4. Photographs of all samples after 4 and 10 cycles exposed to the cyclic humidity
test.
Electrochemical analyses. In order to determine the global electrochemical behavior
of the system “layer + substrate”, polarization curves have been plotted (figure 5.). It can
be noted on these graphs, a shift of the open circuit potential for all coated samples that is
correlated to an increase of the metal nobility; surface reactivity has decreased.
Furthermore, anodic parts highlight a reduction of the current density at higher potentials
that means a similar decrease of the oxidation reaction kinetics.
Figure 5. Polarization curves of uncoated zinc (––), coating A (- - -), coating B (
-
– -
)
and coating C (– –) after 1h of immersion in NaCl 0.5mol/L.
This decrease is linked to the barrier effect of the sol-gel coating, which is a physical
barrier to the ionic migration of the electrolyte ions to the metal surface. Indeed, there is a
1cm
Uncoated zinc coating A Coating B Coating C
After
10 cycles
After
4 cycles
-10 -9 -8 -7 -6 -5 -4 -3 -2 -1 -1,10 -1,00 -0,90 -0,80 Potential (V) vs Eref L og J (A/ cm ²)higher reduction of the current density (around three orders of magnitude) for B coated
samples that could be attributed to a thicker and denser layer.
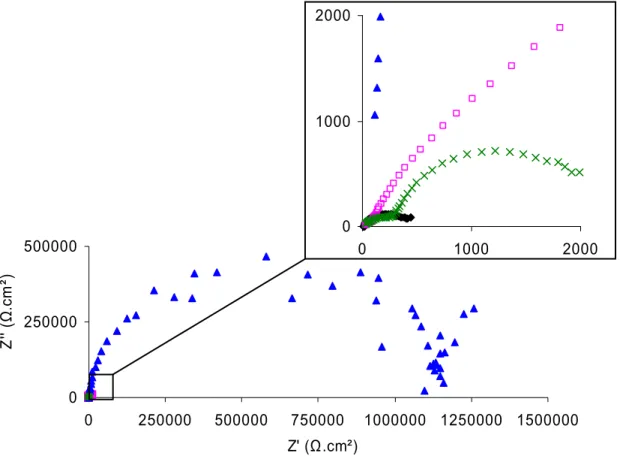
Figure 6. Nyquist representation of uncoated zinc (
), coating A (
□
), coating B (
▲) and
coating C (
×) after 1h of immersion in Na
2SO
40.5mol/L.
In addition, for EIS measurements, Nyquist representation underlines the very high
resistance supplied by the coating B, with one well defined capacitive loop and a
resistance around 1.1×10
6Ω.cm
2. For coatings A and C lower polarization resistances are
recorded, but around 5 times over than for uncoated zinc resistance (2000-2500Ω.cm
2).
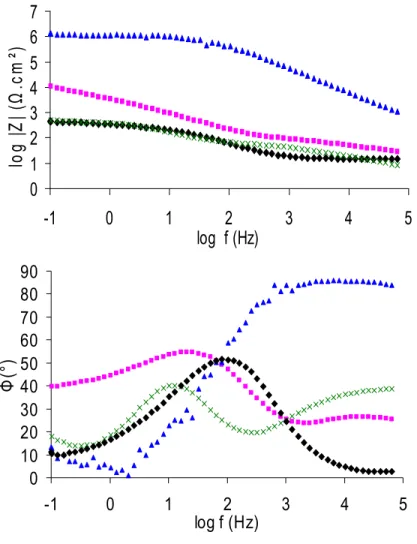
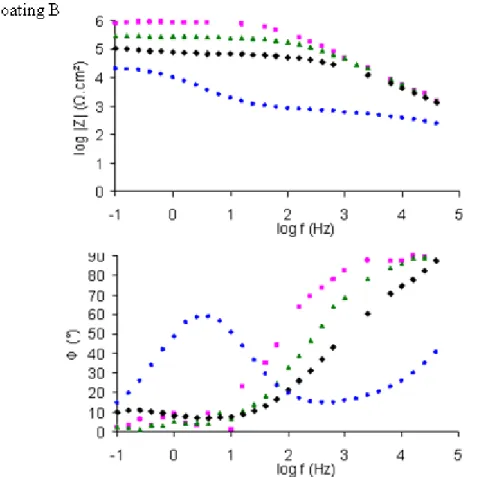
On Bode representation, the high resistance of coating B is underlined by an
impedance modulus at low frequencies around 10
6Ω.cm
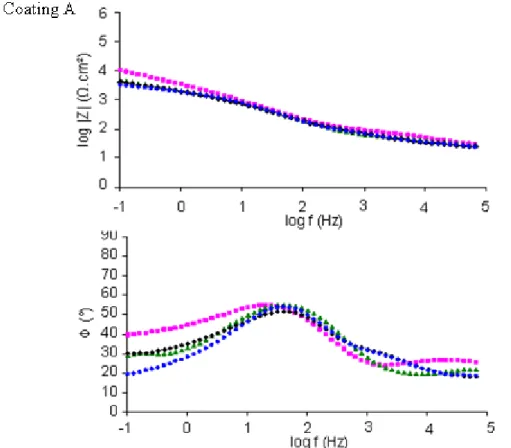
2. For coating A, a slight
improvement of the impedance modulus is observed and no significant influence is noted
for coating C.
Studying the phase angle at high frequencies, similar explanations can be done: for
coating C a phase angle of around 90° means a pure capacitance behavior which is a
typical signature of the barrier effect (22-25). On the contrary, the light increase of the
phase angle for coatings A and C show the poor barrier effect of these layers. However,
for coating A, this weak capacitive behavior detected at high frequencies is balanced by a
light capacitive behavior noticed at low frequencies. Therefore, electrolyte can easily
enter the coating, but oxidation reaction is yet decreased. In conclusion, coating A does
not really protect zinc as a physical barrier, but it contributes to slow down zinc corrosion.
0 250000 500000 0 250000 500000 750000 1000000 1250000 1500000 Z' (Ω.cm²) Z' ' ( Ω .c m ²) 0 1000 2000 0 1000 2000
Figure 7. Bode representation of uncoated zinc (
), coating A (
■
), coating B (
▲) and
coating C (
×) after 1h of immersion in Na
2SO
40.5mol/L.
Corrosion test and electrochemical analyses highlight the protection efficiency of
coatings A and B. However, in this paper, the environmentally friendliness is an
important issue, and as shown before, and alcohol content in the sol A is too high with
around 60%
vol.. So, it has been chosen to focus on protection by coating B. Nevertheless,
coating B acts as a physical barrier, and the thickness can be a key parameter of its good
protection. Similarly, for coating C, poor protective efficiency can be attributed to the
low thickness.
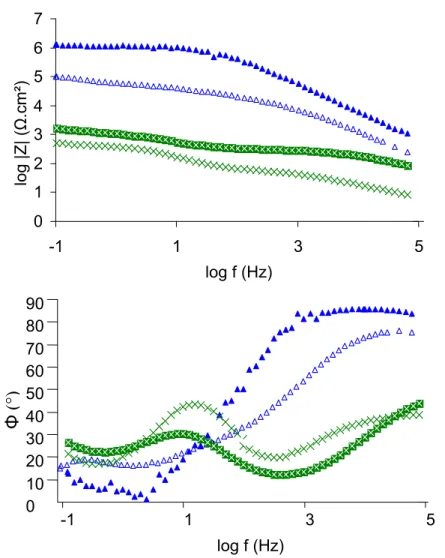
So, in order to compare coating B and C avoiding the thickness influence, shaping
process has been modified to obtain similar thicknesses in both cases. Concerning coating
B, sol concentration was reduced and for coating C, multilayers were carried out with
15min at 80°C of drying between every dip-coating to increase the thickness.
To evaluate coating thicknesses, polished cross-sections were observed by electronic
microscopy. Thicknesses were measured and reported in the table 2. Similar thickness
was performed with a sol concentrated at 75% for coating B and for a multilayer for
coating C with around 1.5µm. All coatings were conformal and provided good leveling of
the surface.
0 10 20 30 40 50 60 70 80 90 -1 0 1 2 3 4 5 log f (Hz) Φ (° )0
1
2
3
4
5
6
7
-1
0
1
2
3
4
5
log f (Hz)
lo
g
|Z
| (
Ω
.c
m
²)
-1 1 3 5 log f (Hz) 0 10 20 30 40 50 60 70 80 90
Φ
(
°)
0 1 2 3 4 5 6 7 -1 1 3 5 log f (Hz) log |Z| ( Ω .cm²)TABLE 2. Several values of sols and coatings.
Sol reference Sol concentration Number of
dip-coatings Thickness B B0 1 3.0µm B 0.875B0 1 2.3µm B 0.750B0 1 1.5µm C C0 1 0.8µm C C0 2 1.2µm C C0 3 1.5µm