2008-05
BOSSERT, Walter
CHAKRAVARTY, Satya R.
D’AMBROSIO, Conchita
Département de sciences économiques Université de Montréal
Faculté des arts et des sciences C.P. 6128, succursale Centre-Ville Montréal (Québec) H3C 3J7 Canada http://www.sceco.umontreal.ca [email protected] Téléphone : (514) 343-6539 Télécopieur : (514) 343-7221
Ce cahier a également été publié par le Centre interuniversitaire de recherche en économie quantitative (CIREQ) sous le numéro 05-2008.
This working paper was also published by the Center for Interuniversity Research in Quantitative Economics (CIREQ), under number 05-2008.
Poverty and Time
∗Walter Bossert
Department of Economics and CIREQ, University of Montreal [email protected]
Satya R. Chakravarty Indian Statistical Institute, Kolkata
Conchita D’Ambrosio
Università di Milano-Bicocca, DIW Berlin and Econpubblica, Università Bocconi [email protected]
This version: March 2008
Abstract. We examine the measurement of individual poverty in an intertemporal con-text. In contrast to earlier contributions, we assign importance to the persistence in a state of poverty and we characterize a class of individual intertemporal poverty measures reflecting this feature. In addition, we axiomatize an aggregation procedure to obtain intertemporal poverty measures for entire societies and we illustrate our new indices with an application to EU countries. Journal of Economic Literature Classification No.: D63. Keywords: Intertemporal Poverty Measurement, Equity.
∗We thank Itzhak Gilboa for useful comments and discussions. Financial support from the
1
Introduction
In a seminal contribution, Sen (1976) distinguished two fundamental issues in poverty measurement, namely, (i) identifying the poor among the total population; and (ii) con-structing an index of poverty using the available information on the poor. The first problem has been solved in the literature by setting a poverty line (which may or may not depend on the income distribution under consideration) and identifying as poor the individuals whose incomes fall below this threshold. Regarding the second, the aggrega-tion problem, many indices have been proposed capturing not only the fracaggrega-tion of the population which is poor (the head-count ratio), that is, the incidence of poverty, but also the extent of individual poverty and the inequality among those who are poor. The literature on poverty measurement has advanced to a high degree of sophistication since Sen (1976). However, there remain substantial issues to be addressed. One of these issues is concerned with the measurement of intertemporal poverty as opposed to limiting at-tention to single-period considerations. For instance, consider an observer comparing two individuals both of whom are poor today to the same degree. Suppose that, while the first was not poor in any of the previous two periods, the second individual experienced poverty in both previous periods in addition to the present. Is the degree of intertemporal poverty of those two individuals the same? This does not seem to be the case–the second individual is poorer as soon as the entire intertemporal income distribution is taken into consideration. Now consider again two individuals both of whom are poor today to the same degree but the first was poor also last year, while the second was out of poverty last year but in poverty the year before that. Is the intertemporal poverty of those two individuals the same? Again, we believe not. Both individuals were poor twice (and we are assuming that they were poor to the same degree) but the first individual experi-enced poverty in two consecutive periods while the second did not. The relative degree of overall poverty when comparing the two individuals over time depends on the role and evaluation of persistence in a state of poverty. To us, the negative effects of being in poverty are cumulative, hence a two-period poverty spell is much harder to handle than two one-period spells that are interrupted by one (or more) periods out of poverty. We believe that intertemporal information should not be neglected in assessing individual poverty. Nowadays, the availability of panel data for most of the countries in the world makes it possible for researchers to expand the information set when evaluating poverty. In addition to poverty lines, per-period poverty values and inequality among the poor, the lengths of individual poverty spells can be incorporated. We propose a way to add
this time dimension to the information used in poverty measurement.
This paper is similar in spirit to Hoy and Zheng (2006) but the individual intertemporal poverty measures we characterize differ from theirs due to the properties that are deemed relevant to capture the role of time and persistence. Hoy and Zheng (2006) demand that aggregating first across individuals and then across time periods should be equivalent to aggregating in the reverse order–first across time periods for each single individual and then across members of the society. This leads to a notion of path independence. In contrast to Hoy and Zheng (2006), we consider the phenomenon of persistence to be crucial in assessing individual intertemporal poverty. Aggregating across individuals first means that this information is lost when we reach the second stage of aggregation. Hence we characterize an index of intertemporal poverty for each member of the society under analysis and then aggregate across members of society.
Foster (2007) expresses a similar view in proposing chronic poverty indices by aggre-gating first across time. In contrast to our contribution, persistence in the state of poverty is not assigned any relevance. The measures Foster (2007) proposes–generalizations of the Foster-Greer-Thorbecke (1984) class that allow for time to matter–do satisfy a prop-erty of time anonymity under which the sequencing of incomes in individual intertemporal profiles does not affect poverty. Foster (2007) defines an individual as chronically poor if its income is below the poverty line for at least a given number of periods. Thus, in addition to a poverty line, there is a second cut-off point in defining the chronically poor–a point defined in terms of the incidence of poverty over time. As is the case for our contribution, the order of aggregation matters in Foster’s approach–in order to identify the chronically poor, the first aggregation step has to be performed across periods for each individual. The individual Foster (2007) indices are means over time of per-period Foster-Greer-Thorbecke (1984) indices. The aggregate indices are obtained by calculating average poverty among the chronically poor. Recall that, in Foster (2007), only individ-uals who are poor for at least a given number of periods are considered. Thus, if an individual is poor, but rarely so, it is treated in the analysis as one of the individuals who are never poor. This is not the case in the present contribution. We do not restrict our sample to chronically poor individuals, hence we take into account spells of poverty of any length. Foster (2007) formulates a set of axioms and discusses them in the context of his class of measures but he does not provide a characterization. The class of measures that we propose in this paper contains Foster’s (2007) as a special case if applied to the chronically poor only. This corresponds to the limiting case where no importance is given to persistence and where the per-period individual poverty indicators are the gaps
according to the indices belonging to the Foster-Greer-Thorbecke (1984) class.
Calvo and Dercon (2007) consider intertemporal measures of individual poverty as well. As is the case for Foster (2007), they formulate desirable properties of such measures but do not characterize specific classes. They suggest measures some of which allow for different treatment of different time periods by means of discounting. They also address the persistence issue but the proposed measure is very different from ours and deals only with poverty in the immediately preceding period without allowing the entire history of individuals to matter.
It seems to us that the negative effects of being in poverty are cumulative and de-pend on experienced histories. Empirical evidence is in favor of this view. Individuals who have been persistently poor are often discriminated against and “have little access to productive assets and low capabilities in term of health, education and social capital” (Chronic Poverty Research Centre, 2004, p.3). In addition, there is true state dependence in poverty status since the chances of being poor in the future are higher for individuals who are already poor, even after controlling for individual heterogeneity, observed and unobserved. “For example, the experience of poverty itself might induce a loss of moti-vation, lowering the chances that individuals with given attributes escape poverty in the future” (Cappellari and Jenkins, 2004, p.598). Regarding children, Bradbury, Jenkins and Micklewrite (2001) report that those who have been poor for a long time are worse off than those who are poor in a single period only. Walker (1995, p.103) writes that “When poverty predominantly occurs in long spells (...) the poor have virtually no chance of escaping from poverty and, therefore, little allegiance to the wider community.”
The path-independence property mentioned above can be called into question in other models of social evaluation as well. For example, in a framework where well-being is to be aggregated across time and across individuals, aggregating across individuals first means that, in the second step of the procedure, we do not have information on the period of life of an individual –only aggregate per-period information is available. Hence, a given per-period level of individual well-being has to be treated in the same way, no matter in which period of life this level is achieved. This seems to be rather counter-intuitive and restrictive, and the same reasoning applies to the issue of intertemporal poverty measurement considered here. See, for instance, Blackorby, Bossert and Donaldson (1996, 2005) for discussions.
Hoy and Zheng (2006) is, to the best of our knowledge, the only other contribution that addresses the issue of intertemporal poverty measurement axiomatically and provides characterization results. While axiomatic discussions are provided in Calvo and Dercon
(2007) and in Foster (2007) as well, characterizations are absent and, therefore, the axioms do not provide a justification for narrowing down the class of measures to those suggested in these papers because it is not established that they are the only ones with the requisite properties.
Our approach is not restricted to formulations involving a fixed poverty line–we allow for any method to obtain individual per-period poverty indicators. In particular, use of a relative poverty line, that is, using a percentage of average or median income as the poverty line is compatible with our framework, and this is the procedure that is used in the applied part of our paper. This is in contrast with Hoy and Zheng’s (2006) setting where a fixed poverty line is essential in order to ensure that their path-independence axiom is well-defined. Moreover, we do not assume the number of periods under consideration to be fixed, thus allowing for a richer set of possible comparisons as compared to those available in models where the time horizon is given.
The empirical and econometric literature on poverty measurement has recognized for some time the importance of being able to distinguish between chronic and transitory poverty and proposes alternative methods for capturing the relevant phenomenon; for surveys of this literature, see, among others, Rodgers and Rodgers (1993) and Jenkins (2000). Numerous applied contributions provide a detailed description of poverty persis-tence in various countries and help in shaping social policies but the measures used are established in an ad hoc fashion without much of a theoretical foundation. This paper contributes to this literature by filling this gap. Specifically, some of the empirical litera-ture involving persistence in poverty proceed by counting the proportion of people being poor in each period. Alternatively, the percentage of ‘long’ poverty spells or the sequence of multiple spells is used as a crude measure of intertemporal poverty. In order to try to include information on the intensity of poverty, some authors capture the temporal aspect of individual poverty by using a measure of permanent income and then applying standard (static) indices of poverty such as members of the Foster-Greer-Thorbecke class (Foster, Greer and Thorbecke, 1984) to the resulting distribution of permanent incomes. See, for instance, Rodgers and Rodgers (1993, p.31) who use as permanent income “the maximum sustainable annual consumption level that the agent could achieve with his or her actual income stream over the same T years, if the agent could save and borrow at prevailing interest rates.”
The main purpose of this paper is to provide an axiomatic foundation for the measure-ment of intertemporal poverty that differs from earlier approaches such as those of Hoy and Zheng (2006), Calvo and Dercon (2007) and Foster (2007) in the way persistence is
taken into consideration. Our measure pays attention to the length of individual poverty spells by assigning a higher level of poverty to situations where, ceteris paribus, poverty is experienced in consecutive rather than separated periods. In the theoretical part of the paper, we provide a characterization of our new class of measures. In addition, we characterize aggregate intertemporal poverty as the arithmetic mean of the individual intertemporal poverty indices. In the applied part of the paper, we use our new aggregate indices as well as measures suggested in the earlier literature to illustrate the commonali-ties and the differences with alternative approaches. The application pertains to poverty patterns among EU countries in the years from 1994 to 2001.
2
Individual Intertemporal Poverty Measures
This paper is concerned with the intertemporal aggregation of per-period individual poverty indicators (such as relative poverty gaps or their square values) over time and the across-society aggregation of these individual measures into a social measure of in-tertemporal poverty. We begin with a discussion of individual inin-tertemporal poverty and its link to what we refer to as persistence. Suppose that individual poverty indicators are observed in each of a non-empty and finite set of periods. A standard way of generating these per-period indicators consists of defining them, in each period, as the difference between a (constant or income-distribution-dependent) poverty line and the individual’s income divided by the poverty line if its income is below this poverty line and as equal to zero otherwise. We do not need to commit to a specific way of obtaining these indicators and treat them, for simplicity, as the primary inputs for our analysis.
The novel feature we suggest in intertemporal poverty measurement is to take into consideration the length of the poverty spells an individual is subjected to. For example, suppose two per-period individual poverty profiles are compared, where the first profile is given by (1/3, 1/2, 1/4, 1/2, 0) and the second by (1/3, 0, 1/2, 1/4, 1/2). We claim that individual intertemporal poverty should be higher in the first than in the second: in the second profile, the individual experiences a break from being in poverty rather than being poor in four consecutive periods.
Moreover, the length of spells out of poverty matters in the sense that, ceteris paribus, a longer break between poverty spells is better than a shorter break. For instance, suppose we have two per-period individual poverty profiles (1/2, 0, 1/3, 1/4, 0, 1/2) and (1/2, 0, 0, 1/3, 1/4, 0, 1/2). According to our hypothesis, the first of these profiles is asso-ciated with a higher value of individual intertemporal poverty. The two profiles involve
an identical triple of spells–namely, a one-period spell with a per-period poverty of 1/2, a two-period spell with poverty values of 1/3 and 1/4, and another one-period spell with poverty 1/2. However, there is one zero-poverty period separating the spells in the first profile but a break of two periods in the second and, thus, intertemporal poverty is lower in the second option.
As the second example illustrates, we include comparisons of poverty profiles of dif-ferent length (and profiles coming from societies of possibly different populations and population sizes); this is essential in order to perform international comparisons involving data sets with different sampling periods. Let Ω = ∪T ∈N RT+. For T ∈ N, an
individ-ual per-period individindivid-ual poverty profile of dimension T is a vector pi ∈ RT+, where pti
is individual i’s poverty experienced in period t ∈ {1, . . . , T }. An individual intertem-poral poverty measure is a function Pi: Ω → R+ where, for all pi ∈ Ω, Pi(pi) is the
intertemporal poverty experienced by person i.
The purpose of this paper is to formalize the idea that the lengths of poverty spells and the lengths of spells out of poverty affect individual intertemporal poverty. In this respect, our approach differs from that of Hoy and Zheng (2006). Furthermore, we do not restrict attention to environments with a fixed poverty line–we allow for any method to obtain individual per-period poverty indicators; in particular, the commonly-used procedure of using a percentage of average or median income as the poverty line is compatible with our setup, and this is the procedure that is used in the applied part of this paper.
The result of this section consists of a characterization of an individual intertemporal poverty measure that reflects the length-of-spell hypothesis mentioned above. This basic idea also motivates a characterization in the context of deriving measures of social exclu-sion from measures of individual deprivation (Bossert, D’Ambrosio and Peragine, 2007), where similar considerations apply. However, the axioms we employ are different and we obtain a different class of measures as a consequence.
The first property we impose on an individual intertemporal poverty measure requires that, in degenerate cases where there is only one period, individual intertemporal poverty and individual per-period poverty coincide.
One-period equivalence. For all pi ∈ R+,
Pi(pi) = pi.
As is standard in many issues involving social index numbers (see, for instance, Ebert and Moyes, 2000, in the context of individual deprivation measurement), we impose
de-composability properties both across spells and within spells. Across spells, that is, in situations where two groups of periods in poverty are separated by at least one period with zero poverty, we require individual intertemporal poverty to be equal to a weighted average of poverty experienced in each spell, where the weights are given by the propor-tional lengths of the two spells. The scope of the axiom is restricted to separate spells due to one of the features we want to highlight–the importance of the lengths of poverty spells and spells out of poverty.
Across-spells average decomposability. For all T ∈ N \ {1}, for all pi ∈ RT+ and for
all t ∈ {1, . . . , T − 1}, if pt i = 0 or p t+1 i = 0, then Pi(pi) = t T Pi(p 1 i, . . . , p t i) + T − t T Pi(p t+1 i , . . . , p T i ).
The second decomposability property applies to situations where there is but a single poverty spell–that is, the individual is in poverty in all T periods. Individual intertempo-ral poverty is a weighted average of individual poverty when the single spell is separated into two sets of periods. The weights involve an exponential expression in addition to the proportional lengths employed in the previous axiom. This is one possibility of requiring a superadditive structure in consecutive periods of poverty but it is clearly not the only one; alternative axioms, such as one that is based on linear rather than exponential weights (see Bossert, D’Ambrosio and Peragine, 2007), could be employed.
Single-spell exponential decomposability. There exists c ≥ 1 such that, for all T ∈ N \ {1}, for all pi ∈ RT++ and for all t ∈ {1, . . . , T − 1},
Pi(pi) = t T c T −tP i(p1i, . . . , p t i) + T − t T c tP i(pt+1i , . . . , p T i ).
The restriction c ≥ 1 is imposed to ensure that the resulting measures are superadditive in the lengths of poverty spells. For c = 1, the axiom extends the average-decomposability property of the previous axiom to within-spell situations.
According to the class of measures we propose in this paper, individual intertemporal poverty is calculated as the weighted average of the individual per-period poverty values where, for each period, the weight is given by a generalized exponential function with base γ ≥ 1. The argument of this exponential function is the length of the spell to which this period belongs minus one. To formalize this notion, consider any T ∈ N and pi ∈ RT+. For
t∈ {1, . . . , T } such that pt
including t with positive per-period poverty values. For t ∈ {1, . . . , T } such that pt i = 0,
let Dt(p
i)be the maximal number of consecutive periods including t with zero per-period
poverty. To illustrate this definition, consider the profile pi = (0, 1/2, 1/4, 1/3, 0, 0, 1/4)∈
R7
+. The length of the first non-poverty spell is one and, thus, D1(pi) = 1. This is followed
by a poverty spell of length three, which implies D2(p
i) = D3(pi) = D4(pi) = 3. The next
two periods are periods out of poverty and we obtain D5(p
i) = D6(pi) = 2. Finally, there
is a one-period poverty spell and we thus have D7(p i) = 1.
Foster’s (2007) measure is obtained when (i) attention is restricted to the chronically poor; (ii) no importance is given to persistence (that is, the parameter γ is equal to one); and (iii) the per-period individual poverty indicators are the gaps according to the indices belonging to the Foster-Greer-Thorbecke (1984) class.
Our class of individual intertemporal poverty measures, parameterized by γ ≥ 1, is now defined as Pγi(pi) = 1 T T X τ =1 γDτ(pi)−1pτ i
for all T ∈ N and for all pi ∈ RT+. For example, if γ = 2, the individual intertemporal
poverty associated with the profile pi = (0, 1/2, 1/4, 1/3, 0, 0, 1/4) is
P2i(pi) = 1 7 7 X τ =1 2Dτ(pi)−1pτ i = 1 7 ¡ 20· 0 + 22· 1/2 + 22· 1/4 + 22· 1/3 + 21· 0 + 21· 0 + 20· 1/4¢ = 1 7 (4· 1/2 + 4 · 1/4 + 4 · 1/3 + 1 · 1/4) = 55 84.
The axioms introduced above characterize the class Pγi. We obtain
Theorem 1 An individual intertemporal poverty measure Pi: Ω → R+ satisfies
one-period equivalence, across-spells average decomposability and single-spell exponential de-composability if and only if there exists γ ≥ 1 such that Pi = P
γ i.
Proof. ‘If.’ Let γ ≥ 1. That Pγi satisfies one-period equivalence is straightforward to verify.
To prove across-spells average decomposability, let T ∈ N \ {1}, pi ∈ RT+ and t ∈
{1, . . . , T − 1} be such that pt i = 0 or p t+1 i = 0. By definition of P γ i, we have t T P γ i(p 1 i, . . . , p t i) + T − t T P γ i(p t+1 i , . . . , p T i ) = 1 T t X τ =1 γDτ(p1i,...,pti)−1pτ i + 1 T T X τ =t+1 γDτ(pt+1i ,...,p T i)−1pτ i. (1)
Because pt
i = 0 or p t+1
i = 0, it follows that Dτ(p1i, . . . , pti) = Dτ(pi) for all τ ∈ {1, . . . , t}
such that pτ
i > 0and Dτ(p t+1
i , . . . , pTi ) = Dτ(pi)for all τ ∈ {t+1, . . . , T } such that pτi > 0.
Therefore, (1) implies t T P γ i(p 1 i, . . . , p t i) + T − t T P γ i(p t+1 i , . . . , p T i ) = 1 T T X τ =1 γDτ(pi)−1pτ i = P γ i(pi), as was to be established.
Let c = γ ≥ 1, T ∈ N\ {1}, pi ∈ RT++ and t ∈ {1, . . . , T − 1}. By definition of P γ i = Pci
and because Dτ(pi) = T for all τ ∈ {1, . . . , T }, it follows that
Pci(pi) = 1 T T X τ =1 cDτ(pi)−1pτ i = 1 T T X τ =1 cT −1pτi = c T −1 T T X τ =1 pτi = cT −1 T t X τ =1 pτi + cT −1 T T X τ =t+1 pτi = 1 T cT −1 ct−1 t X τ =1 ct−1pτi + 1 T cT −t cT −t−1 T X τ =t+1 cT −t−1pτi = t T c T −t Pc i(p1i, . . . , pti) + T − t T c tPc i(pt+1i , . . . , p T i )
and single-spell exponential decomposability is proven.
‘Only if.’ Now suppose Pi satisfies the axioms of the theorem statement. Let T ∈ N
and pi ∈ RT+. If T = 1, Pi(pi) = pi = Pγi(pi) for all γ ≥ 1 follows immediately from
one-period equivalence.
Now consider the case T ≥ 2. If pτ
i = 0 for all τ ∈ {1, . . . , T }, repeated application
of one-period equivalence and across-spells average decomposability implies Pi(pi) = 0 =
Pγi(pi) for all γ ≥ 1.
If there exists τ ∈ {1, . . . , T } such that pτ
i > 0, we proceed by induction on the number
of poverty spells.
Suppose first that there is only one poverty spell, which means that pi ∈ RT++ and,
equivalence and single-spell exponential decomposability, there exists c ≥ 1 such that Pi(pi) = c(T − 1) T Pi(p 1 i, . . . , pT −1i ) + cT −1 T Pi(p T i ) = c(T − 1) T µ c(T − 2) T − 1 Pi(p 1 i, . . . , pT −2i ) + cT −2 T − 1 p T −1 i ¶ + c T −1 T p T i = c 2(T − 2) T Pi(p 1 i, . . . , pT −2i ) + cT −1 T p T −1 i + cT −1 T p T i .. . = 1 T T X τ =1 cT −1pτi = Pγi(pi) (2) with γ = c ≥ 1.
To complete the induction argument, suppose (2) is true for all profiles with at most M ∈ {1, . . . , T − 1} poverty spells, and consider pi ∈ RT+ such that the number of poverty
spells is M + 1. Let t ∈ {1, . . . , T − 1} be such that the last poverty spell starts in period t + 1. By assumption, this implies that pt
i = 0; otherwise t + 1 would not represent
the beginning of a separate poverty spell. Thus, we can employ across-spells average decomposability twice to obtain
Pi(pi) = t T Pi(p 1 i, . . . , p t i) + T − t T Pi(p t+1 i , . . . , p T i ) = t T µ t− 1 t Pi(p 1 i, . . . , pt−1i ) + 1 t Pi(0) ¶ + T − t T Pi(p t+1 i , . . . , p T i ) = t− 1 T Pi(p 1 i, . . . , pt−1i ) + 1 TPi(0) + T − t T Pi(p t+1 i , . . . , p T i ).
By the induction hypothesis and one-period equivalence, it follows that Pi(pi) = t− 1 T P γ i(p 1 i, . . . , pt−1i ) + 0 + T − t T P γ i(p t+1 i , . . . , p T i) = 1 T t−1 X τ =1 γDτ(p1i,...,p t−1 i )−1pτ i + 1 Tp t i+ 1 T T X τ =t+1 γDτ(pt+1i ,...,pTi)−1pτ i. Because pt
i = 0 , it follows that Dτ(p1i, . . . , pt−1i ) = Dτ(pi) for all τ ∈ {1, . . . , t − 1} such
that pτ
i > 0 and Dτ(p t+1
i , . . . , pTi ) = Dτ(pi) for all τ ∈ {t + 1, . . . , T } such that pτi > 0,
which implies Pi(pi) = Pγi(pi).
3
Aggregate Intertemporal Poverty Measures
Given the individual intertemporal poverty measures Pγi for each individual in a society, we use an aggregate intertemporal poverty index to obtain an overall measure of poverty that
allows us to compare intertemporal poverty across societies, possibly involving different sampling periods and different populations and population sizes. Although it is possible to define an aggregate intertemporal measure from first principles (that is, using individual per-period poverty indicators as the basic objects to be aggregated into societal poverty), we proceed by implicitly assuming that the intertemporal aggregation is performed first (see the discussion in the Introduction) and the second step consists of aggregating these indicators across individuals in a society to arrive at an overall measure of intertemporal poverty. This choice is motivated primarily by our desire to keep the exposition simple. To describe the second part of the aggregation process, let Π = ∪n∈NRn+ and consider
a function P : Π → R+, to be interpreted as a measure that assigns an aggregate value
of intertemporal poverty to each vector of individual intertemporal poverty values. To justify the rich domain of this measure, assume that the procedure to aggregate individual intertemporal poverty is independent of the specific way the per-period individual poverty values are determined–in particular, they could be determined by poverty gaps divided by a fixed poverty line (or the squares of these values) for any given level of this fixed poverty line. It is clear that, for any population size n ∈ N, any vector p = (p1, . . . , pn) ∈ Rn+
of individual intertemporal poverty values according to the measure characterized in the previous section can be obtained by choosing a suitable poverty line and a suitable income distribution so that the resulting vector of individual intertemporal poverty measures is given by p.
The aggregate intertemporal poverty measure we propose is defined as average indi-vidual intertemporal poverty, that is, we employ the index PΓ defined by
PΓ(p) = 1 n n X i=1 pi (3)
for all n ∈ N and for all p ∈ Rn
+. We view aggregate poverty as an ordinal variable
and, thus, any increasing transformation of PΓ can equivalently be employed. Of course, individual intertemporal poverty measures must contain more than ordinal and interper-sonally non-comparable information–clearly, the definition of PΓis incompatible with the assumption that the p carry ordinally measurable and interpersonally non-comparable in-formation only. We provide a characterization of PΓ that is based on results in population
ethics due to Blackorby, Bossert and Donaldson (2002, 2005). However, we provide a self-contained proof because the domain we consider here is different from the one in these contributions.
The first axiom is a weak monotonicity property. It requires that, in situations where the level of individual poverty is equal across individuals, aggregate intertemporal poverty
is increasing in individual intertemporal poverty. The scope of the axiom is restricted to comparisons involving a given population size. For any n ∈ N, let 1n denote the vector
consisting of n ones.
Minimal increasingness. For all n ∈ N and for all a, b ∈ R+, if a > b, then
P(a1n) > P(b1n).
Minimal increasingness is a very mild monotonicity requirement because it applies to equal distributions of individual intertemporal poverty and to fixed-population-size comparisons only.
The second axiom we impose on P is an impartiality property with respect to increases or decreases in individual poverty. If a single individual’s intertemporal poverty level changes by a given amount, it does not matter whose poverty changes. Let n ≥ 2. We use the notation 1jn for the vector w ∈ Rn+ such that wj = 1 and wi = 0 for all
i∈ {1, . . . , n} \ {j}.
Incremental equity. For all n ∈ N \ {1}, for all p ∈ Rn+, for all d ∈ R and for all j, k ∈ {1, . . . , n} with j 6= k, if (p + d1jn)∈ Rn+ and (p + d1kn)∈ Rn+, then
P¡p+ d1jn
¢
= P¡p+ d1kn
¢ .
Minimal increasingness and incremental equity together characterize ordinal aggregate poverty measures based on average (or total) individual poverty for any fixed population size; see Blackorby, Bossert and Donaldson (2002, 2005). However, further axioms are needed to extend this characterization to the entire domain Π, that is, to aggregate poverty comparisons that may involve different population sizes. One possibility is to require that average individual poverty is a critical level for any poverty vector p ∈ Π; see, again, Blackorby, Bossert and Donaldson (2005) for a detailed discussion. That is, aggregate poverty is unaffected if an individual with average poverty is added to a given distribution p ∈ Π.
Average critical levels. For all n ∈ N and for all p ∈ Rn+,
P Ã p,1 n n X i=1 pi ! = P(p).
The three axioms defined above characterize the class of all aggregate poverty measures that are ordinally equivalent to PΓ. The axioms can be motivated further by noting
that they are implied by other properties with intuitive interpretations. For instance, minimal increasingness is a consequence of standard increasingness, incremental equity is implied by a fixed-population information-invariance property and average critical levels is implied by increasingness, the existence of critical levels and a variable-population information-invariance condition; see Blackorby, Bossert and Donaldson (2005, Chs. 4—6) for a detailed discussion. In the statement of the following theorem, we use ◦ to denote function composition.
Theorem 2 An aggregate intertemporal poverty measure P satisfies minimal increasing-ness, incremental equity and average critical levels if and only if there exists an increasing function ϕ : R+ → R+ such that P = ϕ ◦ PΓ.
Proof. That any increasing transformation of PΓ satisfies minimal increasingness, incre-mental equity and average critical levels is straightforward to verify.
Conversely, suppose that P satisfies the three axioms. If n = 1, minimal increasingness alone implies the result.
Now let n ≥ 2. Consider p ∈ Rn
+ and j, k ∈ {1, . . . , n} with j 6= k, and suppose
d∈ R+ is such that pj ≥ d. By incremental equity,
P(p− d1jn+ d1kn) = P(p− d1jn+ d1jn) = P(p). (4) Let p ∈ Rn
+ and suppose, without loss of generality, that p1 ≥ p2 ≥ . . . ≥ pn. By
(repeated if necessary) application of (4), it follows that P(p) = P Ã p1− Ã p1− 1 n n X i=1 pi ! , p2, . . . , pn+ Ã p1− 1 n n X i=1 pi !! = P Ã 1 n n X i=1 pi, p2, . . . , pn+ p1− 1 n n X i=1 pi ! .. . = P Ã 1 n n X i=1 pi, 1 n n X i=1 pi, . . . , n X i=1 pi− n− 1 n n X i=1 pi ! = P ÃÃ 1 n n X i=1 pi ! 1n ! .
Together with minimal increasingness, this implies P(p)≥ P(q) ⇔ P ÃÃ 1 n n X i=1 pi ! 1n ! ≥ P ÃÃ 1 n n X i=1 qi ! 1n ! ⇔ n1 n X i=1 pi ≥ 1 n n X i=1 qi ⇔ PΓ(p)≥ PΓ(q) ⇔ ϕ(PΓ(p))≥ ϕ(PΓ(q)) (5)
for all n ∈ N, for all p, q ∈ Rn+ and for all increasing functions ϕ : R+ → R+. Thus, all
fixed-population-size comparisons must be performed according to PΓ.
Now consider n, m ∈ N such that n 6= m, p ∈ Rn+ and q ∈ Rm+. Without loss of
generality, suppose n > m. By (repeated if necessary) application of average critical levels, we obtain P(q) = P Ã q, 1 m m X i=1 qi ! = . . . = P Ã q, Ã 1 m m X i=1 qi ! 1n−m ! and, therefore, P(p)≥ P(q) ⇔ P(p) ≥ P Ã q, Ã 1 m m X i=1 qi ! 1n−m ! . (6)
Because p and (q, ((1/m)Pmi=1qi)1n−m) have the same population size n, (5) implies
P(p)≥ P à q, à 1 m m X i=1 qi ! 1n−m ! ⇔ 1 n n X i=1 pi ≥ 1 n à m X i=1 qi+ n− m m m X i=1 qi ! ⇔ n X i=1 pi ≥ m X i=1 qi+ n− m m m X i=1 qi which implies P(p)≥ P à q, à 1 m m X i=1 qi ! 1n−m ! ⇔ n1 n X i=1 pi ≥ 1 m m X i=1 qi. By (6), we obtain P(p)≥ P(q) ⇔ 1 n n X i=1 pi ≥ 1 m m X i=1 qi ⇔ PΓ(p)≥ PΓ(q) ⇔ ϕ(PΓ(p))≥ ϕ(PΓ(q))
4
An Application to European Countries
The purpose of this section is to illustrate the aggregate measure of poverty, PΓas defined
in (3) with individual intertemporal poverty measures pi given by Pγi(pi)for different
pa-rameter values γ, using the European Community Household Panel (ECHP). We base our analysis on all the waves available in ECHP, which cover the period from 1994 to 2001. The surveys are conducted at a European national level. We do not aim at providing an accurate analysis of poverty persistence in EU countries, hence we take the available years as such without considering the possibility that poverty spells are censored at the beginning or at the end of the sample we observe. (For a discussion of these estimation techniques see, among others, Bane and Ellwood, 1986, and Jenkins, 2000.) The ECHP is an ambitious effort at collecting information on the living standards of the households of the EU member states using common definitions, information collection methods and editing procedures. It contains detailed information on incomes, socio-economic charac-teristics, housing amenities, consumer durables, social relations, employment conditions, health status, subjective evaluation of well-being, etc.. Of the 15 EU member states, we could not consider Sweden since the data for this country is cross-sectional only. For Fin-land and Austria, data were not available for all the waves. While the former joined from wave three onwards, the Austrian data are available beginning with the second wave. The full ECHP data format for the UK, Germany and Luxembourg is available only for the years 1994—1996. We therefore use the ECHP data format derived from national surveys instead. These data are available for the UK and Germany for 1994—2001; for Luxem-bourg, on the other hand, they are available from 1995 onwards only. For this reason, Luxembourg, like Austria, was included from the second wave onwards. The unit of our analysis is the individual. The calculation uses required sample weights. Since we are interested in analyzing poverty spells and the effect of persistence in the state of poverty, we consider only individuals that were interviewed in all the waves for each country. The variable studied is net yearly household income equivalized using the OECD-modified equivalence scale in order to account for different household size and composition. For each country and for each period in the sample, the poverty line is set to 60% of the national median. Thus, for any given per-period income distribution yt, the poverty line
in this period, zt(yt), is given by 0.6 times the median of yt. An individual is classified as
poor if its income is strictly below the poverty line.
It has been assumed that the parameter γ takes on its values in the set {1, . . . , 10}. An increase in the value of γ indicates that higher weight is assigned to the persistence
of individual poverty.
For the per-period individual poverty indicators, we choose three among the most commonly used ones in empirical studies, namely, the normalized relative gaps raised to the power α ∈ {0, 1, 2} so that, for any period t ∈ N,
pti = ⎧ ⎨ ⎩ ³zt(yt)−yt i zt(yt) ´α if yt i < zt(yt), 0 if yti ≥ zt(yt).
The individual index is then the product of two components: the weight and the individual poverty indicator. When α = 0, the individual poverty indicator captures only the number of periods spent in poverty. In this case, pt
i assumes the value one for
those in poverty and zero for everybody else. This individual index is similar in spirit to the head-count ratio. When α = 1, we consider not only the incidence of poverty but also its intensity since we take into account how poor each poor individual is expressed as a proportion of the poverty line. In this case, the index resembles the normalized poverty gap. When α = 2, the normalized gaps are squared. As a result, we give more importance to poorer individuals as opposed to those poor whose income is less distant from the poverty line.
When the parameter γ is equal to one, persistence does not play a role. This is the only case where aggregating first across time and then across individuals produces exactly the same results as the reverse order of aggregation does, that is, aggregating first across individuals and then across time. The aggregate index coincides with the average of per-period standard poverty indices. If, in addition, α = 0, the aggregate index is the average of the per-period head-count ratios; if α = 1, it is the average of the aggregate normalized poverty gap indices; and, lastly, if α = 2, it is the average of the aggregate squared normalized poverty gaps.
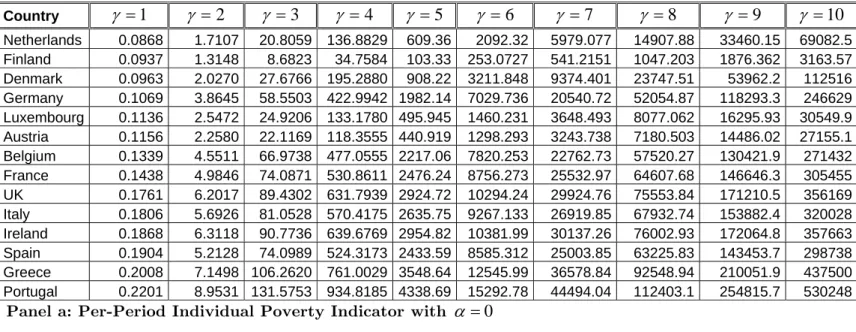
Results are contained in Table 1, while in Table 2 we report the rankings of the countries under alternative indices. In the first column the names of the countries are reported while the following ten columns present poverty indicators for different values of γ. In Panel a, the individual poverty indicators capture only the incidence of poverty and when γ = 1, the index is the mean of per-period head-count ratios. In Panel b, the intensity of poverty plays a role and when γ = 1 the index is the mean of per-period normalized poverty gaps. In Panel c, the shortfalls from the poverty line (as a proportion of the line itself) are squared and when γ = 1 the index is the mean of per-period normalized squared poverty gaps. The results show that persistence in a state of poverty does play a major role in poverty measurement. It constitutes relevant information and its
omission would not give a correct picture of the phenomenon. As the weight of persistence in the index increases, the rankings of the countries change, particularly among the least poor. Portugal, followed by Greece, is indeed always the poorest country among those under analysis. At the opposite end of the ranking the situation is very different. Finland occupies the second position according to standard poverty measurement, that is when γ = 1; as soon as we increase the value of the persistence parameter to 2 Finland jumps to the first position implying that there is less persistence in poverty in this country than in the Netherlands when α = 0, and in Denmark for the other two cases. Of high interest is the case of Denmark and Austria. Poverty is a very different phenomenon in these countries. Denmark’s position worsens heavily as the weight of persistence considerations increases for all individual poverty indicators: it is relegated from the first to the fourth (see Panel b) or fifth (see Panel c) position and from the third to the fifth when the intensity of poverty is not considered (see Panel a). Austria, on the other hand, experiences the reverse phenomenon moving from the sixth to the third (see Panel b and c) or to the second (see Panel a) position. Similar observations apply to Luxembourg (with one exception in Panel b, third column). From a social policy point of view the discovery of this temporal characteristic of poverty should lead to different recommendations: in a country like Denmark, for example, policy should aim at helping individuals and households to escape from poverty; in Austria, on the other hand, a more effective policy would be one preventing individuals from becoming poor.
5
Concluding Remarks
Individuals live and time is an important aspect of their lives. Experiences matter and persistence of experiences could matter more, as in the case of poverty. The indices we propose aim at adding past experiences to the incidence of poverty and inequality among those who are poor when measuring poverty. Information on the time spent in poverty should not be neglected. The results of our simple application to EU countries show that a very different picture can emerge when we value individuals’ experiences.
Various extensions of the approach proposed in this paper are possible.
We restrict attention to the intertemporal aggregation of per-period overall poverty in this paper. However, our approach can be modified easily in order to obtain a measure of chronic poverty (Foster, 2007) based on the idea underlying our new index. To do so, chronic poverty can be defined by setting an additional duration line and declaring an individual to be chronically poor if there is at least one poverty spell of at least a given
length and then perform the aggregation over individuals by calculating the arithmetic mean of the poverty values only of all those satisfying this criterion.
Further works could in addition perform statistical inference with the indices we pro-posed and consider the possibility when estimating intertemporal poverty that poverty spells are censored.
References
Bane, M.J. and D.T. Ellwood (1986), “Slipping Into and Out of Poverty: The Dynamics of Spells,” Journal of Human Resources, 21, 1—23.
Blackorby, C., W. Bossert and D. Donaldson (1996), “Intertemporally Consistent Popu-lation Ethics: Classical Utilitarian Principles,” in: K. Arrow, A. Sen and K. Suzumura (eds.), Social Choice Re-Examined, Vol. 2, Macmillan, London, pp. 137—162.
Blackorby, C., W. Bossert and D. Donaldson (2002), “Utilitarianism and the Theory of Justice,” in: K. Arrow, A. Sen and K. Suzumura (eds.), Handbook of Social Choice and Welfare, Vol. 1, Elsevier, Amsterdam, pp. 543—596.
Blackorby, C., W. Bossert and D. Donaldson (2005), Population Issues in Social Choice Theory, Welfare Economics, and Ethics, Cambridge University Press, Cambridge.
Bossert, W., C. D’Ambrosio and V. Peragine (2007), “Deprivation and Social Exclusion,” Economica, 74, 777—803.
Bradbury, B., S.P. Jenkins and J. Micklewrite (eds.) (2001), The Dynamics of Child Poverty in Industrialised Countries, Cambridge University Press, Cambridge.
Calvo, C. and S. Dercon (2007), “Chronic Poverty and All That: The Measurement of Poverty Over Time,” Chronic Poverty Research Centre, Working Paper No. 89.
Cappellari, L. and S.P. Jenkins (2004), “Modelling Low Income Transitions,” Journal of Applied Econometrics, 19, 593—610.
Chronic Poverty Research Center (2004), “The Chronic Poverty Report No. 2004-05,” downloaded from www.chronicpoverty.org.
Ebert, U. and P. Moyes (2000), “An Axiomatic Characterization of Yitzhaki’s Index of Individual Deprivation,” Economics Letters, 68, 263—270.
Foster, J.E. (2007), “A Class of Chronic Poverty Measures,” Department of Economics, Vanderbilt University, Working Paper No. 07-W01.
Foster, J.E., J. Greer and E. Thorbecke (1984), “A Class of Decomposable Poverty In-dices,” Econometrica, 52, 761—766.
Hoy, M. and B. Zheng (2006), “Measuring Lifetime Poverty,” paper presented at the 8th International Meeting of the Society for Social Choice and Welfare, Istanbul.
Jenkins, S.P. (2000), “Modelling Household Income Dynamics,” Journal of Population Economics, 13, 529—567.
Rodgers, J.R. and J.L. Rodgers (1993), “Chronic Poverty in the United States,” Journal of Human Resources, 28, 25—54.
Sen, A.K. (1976), “Poverty: An Ordinal Approach to Measurement,” Econometrica, 44, 219—231.
Walker, R. (1995), “The Dynamics of Poverty and Social Exclusion,” in Room, G. (ed.) Beyond the Threshold, The Policy Press, Bristol.
Table 1: Aggregate Intertemporal Poverty in EU Member States (Index Values).
Panel a: Per-Period Individual Poverty Indicator with α =0
Country γ =1 γ =2 γ =3 γ =4 γ =5 γ =6 γ =7 γ =8 γ =9 γ =10 Denmark 0.0175 0.3780 5.1994 36.7818 171.2735 606.134 1769.95 4485.15 10194.18 21259.69 Finland 0.0175 0.2573 1.7070 6.8448 20.3677 49.91639 106.8015 206.728 370.5226 624.8557 Luxembourg 0.0206 0.5316 5.2963 28.4377 106.1073 312.741 781.9052 1731.73 3494.949 6553.489 Netherlands 0.0235 0.4516 5.5139 36.2835 161.3318 553.1483 1578.484 3930.76 8812.724 18177.42 Germany 0.0279 1.1359 17.3123 125.0316 585.4653 2075.033 6060.015 15351 34872.57 72684.86 Austria 0.0283 0.6516 6.6158 35.8669 134.5147 397.7055 996.4105 2210.13 4465.517 8380.908 Belgium 0.0315 1.1247 16.9126 121.8367 570.2505 2021.311 5904.618 14961.6 33997.28 70878.3 France 0.0328 1.3367 20.4430 147.8494 692.8390 2456.778 7177.283 18185.6 41319.83 86135.65 Ireland 0.0351 1.2929 19.0648 135.7653 630.8301 2224.916 6475.882 16364 37104.05 77221.22 UK 0.0480 1.8914 27.6901 196.6636 912.8886 3218.433 9366.074 23665.9 53659.66 111678.2 Italy 0.0578 2.2606 33.1681 235.7147 1094.5230 3859.727 11234.5 28391.4 64382.98 134011.1 Spain 0.0581 1.8840 27.4036 195.1768 908.7242 3211.807 9365.813 23704.4 53820.46 112140.8 Greece 0.0671 2.9364 44.6910 322.0719 1505.9580 5332.223 15561.26 39397.5 89460.2 186396.7 Portugal 0.0715 3.3758 50.0419 355.4550 1647.7750 5801.189 16861.48 42560.5 96415.88 200513.3
Panel b: Per-Period Individual Poverty Indicator with α =1
Country γ =1 γ =2 γ =3 γ =4 γ =5 γ =6 γ =7 γ =8 γ =9 γ =10 Denmark 0.0056 0.0992 1.3033 9.1169 42.2823 149.3645 435.740 1103.585 2507.471 5228.14 Finland 0.0059 0.0793 0.5147 2.0485 6.0753 14.8631 31.768 61.451 110.090 185.599 Luxembourg 0.0059 0.1519 1.5143 8.1353 30.3695 89.5458 223.948 496.111 1001.440 1878.14 Ireland 0.0114 0.3899 5.7941 41.5052 193.5661 684.3954 1995.546 5049.284 11460.650 23871.7 Netherlands 0.0122 0.2036 2.4307 15.7959 69.5609 236.6840 671.277 1663.274 3713.604 7633.16 Austria 0.0123 0.3003 3.1078 16.9823 63.9600 189.6012 475.878 1056.913 2137.572 4014.91 Germany 0.0131 0.5138 7.7770 56.0281 262.0120 927.8723 2708.255 6857.545 15573.150 32450.7 Belgium 0.0133 0.4570 6.9459 50.3817 236.8219 841.8787 2464.427 6254.398 14229.440 29695.2 France 0.0135 0.5059 7.7562 56.2118 263.7342 935.9132 2735.656 6934.250 15760.110 32861.4 UK 0.0217 0.8793 12.9039 91.6582 425.3578 1499.1520 4361.445 11017.440 24975.090 51968.6 Spain 0.0290 0.9857 14.4119 102.7987 479.0183 1694.0250 4942.021 12512.280 28416.810 59223.1 Italy 0.0306 1.2719 18.8898 134.8874 627.9591 2218.0350 6463.242 16347.010 37093.050 77245.9 Greece 0.0329 1.5105 23.1207 166.8333 780.4162 2763.7310 8066.126 20422.240 46373.550 96622.9 Portugal 0.0371 1.7591 25.8889 183.0247 845.7083 2970.5050 8618.869 21725.570 49163.440 102153
Panel c: Per-Period Individual Poverty Indicator with α =2
Country γ =1 γ =2 γ =3 γ =4 γ =5 γ =6 γ =7 γ =8 γ =9 γ =10 Netherlands 0.0868 1.7107 20.8059 136.8829 609.36 2092.32 5979.077 14907.88 33460.15 69082.5 Finland 0.0937 1.3148 8.6823 34.7584 103.33 253.0727 541.2151 1047.203 1876.362 3163.57 Denmark 0.0963 2.0270 27.6766 195.2880 908.22 3211.848 9374.401 23747.51 53962.2 112516 Germany 0.1069 3.8645 58.5503 422.9942 1982.14 7029.736 20540.72 52054.87 118293.3 246629 Luxembourg 0.1136 2.5472 24.9206 133.1780 495.945 1460.231 3648.493 8077.062 16295.93 30549.9 Austria 0.1156 2.2580 22.1169 118.3555 440.919 1298.293 3243.738 7180.503 14486.02 27155.1 Belgium 0.1339 4.5511 66.9738 477.0555 2217.06 7820.253 22762.73 57520.27 130421.9 271432 France 0.1438 4.9846 74.0871 530.8611 2476.24 8756.273 25532.97 64607.68 146646.3 305455 UK 0.1761 6.2017 89.4302 631.7939 2924.72 10294.24 29924.76 75553.84 171210.5 356169 Italy 0.1806 5.6926 81.0528 570.4175 2635.75 9267.133 26919.85 67932.74 153882.4 320028 Ireland 0.1868 6.3118 90.7736 639.6769 2954.82 10381.99 30137.26 76002.93 172064.8 357663 Spain 0.1904 5.2128 74.0989 524.3173 2433.59 8585.312 25003.85 63225.83 143453.7 298738 Greece 0.2008 7.1498 106.2620 761.0029 3548.64 12545.99 36578.84 92548.94 210051.9 437500 Portugal 0.2201 8.9531 131.5753 934.8185 4338.69 15292.78 44494.04 112403.1 254815.7 530248
Table 2: Aggregate Intertemporal Poverty in EU Member States (Rankings). Country γ =1 γ =2 γ =3 γ =4 γ =5 γ =6 γ =7 γ =8 γ =9 γ =10 Netherlands 1 2 2 4 4 4 4 4 4 4 Finland 2 1 1 1 1 1 1 1 1 1 Denmark 3 3 5 5 5 5 5 5 5 5 Germany 4 6 6 6 6 6 6 6 6 6 Luxembourg 5 5 4 3 3 3 3 3 3 3 Austria 6 4 3 2 2 2 2 2 2 2 Belgium 7 7 7 7 7 7 7 7 7 7 France 8 8 8 9 9 9 9 9 9 9 UK 9 11 11 11 11 11 11 11 11 11 Italy 10 10 10 10 10 10 10 10 10 10 Ireland 11 12 12 12 12 12 12 12 12 12 Spain 12 9 9 8 8 8 8 8 8 8 Greece 13 13 13 13 13 13 13 13 13 13 Portugal 14 14 14 14 14 14 14 14 14 14
Panel a: Per-Period Individual Poverty Indicator with α =0
Country γ =1 γ =2 γ =3 γ =4 γ =5 γ =6 γ =7 γ =8 γ =9 γ =10 Denmark 1 2 2 5 5 5 5 5 5 5 Finland 2 1 1 1 1 1 1 1 1 1 Luxembourg 3 4 3 2 2 2 2 2 2 2 Netherlands 4 3 4 4 4 4 4 4 4 4 Germany 5 7 7 7 7 7 7 7 7 7 Austria 6 5 5 3 3 3 3 3 3 3 Belgium 7 6 6 6 6 6 6 6 6 6 France 8 9 9 9 9 9 9 9 9 9 Ireland 9 8 8 8 8 8 8 8 8 8 UK 10 11 11 11 11 11 11 10 10 10 Italy 11 12 12 12 12 12 12 12 12 12 Spain 12 10 10 10 10 10 10 11 11 11 Greece 13 13 13 13 13 13 13 13 13 13 Portugal 14 14 14 14 14 14 14 14 14 14
Panel b: Per-Period Individual Poverty Indicator with α =1
Country γ =1 γ =2 γ =3 γ =4 γ =5 γ =6 γ =7 γ =8 γ =9 γ =10 Denmark 1 2 2 3 3 3 3 4 4 4 Finland 2 1 1 1 1 1 1 1 1 1 Luxembourg 3 3 3 2 2 2 2 2 2 2 Ireland 4 6 6 6 6 6 6 6 6 6 Netherlands 5 4 4 4 5 5 5 5 5 5 Austria 6 5 5 5 4 4 4 3 3 3 Germany 7 9 9 8 8 8 8 8 8 8 Belgium 8 7 7 7 7 7 7 7 7 7 France 9 8 8 9 9 9 9 9 9 9 UK 10 10 10 10 10 10 10 10 10 10 Spain 11 11 11 11 11 11 11 11 11 11 Italy 12 12 12 12 12 12 12 12 12 12 Greece 13 13 13 13 13 13 13 13 13 13 Portugal 14 14 14 14 14 14 14 14 14 14