Auroral streamers and magnetic flux closure.
1
B. Hubert
(1), K. Kauristie
(2), O. Amm
(2), S. E. Milan
(3), A. Grocott
(3), S. W. H.
2
Cowley
(3)and T. I. Pulkkinen
(2)3
1. Laboratory for Planetary and Atmospheric Physics, University of Liège, Belgium
4
2. Finnish Meteorological Institute, Space Research, Helsinki, Finland
5
3. Department of Physics & Astronomy, University of Leicester, Leicester LE1 7RH, UK
6
On 7 December 2000 at 2200 UT an auroral streamer was
7
observed to develop above Scandinavia with the IMAGE-FUV
8
global imagers. The ionospheric equivalent current deduced from
9
the MIRACLE-IMAGE Scandinavian ground-based network of
10
magnetometers is typical of a substorm-time streamer.
11
Observations of the proton aurora using the SI12 imager onboard
12
the IMAGE satellite are combined with measurements of the
13
ionospheric convection obtained by the SuperDARN radar
14
network to compute the dayside merging and nightside flux
15
closure rates. On the basis of this and other similar events, it is
16
found that auroral streamers appear during the period of most
17
intense flux closure in the magnetotail, most often shortly after
18
substorm onset. The ionospheric convection velocity, as measured
19
by SuperDARN, appears to be reduced in the vicinity of the
20
streamer, suggesting de-coupling of magnetospheric and
21
ionospheric plasma flows in the region of enhanced ionospheric
22
conductance.
23
1. Introduction
24
Streamers are auroral features which extend roughly in the
north-25
south direction, that have been unambiguously related to bursty
26
bulk flows (BBF) in the magnetotail [Amm and Kauristie, 2002,
27
and references therein]. They are characterized by enhanced
field-28
aligned currents at their dusk and dawn edges, the current being
29
oriented downward (upward) along the eastern (western)
30
boundary. Several studies have suggested that reconnection plays
31
a role in the dynamics of BBFs [Angelopoulos et al., 1992;
32
Shiokawa et al., 1997; Fairfield et al., 1999, Chen and Wolf,
33
1993].
34
We have developed of a method that combines global remote
35
sensing of the proton aurora with SI12 and measurements of the
36
ionospheric convection with SuperDARN to estimate the location
37
of the open/closed field line boundary, the open flux and the
38
opening and closure rates of magnetic flux [Hubert et al., 2006 a].
39
The accuracy of the method was discussed by Hubert et al. [2006
40
a]. The electric field in the frame of reference of the moving
41
open-closed boundary is computed and integrated along the
42
boundary to retrieve the opening and closure reconnection rates.
43
This method has already been applied to several substorm cycles
44
and to cases of interplanetary shocks [Hubert et al., 2006 a,b]. In
45
the present work, we use the method to investigate the relative
46
contribution of auroral streamers in global magnetic flux transfer
47
during a substorm event. The role of BBFs as flux carriers have
48
been estimated e.g. by Angelopoulos et al., (1992) from the basis
49
of magnetospheric in situ observations which provide accurately
50
plasma flow characteristics but lack the global context.
51
2. Observation of a streamer
52
2.1. Data availability.
53
Images of the proton aurora were recorded by the SI12 instrument
54
of the IMAGE satellite [Mende et al., 2000]. The velocity of the
55
1
2
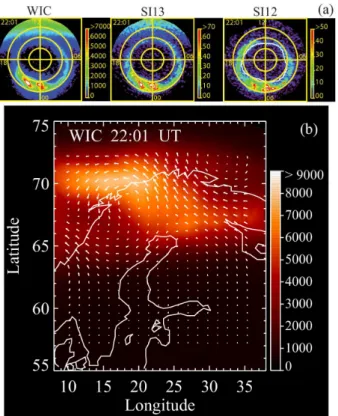
Figure 1. a) Polar view of the IMAGE-FUV WIC, SI13 and SI12
3
images (magnetic coordinates), with the open/closed field line
4
boundary overlaid on the SI12 image at 2201 UT. b) Map of
5
the ionospheric equivalent currents above Scandinavia
6
(geographic coordinates) in arbitrary units, with the auroral
7
signal from the WIC image in AD units.
8
9
ionospheric convection is obtained from the Super Dual Auroral
10
Radar Network (SuperDARN) measurements, and the ionospheric
11
electric field is deduced by applying the method developed by
12
Ruohoniemi and Baker [1998]. The Wide band Imaging Camera
13
(WIC) and the Spectrographic Imager at 135.6 nm (SI13)
14
instruments of the IMAGE-FUV experiment, which are mostly
15
sensitive to the emissions of the electron aurora, are also used to
16
examine the morphology of the auroral features.
17
On 7 December 2000, the IMAGE-FUV instruments observed a
18
substorm expansion following an onset at 2147 UT. The event
19
started after an interval of southward IMF which had led to the
20
accumulation of open magnetic flux, as evidenced below by the
21
expansion of the auroral oval. The substorm activity was seen as a
22
~550 nT disturbance in the AE indices. At 2158 UT WIC
23
recorded first signatures of the formation of north-south aligned
24
auroral structures within the auroral bulge. The clearest images of
25
two coincidental auroral streamers were acquired by the WIC and
26
SI13 imagers around 2202 UT (Figure 1a) while by 2206 UT the
27
structures had faded away. One of the streamers was located
28
above northern Scandinavia, which makes it possible to combine
29
space-based data with the ground based observations in that
30
region (midnight). For the other streamer which was located in the
31
~2200 MLT sector, ground-based data are not available. The
32
open-closed field line boundary determined from the SI12 image
33
at 2201 UT, when the streamers were formed, is presented in
34
Figure 1a. SuperDARN data were available at that time. The data
35
coverage was moderately good.Echoes were recorded above
36
Scandinavia, where the midnight streamer is observed, and above
37
Iceland, not far from the location of the second streamer, thus
38
allowing to constrain the fit used to obtain the ionospheric electric
39
Figure 2. East-west equivalent currents (negative values
2
correspond to westward currents, unit A/m) deduced from the
3
MIRACLE - IMAGE magnetometer network, with the SI12
4
open/closed boundary overlaid in black (MLT≈UT+2.5).
5
6
field in the region of interest.
7
2.2. Ionospheric equivalent current, and FUV observations.
8
The ionospheric equivalent current pattern was retrieved using the
9
MIRACLE-IMAGE magnetometer chain operated in Scandinavia
10
(Figure 1b) [Amm and Viljanen, 1999 a]. The streamer develops
11
shortly after 2200 UT following the expansion onset at 2147 UT.
12
A map of equivalent current (EC) obtained at 2201 UT is
13
presented in Figure 1b, with the corresponding part of WIC image
14
overlaid. The EC pattern of figure 1b presents strong poleward
15
currents flowing roughly along the streamer direction and a
16
counterclockwise vortex on the western side of the current
17
channel, consistently with previous studies [Amm et al., 1999 b,
18
Kauristie et al., 2003]. Assuming an homogeneous conductance,
19
this vortex can be associated with upward field aligned currents
20
(FACs). When the streamer developed, the westward equivalent
21
current moved poleward in concert with the poleward motion of
22
the polar cap boundary deduced from the SI12 observations.
23
Figure 2 shows the EC intensity versus latitude and time in the
24
midnight sector as deduced from upward continuated
25
magnetometer data [Mersmann et al., 1979] with the polar cap
26
boundary identified from SI12 overplotted in black. This figure
27
suggests a close relationship between the poleward boundary of
28
the electrojet, the poleward optical boundary of the
Doppler-29
shifted Lyman-α emission and the polar cap boundary.
30
2.3. Reconnection at the northern edge of the streamer.
31
The location and motion of the open-closed field line boundary
32
have been retrieved from the SI12 auroral images. The
33
ionospheric electric field deduced from the SuperDARN data is
34
then coupled with these results to estimate the electric field in the
35
reference frame of the moving boundary, and hence the
36
reconnection rates. Figure 3a shows a UT-MLT plot of the
37
differential reconnection voltage along the open-closed boundary
38
δMLT
δV (with MLT given in degrees), i.e. the voltage per unit
39
MLT degree, which is proportional to
E
d
l
r
r
⋅
. Red (blue) shades40
correspond to negative (positive) voltages, i.e. a closure of open
41
(opening of closed) magnetic flux, respectively. The flux closure
42
rate was clearly intensified in the midnight sector around the time
43
of streamer appearance. Closure rates were high between 1800
44
and 0100 MLT and, in particular along field lines threading the
45
poleward edges of both streamers. A more global view is shown
46
in Figure 3b-d where we present both the open magnetic flux
47
(panel b) and opening and closure voltages (panels c and d)
48
deduced from the IMAGE-FUV and SuperDARN observations.
49
1
Figure 3. Differential reconnection voltage (a), open flux (b),
2
opening voltage (c) and closure voltage (d) obtained from
3
SI12 and SuperDARN observations on 7 December 2000. The
4
solid vertical line indicates the substorm onset, and the dotted
5
vertical lines indicate the development of the auroral streamer.
6
7
Due to reconnection at the dayside magnetopause, the
8
magnetosphere accumulates up to ~0.9 GWb of open flux until
9
the onset of the substorm expansion phase. The flux closure
10
voltage then reaches ~150 kV around 2200 UT, indicating very
11
intense nightside reconnection at that time.
12
We have also integrated E dl
r r
⋅ along the open/closed boundary in
13
the MLT sector corresponding to the poleward edge of the
14
observed streamer (2255 to 2330 MLT) to determine the
15
associated closure voltage (Figure 4). A strong increase of the
16
reconnection voltage is observed around 2200 UT, reaching a
17
maximum of ~25 kV. The oscillations observed in the closure
18
voltage in Figure 3 between 2200 and 2330 UT with a period of
19
roughly 30 min are also found when we restrict our attention to
20
that narrow MLT sector, and are due to changes in the poleward
21
velocity of the boundary. In general, the motion of the boundary
22
produces the main contribution to the closure voltage during the
23
expansion phase, as can be expected from the rapid poleward
24
expansion of the substorm auroral bulge. In the present case, this
25
dominance reduces the impact of potential uncertainties related
26
with the limited SuperDARN data coverage in some areas. We
27
suggest that these oscillations are not specific to the streamer
28
itself, because its lifetime is much shorter than the 30 min period.
29
The MLT sector of the streamer contributes less than 20 % to the
30
21:36 21:48 22:00 22:12
UT
-25
-20
-15
-10
-5
V
closing(kV)
1
Figure 4. Closure voltage derived from the line integral of the
2
electric field along the open-closed field line boundary in the
3
MLT sector where the auroral streamer is observed.
4
5
total, and the oscillations of the closure voltage appear as a global
6
process probably related with the development of the substorm
7
expansion phase. Similar results can be obtained concerning the
8
second streamer located in the premidnight sector. Note that the
9
period of ~30 min lies in the range of Pc6 pulsations.
10
3. Discussion
11
We discuss observations of a typical streamer which developed
12
during the early stage of a substorm expansion phase, when the
13
flux closure voltage dramatically increased after the onset to reach
14
a maximum magnitude of ~150 kV. The time coincidence
15
between the formation of the streamer and strong overall flux
16
closure rate shortly after the onset suggests a possible causal
17
relation between these two phenomena. However, intense flux
18
closure may not be the only condition necessary to form BBFs
19
and auroral streamers. An enhanced flux closure is the natural
20
signature of the substorm expansion phase, and the simultaneous
21
appearance of the streamer may be considered incidental, unless a
22
mechanism linking BBF’s and flux closure would exist.
23
The flux tubes threading a BBF consists of a so called “plasma
24
bubble” flowing fast Earthward in the tail [Sergeev et al., 2004;
25
Chen and Wolf, 1993, 1999]. In the case of BBF’s and under the
26
frozen-in approximation, the flux tubes that go through closure
27
must be initially depleted compared to the surrounding medium,
28
as BBF’s present a low plasma density. This might be due either
29
to localised time-dependence of the lobe plasma density flowing
30
into the reconnection region, or to a localised displacement (e.g.
31
earthward) of the reconnection region itself. Now the initial
32
earthward-directed velocity of the newly-closed flux tubes and
33
accelerated plasma following tail reconnection is ~VA, the Alfven
34
speed in the tail lobes [see e.g. Owen and Cowley, 1987]. Since
35
VA is larger for lower plasma density with a given tail lobe field
36
strength, it is inevitable that a localised reduction in the lobe
37
plasma density on the newly-closed flux tubes, due e.g. to one or
38
other of the above effects, will produce a localised channel of
39
higher-speed earthward flow in the plasma sheet. From this
40
standpoint, the high velocity of the plasma flowing out of the
41
reconnection site does not stem from the value of the reconnection
42
rate itself, but from the value of the Alfvèn velocity characterizing
43
the plasma entering the reconnection region. The observations
44
presented here show that the related reconnection rates also
45
become enhanced, indicating an enhancement in the
reconnection-46
associated cross-tail electric field Ey in the tail. Since the
47
earthward contraction speed of the newly-closed flux tubes is
48
given by Ey/Bz ≈ VA, where Bz is the field component threading
49
through the current sheet, the implication is that Bz ≈ Ey/VA
50
would also become enhanced in a region where the increase of Ey
51
would dominate that of VA. Regions of high-speed low-density
52
plasma threaded by a strong B are indeed the defining features of
53
BBFs. Within this scenario, the interchange instability mechanism
1
proposed by Chen and Wolf [1993, 1999] might operate in a later
2
phase of flux-tube evolution, once the initial contraction following
3
tail reconnection is over.
4
SuperDARN radar data obtained above Northern Scandinavia
5
between 2200 and 2202 UT reveal that the ionospheric convection
6
was very low within the streamer, below 200 m s-1. This reduced
7
convection suggests that the strong auroral precipitation
8
(responsible for the bright signatures in the IMAGE-FUV images)
9
caused intense ionisation of the atmospheric gas thus favoring
10
ionospheric field line tying [Coroniti and Kennel, 1973], which
11
does not exclude strong flows from occurring along the same field
12
line in the equator plane, and allows some decoupling between the
13
magnetospheric and ionospheric plasma flows in mesoscale
14
structures. A highly conductive ionosphere is able to discharge
15
efficiently the electric potentials of magnetospheric origin which
16
can be considered as a cause for the decoupling. In-situ data from
17
the tail (which are not available for the interval discussed here)
18
would be necessary to rigorosly establish that the observed
19
streamer was actually related with a BBF.
20
In order to consolidate the relation between flux closure and
21
streamer formation on observational grounds, we analyzed the
22
reconnection voltage of eleven other intervals with a north-south
23
aligned arc, observed with IMAGE-FUV during winter 2000 on
24
10/02, 1109 UT; 10/03, 0339 UT; 10/07 0758 UT; 10/29, 0420
25
UT; 11/01, 0558 UT; 11/03, 2345 UT; 11/29, 0147 UT; 12/08,
26
0258 UT, 12/23, 0802 UT; 12/23, 1023 UT and 12/23, 1207UT.
27
Despite the limited radar data coverage of some of these events,
28
these intervals show a relation between streamers and flux
29
closure. Higher closure voltages appear to favor the appearance of
30
streamers: the closure voltage was found to range between ~-50
31
and ~-125 kV in all cases but one (11/03/2000). In this latter case,
32
the voltage was only 22 kV, but the polar edge of the streamer
33
was located in the MLT sector threaded by the field lines along
34
which the flux closure takes place. Cases with higher closure
35
voltages were found during an expansion phase, or shortly after
36
during the recovery phase. Surprisingly, considering longer time
37
scales, most of these streamers were observed during or following
38
an interval of disturbed Dst index (8 cases with Dst < -30 nT, and
39
up to Dst ~-127 nT).
40
Observations of dipolarized field lines threading BBFs by
41
Angelopoulos et al. [1992] indeed relate BBFs to magnetic flux
42
closure. The time resolution of our method (~15 min) does not
43
however allow us to fully resolve transient reconnection on these
44
time scales, so that we may have missed a transient signature
45
directly associated with the formation of the streamer. The time
46
lag reported by Angelopoulos et al. [1992] between the BBF
47
acceleration and the magnetic dipolarization may suggest that the
48
plasma threaded by newly closed field lines evolve slowly uptail
49
from the reconnection site until the conditions necessary for an
50
additional acceleration mechanism are met, due to a specific
51
topology of the electromagnetic field and of the current system.
52
Possible candidates to accelerate the plasma bubble are again the
53
B j
r r
× force, and the interchange instability proposed by Chen and
54
Wolf [1993, 1999], for example
.
Another possibility may be that55
the onset of reconnection takes place under some conditions that
56
differ from those favoring the formation of BBF’s, so that a BBF
57
will not form until other open flux tubes with the suitable
58
properties will have reached the X-line, after the formation of the
59
reconnection site.
60
In this study, the ionospheric equivalent currents deduced from
61
the MIRACLE-IMAGE and the SI12 boundary identification
62
prior to the streamer development (Figure 2) indicating that flux
2
closure started before the formation of the streamer. Indeed, the
3
substorm expansion onset appeared in the FUV images ~13 min
4
before the streamer. However, a more extensive study including
5
in-situ measurements in the tail is needed to fully verify the
6
scenario proposed above. Note that the transition between the
7
stretched tail and the dipolarized BBF can be idealized by a field
8
changing orientation along a helix, with a curl parallel to the field
9
implying field-aligned currents compatible with the usual current
10
pattern of an auroral streamer.
11
4. Summary
12
An auroral streamer was observed to develop in the midnight
13
sector during a substorm expansion phase on 7 December 2000
14
between 2200 and 2206 UT using the MIRACLE-IMAGE
15
magnetometer network, the FUV instruments onboard the
16
IMAGE satellite, and the SuperDARN radar network. The open
17
flux accumulated prior to onset was high, reaching ~0.9 GWb.
18
The flux closure voltage, oscillating with a period of ~30 min,
19
reached a maximum magnitude of ~150 kV roughly at the time of
20
the formation of the streamer. The reconnection rate also reached
21
a maximum on field lines threading the poleward edge of the
22
streamer. Ionospheric convection data suggest ionospheric field
23
line tying and consequent decoupling of magnetospheric and
24
ionospheric flows in the vicinity of the streamer. The closure
25
voltage computed here is consistent with a BBF formed by the
26
closure of plasma-depleted open flux tubes some time after the
27
reconnection onset, with high plasma velocity at the exit of the
28
reconnection site due to the j B
r r
× acceleration and possibly
29
followed by the set up of an interchange instability. The relation
30
linking flux closure and north-south aligned arcs is also found for
31
eleven other cases observed with IMAGE-FUV.
32
Acknowledgements. B. Hubert is supported by the Belgian National
33
Fund for Scientific Research (FNRS). This work was funded by the
34
PRODEX program managed by ESA in collaboration with the
35
Belgian Federal Science Policy Office. Work at Leicester was
36
supported by PPARC grant PPA/G/O/2003/00013. S.W.H. Cowley
37
was supported by a Royal Society Leverhulme Trust Senior
38
Fellowship. Work at FMI was supported by the Academy of Finland.
39
The MIRACLE and magnetometer (IMAGE) networks are operated
40
as a European collaboration under the leadership of the Finnish
41
Meteorological Institute.
42
References
43
Amm O., and A. Viljanen (1999 a), Ionospheric disturbance magnetic
44
field continuation from the ground to the ionosphere using
45
spherical elementary current systems, Earth Planet. Space, 51,
46
431.
47
Amm O., A. Pajunpää, and U. Brandström (1999 b), Spatial
48
distribution of conductances and currents associated with
north-49
south auroral form during a multiple-substorm period, Ann.
50
Geophys., 17, 1385.
51
Amm, O. and K. Kauristie (2002), Ionospheric signatures of bursty
52
bulk flows, Surv. Geophys., 23, 1.
53
Angelopoulos, V., W. Baumjohann, C.F. Kennel, F.V. Coroniti, M.G.
54
Kivelson, R. Pellat, R.J. Walker, H. Lühr, and G. Paschmann
55
(1992), Bursty bulk flows in the inner central plasmasheet, J.
56
Geophys. Res., 97, 4027.
57
Chen, C. X., and R.A. Wolf (1993), Interpretation of high-speed flows
58
in the plasma sheet, J. Geophys. Res., 98 , 21409.
59
Chen, C. X., and R. A. Wolf (1999), Theory of thin-filament motion
60
in Earth’s magnetotail and its application to bursty bulk flows, J.
61
Geophys. Res., 104, 14613.
62
Coroniti, F. V., and C. F. Kennel (1973), Can the ionosphere regulate
1
magnetospheric convection?, J. Geophys. Res., 78, 2837.
2
Fairfield, D.H., T. Mukai, M. Brittnacher, G.D. Reeves, S. Kokubun,
3
G.K. Parks, T. Nagai, H. Matsumoto, K. Hashimoto, D.A. Gurnett,
4
and T. Yamamoto (1999), Earthward flow bursts in the inner
5
magnetotail and their relation to auroral brightening, AKR
6
intensifications, geosynchronous particle injections and magnetic
7
activity, J. Geophys. Res., 104, 355.
8
Hubert, B. , S.E. Milan , A. Grocott, S. W. H. Cowley, and J.-C.
9
Gérard (2006 a), Dayside and nightside reconnection rates inferred
10
from IMAGE-FUV and SuperDARN data, J. Geophys. Res., 111,
11
A03217, doi:10.1029/2005JA011140.
12
Hubert, B., M. Palmroth, T.V. Laitinen, P. Janhunen, S.E. Milan, A.
13
Grocott, S.W.H. Cowley, T. Pulkkinen, and J.-C. Gérard (2006 b),
14
Compression of the Earth’s magnetotail by interplanetary shocks
15
directly drives transient magnetic flux closure, Geophys. Res. Lett.,
16
33, L10105, doi:10.1029/2006GL026008
17
Kauristie, K., V.A. Sergeev, O. Amm, M.V. Kubyshkina, J. Jussila, E.
18
Donovan, and K. Liou (2003), Bursty bulk flow intrusion to the
19
inner plasma sheet as inferred from auroral observations, J.
20
Geophys. Res., 108, 1040, doi: 10.1029/2002JA009371.
21
Mende, S.B., H. Heetderks, H.U. Frey, J.M. Stock, M. Lampton, S.
22
Geller, R. Abiad, O. Siegmund, S. Habraken, E. Renotte, C. Jamar,
23
P. Rochus, J.C. Gérard, R. Sigler, and H. Lauche (2000), Far
24
ultraviolet imaging from the IMAGE spacecraft : 3. Spectral
25
imaging of Lyman alpha and OI 135.6 nm, Space Sci. Rev., 91,
26
287.
27
Mersmann, U., W. Baumjohann, F. Küppers, and K. Lange (1979),
28
Analysis of an eastward electrojet by means of upward
29
continuation of ground-based magnetometer data, J. Geophys., 45,
30
281-298.
31
Owen, C. J., and S. W. H. Cowley (1987), Simple models of
time-32
dependent reconnection in a collision-free plasma with an
33
application to substorms in the geomagnetic tail, Planet. Space
34
Sci., 35, 451.
35
Ruohoniemi, J. M., and K.B. Baker (1998), Large scale imaging of
36
high latitude convection with Super Dual Auroral Radar Network
37
HF radar observations, J. Geophys. Res., 103, 20797.
38
Sergeev V.A., K. Liou, P.T. Newell, S.-I. Otani, M.R. Hairson, and F.
39
Rich (2004), Auroral streamers: characteristics of associated
40
precipitation, convection and field-aligned currents, Ann.
41
Geophys., 22, 537.
42
Shiokawa, K., W. Baumjohann, and G. Haerendel (1997), Braking of
43
high-speed flows in the near-Earth tail, Geophys. Res. Lett., 24,
44
1179.