The appearance energy of C
2H
+from C
2H
2revisited. A
photoion-photoelectron coincidence spectroscopic determination
Ch. Servais a,b, R. Locht a,b
a Département de Chimie Générale et de Chimie Physique, Institut de Chimie, Bâtiment B6, Université de Liège, Sart-Tilman par 4000 Liège
1, Belgium b
Institut d'Astrophysique, Bâtiment El, Université de Liège, Sart-Tilman par 4000 Liège 1, Belgium
Abstract
The dissociative ionization of C2H2 in a C2H +
-producing channel has been reconsidered. The photoion-photoelectron coincidence (PIPECO) technique has been used. The C2H
+
/e- coincidence rate curve has been recorded between 16.2 and 21.2 eV. The lowest appearance energy determined for C2H
+
is 17.35 ± 0.04 eV. A second appearance energy is measured at 18.40 ± 0.04 eV. At both energies ethynyl ions are produced through a predissociation mechanism at the expense of the C2H2
+ (A2Ag) state at 17.35 eV and C2H2 + (B2∑u + ) at 18.40 eV. These results are in good agreement with the most recent TPIPECO experiments and dissociative electroionization results. This comparison leads to the exclusion of any contribution of autoionization phenomena to the C2H+ ion production between 16.2 and 21.2 eV. Investigations of C2H+ through the ion pair
formation channel (and the dissociative electron attachment producing C2H
and H-) in C2H2 are reported and its
contribution to C2H +
ion production below 17.3 eV must be discarded.
1. Introduction
Much of attention has been paid to the production of the ethynyl ion C2H+ from acetylene, particularly
to the determination of the H-C2H binding energy as a main goal. Dissociative electroionization and
photoionization mass spectrometry essentially were used to determine the appearance energy of this ion (as well as of H+) from C2H2. Recently the literature related to this problem has been reviewed extensively [1]. During
the last decade the experiments investigating the reaction
markedly disagreed about the lowest appearance energy of C2H+, generating a controversy about the D(H-C2H)
value.
By dissociative electroionization, Plessis and Marmet [2] showed the lowest threshold of C2H +
produced from C2H2 to be 16.7 ± 0.1 eV, followed by unassigned critical energies at 17.02, 17.35 and 17.82 eV. It must be
mentioned that the lowest onset is observed by amplifying the threshold region by a factor 5000. More recently, we reported an appearance energy of 17.38 ± 0.11 eV, determined by electron impact, for C2H+ ions carrying
less than 10 meV translational energy [1]. It must be noticed that in both experiments the sample gas was introduced at about 10-6 Torr in the vacuum vessel.
By photoionization mass spectrometry, using a C2H2 molecular beam, Ono and Ng [3] observed a fairly
weak step at 16.79 ± 0.03 eV (73.84 ± 0.14 nm) in the ionization efficiency curve of C2H+. This process is
followed by an important increase in the ion yield at about 17.26 eV (71.8 nm). Hayaishi et al. [4] reported a photoionization mass spectrometric work, using an effusive beam to supply the C2H2 sample in the ion chamber.
They mention a static pressure in the interaction region of 3 x 10⁻³ Torr. They noticed the detection of small amounts of C4H2 and C4H3+ ions under these conditions. These authors published an ionization efficiency curve
of C2H +
, showing a fairly intense process starting at 16.8 eV and increasing to 17.3 eV, i.e. the threshold energy of the second C2H
+
-producing process. Noteworthy is the large discrepancy of the relative intensity of the 16.8 eV process in both photoionization experiments.
By threshold photoelectron-photoion coincidence (TPIPECO) experiments, Norwood and Ng [5] investigated the C2H
+
formation from C2H2 at variable wavelengths. They determined the lowest onset to be 71.7
± 0.2 nm or 17.29 ± 0.05 eV. Recently, Weitzel et al. [6] measured the appearance energy of the same ion by zero kinetic energy (ZEKE) photoelectron-photoion coincidence spectroscopy. These authors also derived an appearance energy of 17.360 eV as corrected to 0 K.
In the only He(I) photoion-photoelectron coincidence (PIPECO) experiment [7] time-of-flight (TOF) measurements are reported for discrete energy values in the photoelectron energy range of 16.8-18.7 eV. The onset for C2H
+
production was found to be 17.3 eV.
The aim of this Letter is to report the C2H+ formation from C2H2 using a new He(ï) PIPECO
spectrometer. The onset of C2H+ production is measured under improved mass and electron energy resolution.
The fragment ion translational energy distribution is measured by a direct method.
2. Experimental
The experimental apparatus used in the present work will be described in detail elsewhere [8]. In this Letter, we will limit the description to the most salient features.
The gaseous sample is introduced in the ion chamber by an effusive gas inlet. The ion chamber is a cylindrical housing of 9 mm height and 20 mm diameter covered on both sides by tungsten meshes of 70 lines per inch (LPI). This geometry is also used to ensure that the three perpendicular directions, i.e. the axis of the ion and electron optics, the light capillary and the light detection system and finally the gas inlet system when a hypodermic needle is used, intersect at the central point of the ionization region. The ion optics, executed as based on ion optical calculations, is made of two triplet lenses located on either side of a focusing lens. Photoions, extracted by a weak field (typically of 100 mV/cm), are focused on the entrance hole of a quadrupole mass spectrometer (Balzers QMG 311). Coaxially, in the opposite direction to the ions, photoelectrons are extracted and analyzed in a retarding potential-based photoelectron spectrometer characterized by a differential output, designed and described by Lindau et al. [9]. This spectrometer is built of two sets of seven cylindrical lenses placed symmetrically with respect to a central retarding grid (tungsten mesh of 70 LPI). A circular plate, spotwelded on this grid, prevents the light and straight flying electrons from reaching the detector. Both the photoion source and the photoelectron spectrometer are surrounded by two concentric µ-metal cylinders to cancel all external magnetic fields. The photoelectron energy resolution, obtained under coincidence conditions, is 30 meV as measured on Ar+/e- coincidence data. Photoion kinetic energy distributions are measured by a retarding potential analyzer and a half width at half maximum of 30 meV is measured for the thermal energy distribution of molecular ions, e.g. Ar+, C2H2+ and O2+. The electron and ion detectors are conventional 17-stage
electron multipliers with 20 ns fwhm output pulses. The power supplies used to drive both the ion and electron optics are programmable by an IBM 486DX PC, through a serial RS-232 input-output port.
Perpendicular to the photoion-photoelectron optical axis, the light produced by a discharge lamp (Helectros) is introduced in the ion chamber through a capillary of 0.5 mm diameter. A photoelectric light detector is placed opposite and coaxially to monitor continuously the light source.
The whole experiment is contained in a vacuum vessel which is baked-out at about 250° C and an ultimate vacuum lower than 10-8 Torr is obtained. For the recording of photoelectron spectra and ion kinetic energy distributions the sample gas is introduced at 2 x 10⁻⁵ Torr. For coincidence and TOF measurements the sample pressure is reduced to pressures lower than 2 x 10⁻⁶ Torr.
The hardware and software for the data acquisition in the time-of-flight, photoion-photoelectron coincidence, photoion kinetic energy distribution and mass spectrum measuring modes are installed on a FPGA-based (Field Programmable Gate Array), home-made interface inserted in the IBM-PC. Additional external modules were built for the time-of-flight measurement and coincidence gates generation.
Details of the construction of this instrument and the hardware and electronic circuitries used in this experiment as well as the performance tests made on Ar+-e- and O+-e- from O2 will be described and discussed in
detail in a forthcoming publication [8].
3. Experimental results
The acetylene sample used in this work is of 99.5% purity. 1% acetone is added for stabilisation at high pressure. Fig. 1 shows the mass spectra of the sample ionized with 54.8 nm radiation and recorded at (a) 1.5 x 10⁻⁶ Torr and (b) 4.5 x 10⁻⁵ Ton-pressure measured in the vacuum vessel. Part (c) of the same figure shows the mass spectrum of pure acetone. The comparison between spectra (a) and (c) shows no interference between m/e = 24, 25 and 26 from acetone and acetylene.
However, the mass spectrum (b) of Fig. 1 clearly shows relatively important contributions at m/e = 50 and 51, likely corresponding to C4H2 and C4H3
+
ion formation in the ion chamber. In the same spectrum a peak at m/e = 27, likely corresponding to C2H3
+
ions, becomes fairly strong at high pressure and with a much higher intensity than expected from the 13C/12C isotope ratio. Compared to the mass spectrum (a), the signal at m/e = 50 shows about the same intensity as that observed at mass m/e = 25. On the basis of this observation the following spectra were recorded at sample pressures lower than 10-6 Torr as measured in the vacuum vessel. It is estimated that at these pressures a contribution of C2H
+
produced from C4H2 +
can no longer be suspected. Nevertheless, this working condition lengthens considerably the measuring time for a given signal-to-noise ratio.
The C2H+ ion kinetic energy distribution, as observed at 21.22 eV photon energy, has been measured by
the ion retarding potential method. The first differentiated retarding potential curve is shown in Fig. 2.
In this figure the C2H +
translational energy distribution is directly compared to the thermal energy distribution of the parent C2H2
+
ion. Both distributions do not show significant differences. Most of the C2H +
ions do not carry translational energy. Above 30 meV, the distribution curve of C2H+ seems to exhibit a few
percent of ions with non-zero translational energy.
This observation is confirmed by the TOF spectrum of C2H +
and C2H2 +
which both show a peak at 33 µs with a full-width of about 10 µs. Fig. 3 shows the result for the C2H
+
ion.
When setting the mass spectrometer at m/e = 25, the coincidence unit is set at a delay time of 33 µs for measuring the true and random coincidences. A second delay time is fixed at 80 µs for the measurement of purely random coincidences. Both events are observed in a 10 µs time window. The photoelectron spectrometer is continuously scanned between the programmed energy limits. Four multichannel scalers are dedicated to record (i) the photoelectron spectrum (see Fig. 4a), (ii) the photoion current, e.g. the C2H
+
ion current, (iii) the sum of true and random coincidences and (iv) the random coincidences observed in the predefined energy range. The difference of the content of multichannel scalers (iii) and (iv) provides the true coincidences observed for the selected ion produced in the selected electron energy range. Figs. 4b and 4c show the signal difference, filtered by applying Fourier transform with appropriate filtering operator, for C2H
+
and C2H2 +
respectively. The signal-to-noise ratio in the latter spectrum is not as good as in the former, owing to a reduced measuring time.
Fig. 1. He(l) (54.8 nm) mass spectrum of a C2H2 sample added with about 1% acetone at (a) 1.5 x 10 -6
Torr and (b) 4.5 x 10⁻⁵ Torr pressure measured in the vacuum vessel, (c) Mass spectrum of a pure acetone sample recorded at 54.8 nm.
Fig. 2. The first differentiated retarding potential curve of C2H+ (full line) and C2H2+ (dotted line) ions recorded
at 58.4 nm.
Fig. 3. Time-of-flight spectrum of C2H2 and C2H +
ions from C2H2 in coincidence with 2.5 eV (corresponding to
Fig. 4. (a) The photoelectron spectrum of C2H2 as measured under coincidence conditions in the 16.2-20.2 eV
ionization energy range. Photoion-photoelectron coincidence spectra of C2H +
(b) and C2H2 +
(c) are shown in the corresponding energy range. The two latter signals are filtered by fast Fourier transform. The arrow and the shaded area show the C2H+ onset and the associated uncertainty.
4. Discussion
The He(I) photoelectron spectrum presented in Fig. 4a, as recorded under coincidence conditions, shows the energy range covered by the A2 Σg+ (or A2Ag) and the B2Σu+ states of the C2H2+ molecular ion.
Notwithstanding the complexity of the vibrational structure of these bands [10], it can be noticed that a lot of vibrational structure is still resolved at 30 meV resolution.
The photoelectron spectrum corresponding to the A2Ag state first shows a succession of sharply defined
peaks. Up from 17.2 eV, the peaks still belonging to the same vibrational progressions become diffuse. Above 17.5 eV the vibrational structure disappears. These observations are in good agreement with the high-resolution He(I) PES [10] and the TPES [5] of C2H2 reported previously.
Corresponding to these observations, the photoion-photoelectron coincidence spectrum of C2H +
essentially shows the absence of any coincidence between 16.3 and 17.2 eV (see Fig. 4b). At this latter energy the coincidence rate exhibits a drastic increase at an onset measured at 17.35 + 0.04 eV, peaks at about 17.5 eV and decreases slowly to 18.4 eV. This decrease has about the same rate as that observed in the A2Ag
photoelectron band.
These observations and the above mentioned energies are in good agreement with those reported in the TPIPECO work of Norwood and Ng [5]. The ZEKE-PIPECO work [6] reports a threshold at 17.360 eV as
extrapolated to 0 K without error estimation. In the earlier He(I) PIPECO experiment [7] a value of 17.30 eV was obtained. The good correlation between the spectral characteristics of the A2Ag spectrum above 17.2 eV and
the coincidence rate curve of C2H +
unambiguously shows that reaction (1) must occur through predissociation of the A2Ag (or A2Σg+) state. This mechanism was already proposed earlier [1] and the X 2Πu state was suggested as
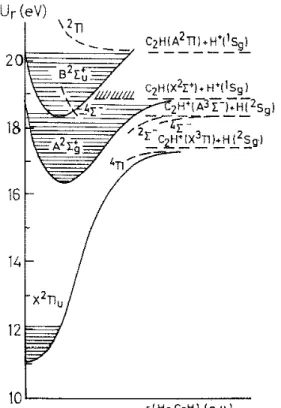
being the predissociating state. Beside a 4Π state, the 2Π state would indeed correlate with the fragments of reaction (1) in the 3Π and 2S states (see Fig. 5).
As shown in Fig. 4b, after a slow decrease of the coincidence rate, this signal markedly reincreases at 18.4 eV. The amplitude of the oscillations present in the coincidence signal are much larger than the noise level. They correlate fairly well with the vibrational structure present in the C2H2+ (B2Σu+) photoelectron band (see Fig.
4a). The overall coincidence rate decreases with increasing energy, as does the photoelectron band. These observations are also in good agreement with the TPIPECO experimental results reported by Norwood and Ng [5]. The coincidence spectrum should be interpreted by the appearance of C2H
+
up from 18.4 eV through the predissociation of the B2Σu+ state of C2H2+. This predissociation could occur through a 4Σ- or a 2Σ- state of C2H2
which correlates with the C2H +
fragment in the 3Σ- electronic excited state and the H atom in its ground 2Sg state
(see Fig. 5). This would be supported by the C2H +
ion energy distribution which shows ions carrying mainly no translational energy at 21.22 eV.
It must be mentioned here that recently, by dissociative electroionization [1], beside the first appearance energy for C2H+ of 17.30 ± 0.08 eV, a second onset has been determined at 18.27 ± 0.10 eV. It was ascribed to
the predissociation of the B2Σu +
state of C2H2 +
.
To proceed further with the comparison between the TPIPECO and He(I) PIPECO experiments, the coincidence rates for C2H2+ have been measured over the same photoelectron energy range, i.e. 16.4-20.2 eV
(see Fig. 4c). This coincidence spectrum clearly shows the vibrational structure observed in the photoelectron spectrum of the C2H2
+
(A2Ag) state. However, at about 17.2 eV the coincidence rate suddenly decreases sharply.
Up from 17.70 eV almost all the C2H2 molecular ions are dissociated. At higher energies the coincidence
spectrum only shows oscillations about the zero line.
Fig. 5. Tentative schematic potential energy diagram of C2∏2+ along the H--C2H reaction coordinate. The
shaded areas define the well depth observed in the He(l) photo-electron spectra. Dashed lines locate the experimental data obtained in the present PIPECO work and by electron impact [l] on the C2H
+
and H + producing channels.
The good agreement between the present coincidence spectra, obtained at fixed wavelength with the He(I) resonance line, and the TPIPECO spectra [5] obtained at variable wavelength, is obvious. It unambiguously shows that below 21.22 eV any contribution of autoionization to dissociation through reaction (1) can be excluded. Indeed, the fundamental difference between both experiments is the detection of the contribution of autoionization in the latter technique whereas it could be excluded in the former, excepting the case where the He(I) 54.8 nm (21.22 eV) line is resonant with an autoionization level. However, an autoionizing state starting at about 21.2 eV has been detected in the threshold photoelec-tron spectrum of C2H2 [11]. The
excitation of this state does not contribute noticeably to the population of the predissociated C2H2 +
states.
Because of the unfavourable signal-to-noise ratio close to zero coincidence rate, no significance could be assigned to the positive oscillating signal between 16.0 and 17.0 eV in the C2H
+
PIPECO curve (see Fig. 4b). Norwood and Ng [5] report a 'weak tailing structure' in the C2H
+
TPIPECO curve. They account for this signal by hot band and scattered light effects.
One of the aims of the present work was to try to contribute to clarifying the inconsistency of the appearance energy of C2H+ from C2H2, and consequently the thermochemistry involving C2H and C2H+ and the
H-C2H binding energy.
Under the experimental conditions (e.g. pressure) described above, by PIPECO spectroscopy the appearance energy of C2H+ from C2H2 should be at 17.35 ± 0.04 eV. Concerning the determination of the H-C2H
binding energy, the ionization energy of the ethynyl radical remains questionable.
Norwood and Ng [5] suggested that one other possible way to answer this problem could be the investigation of the ion pair formation channel, e.g.
which necessarily involves non-autoionizing neutral states. This process can not be investigated by coincidence techniques involving photoelectrons.
In our dissociative ionization work devoted to negative ion formation [12,13] we investigated both ion pair formation channels producing H- (and C2H+) and C2H- (and H+). The lowest threshold energies were
determined at 18.0 ± 0.1 and 18.4 ± 0.1 eV, respectively. An ion translational energy analysis has not been performed. Both energies are quite higher than expected on the basis of ionization energies, electron affinities and the accepted dissociation energy. More recently, Hattori et al. [14] measured both processes by photoionization mass spectrometry and confirmed the electron impact results.
Beside the ion pair formation involving negative ions, the dissociative electron attachment channels must be considered, i.e.
and were also investigated [12,13]. Onset energies were determined at 2.8 ± 0.2 and 7.2 ±0.1 eV. In these experiments also, no ion translational energy has been analyzed.
5. Conclusions
Our motivation to investigate carefully the dissociative ionization of C2H2 was stimulated by the
unsolved questions concerning the appearance energy of C2H+ and its consequences on the evaluation of the
H-C2H binding energy. The C2H +
+ H dissociation channel has been investigated with the help of the most appropriate techniques, i.e. dissociative electroionization with ion energy analysis [l] and the state-selective PIPECO experiment reported here. The excellent agreement between the present investigation and other previous experiments would strongly support that (i) the first threshold of C2H+ production is 17.35 eV and (ii) the onset at
about 16.8 eV is likely irrelevant to the unimolecular dissociation process considered here. The involvement of dissociative autoionization could be excluded. Furthermore, we brought experimental evidence to discard
definitely the hypothesis of ion pair formation at this energy. One of the experimental difficulties is the accurate determination of the C2H
+
ion translational energy at threshold. This problem has been circumvented by measuring the C2H + H
+
dissociation channel [1]. Nevertheless, a discrepancy still exists in the value of D(H-C2H). The main remaining question in all the experiments performed on the dissociative (positive and negative)
ionization of C2H2 in the C2H+ and/or C2H channels is the uncertainty in the ionization energy of the ethynyl
radical as well as the absence of spectroscopic investigation of the vibronic excitation of this radical and its corresponding cation, e.g. in the 4000-40000 cm-1 range.
Acknowledgements
We wish to thank the Fonds National de La Recherche Scientifique (FNRS) and the Fonds de la Recherche Fondamentale Collective (FRFC) for financial support. We are grateful to Professor Bernard Leyh and Profesor Paul Natalis for critical reading of the manuscript.
References
[1] M. Davister and R. Locht, Chera. Pays. 189 (1994) 805.
[2] P. Plessis and P. Marmet, Intern. J. Mass Spectrom. Ion Processes 70 (1986) 23.
[3] Y. Ono and C.Y. Ng, J. Chem. Phys. 74 (1981) 6985.
[4] T. Hayaishi, S. Iwata, M. Sasanuma, E. Ishiguro, Y. Morioka, Y. Iida and M. Nakamura, J. Phys. B 15 (1982) 79.
[5] K. Norwood and C.Y. Ng, J. Chem. Phys. 91 (1989) 2898.
[6] K.M. Weitzel, J. Mähnert and M. Penno, Chem. Phys. Letters 224 (1994) 371.
[7] J.H.D. Eland, Intern. J. Mass Spectrom. Ion Phys. 31 (1979)161.
[8] Ch. Servais and R. Locht, to be published.
[9] I. Lindau, J.C. Helmer and J. Uebbing, Rev. Sci. Instrum. 44 (1973) 265.
[10] J.E. Reutt, S. Wang, J.E. Pollard, D.J. Trevor, Y.T. Lee and D.A. Shirley, J. Chem. Phys. 69 (1978) 1504.
[11] M. Davister and R. Locht, Chem. Phys. 198 (1995), in press.
[12] R. Locht, Ph.D. Thesis, Université de Liège (1971).
[13] R. Locht and J. Momigny, Chem. Phys. Letters 6 (1970) 273.
[14] H. Hattori, H. Yoshida, K. Mitsuke, S. Suzuki, T. Imamura and I. Koyano, Ann. Rev. Inst. Mol. Sci. (1992) 99.