HAL Id: dumas-01082238
https://dumas.ccsd.cnrs.fr/dumas-01082238
Submitted on 13 Nov 2014
HAL is a multi-disciplinary open access
archive for the deposit and dissemination of
sci-entific research documents, whether they are
pub-lished or not. The documents may come from
L’archive ouverte pluridisciplinaire HAL, est
destinée au dépôt et à la diffusion de documents
scientifiques de niveau recherche, publiés ou non,
émanant des établissements d’enseignement et de
The role of arbuscular mycorrhizal fungi in N20 and N2
emissions
Anne-Laure Corbel
To cite this version:
Anne-Laure Corbel. The role of arbuscular mycorrhizal fungi in N20 and N2 emissions. Agricultural
sciences. 2014. �dumas-01082238�
The role of arbuscular mycorrhizal fungi in
N
2
0 and N
2
emissions.
Par : Corbel Anne-Laure
Illustration éventuelle
!
Soutenu à Rennes, le 10 Septembre 2014
Devant le jury composé de :
Président : Mme Christine Bissuel Maître de stage : M. Franz Bender
Enseignant référent : Mme Safya Menasseri
Autres membres du jury : M. Christophe Le May, M. Christophe Mougel
Les analyses et les conclusions de ce travail d'étudiant n'engagent que la responsabilité de son auteur et non celle d’AGROCAMPUS OUEST
! AGROCAMPUS OUEST CFR Angers CFR Rennes Année universitaire 2013-2014 Spécialité : Ingénieur en Horticulture
Spécialisation (et option éventuelle) : Sciences et productions végétales, ingénierie des Agrosytèmes.
Mémoire de Fin d'Études
díIngÈnieur de líInstitut SupÈrieur des Sciences agronomiques, agroalimentaires, horticoles et du paysage
de Master de líInstitut SupÈrieur des Sciences agronomiques, agroalimentaires, horticoles et du paysage
Preface
This thesis was conducted in the context of my final internship as engineering-student in Master Degree in Agronomy and Horticulture at the graduate school of Agrocampus Ouest. I was hosted from February to August 2014 at the Swiss federal institution Agroscope in Zurich (Switzerland) to work in a research team that aimed at investigating soil biodiversity and soil ecosystem services.
My research project was in a field of activity that focused on the roles of arbuscular mycorrhizal fungi (AMF) in nutrient cycling, with a special focus on relations between AMF and N20 and N2 gas emissions through denitrification processes.
My work consisted of the definition and description of the framework of the project, the setup of the experiment in the greenhouse, maintenance of the microcosms, data collection and the realization of nutrient and statistical analyses.
During the training period, I could take part in team or official research meetings such as the 33rd New Phytologist Symposium and discuss new knowledge about AMF and future evolutions for enhancing the sustainability of cropping systems. I could also work with different teams of the institute and therefore discover and practise new laboratory methods. In this report, you will also find the result of this 6-monthly work.
Acknowledgments
Firstly, I would like to thank Franz Bender, my supervisor, for the confidence he placed in me, the independence he gave me with the maintenance of the experiment and for his helpful comments during all the training period.
Thanks to Agroscope staff for helping with the gas measurements and analyses that were very time consuming, to Martin Zuber and his team for the nutrient analyses, their patience and availability to my questions.
Contents
1.
Introduction ... 1
2.
Material and methods ... 3
2.1.
!Experimental!Setup!...!3
!2.1.1.
!Experimental!plan!(main!experiment)!...!3
!2.1.2.
!Metagenomic!Experiment!...!4
!2.1.3.
!Equal!performance!Test!...!4
!2.1.4.
!Experimental!material!...!4
!2.1.4.1.
!Pots!...!4
!2.1.4.2.
!Substrate!...!5
!2.1.4.3.
!Hyphal!bags!...!5
!2.1.4.4.
!Tomato!seeds!...!5
!2.2.
!Growing!conditions!...!6
!2.3.
!Fertilization!and!Water!Pulse!...!6
!2.4.
! 13CO2!labelling!...!6
!2.5.
!Gas!sampling!...!7
!2.5.1.
!N20!...!7
!2.5.2.
!N2!...!7
!2.6.
!Harvest!...!7
!2.6.1.
!Main!experiment!...!7
!2.6.2.
!Metagenomic!pots!...!8
!2.7.
!Laboratory!analysis!...!8
!2.7.1.
!Plant!biomass!and!nutrient!content!...!8
!2.7.2.
!Soil!N!content!...!8
!2.7.3.
!Microbial!Biomass!C!and!N!...!8
!2.7.4.
!AMF!Analysis!...!9
!2.7.4.1.
!Root!colonization!...!9
!2.7.5.
!Statistical!analysis!...!9
!3.
Results ... 10
3.1.
!Effect!of!AMF!treatment!...!10
!3.1.1.
!Gas!emissions!...!10
!3.1.2.
!AMF!parameters!...!11
!3.1.3.
!Plant!biomass!...!12
!3.1.4.
!Soil!data!...!13
!3.2.
!Equal!performance!test!...!15
!3.2.1.
!N20!emissions!...!15
!3.2.2.
!Plant!biomass!...!15
!3.2.3.
!Soil!data!...!16
!4.
Discussion ... 17
4.1.
!Effect!of!AMF!on!N20!emissions!...!17
!4.2.
!Effect!of!the!fertilization!treatment!...!18
!4.3.
!Effect!of!the!shading!treatment!...!18
!4.4.
!Experimental!difficulties!...!19
!4.5.
!SoilWPlantWFungi!interaction’s!complexity!...!19
!5.
Conclusion ... 20
Glossary and abbreviations
AC : Arbuscular colonization AMF : arbuscular mycorrhizal fungi HC : Hyphal colonization
L+ : high light supply treatment L- : low light supply treatment M: Mycorrhizal microcosm NM: Non-mycorrhizal microcosm N+: high nitrogen supply treatment N-: low nitrogen supply treatment VC : Vesicular colonization Se or ± : Standard error
Tables of illustrations
Figures
Figure 1. AMF structures in plant roots sections : arbuscule (a), hyphae (h) and vesicle (v). . 1
Figure 2. Experimental plan with AMF treatment (M and NM), shading treatment (L+ and L-) and fertilization treatment (N+ and N-). ... 3
Figure 3 with a removable cap with two valves for N20 samples. ... 4
Figure 4 Enclosed microcosm during a N20 gas measurement.. ... 4
Figure 5. Shaded and unshaded microcosms.. ... 6
Figure 6. Microcosms in transparent containers during 13CO2 labelling.. ... 7
Figure 7. N20 emissions curve of the M treatment and NM treatment at high nutrient supply. ... 11
Figure 8. Means of the shoot and root biomass of mycorrhizal and non-mycorrhizal microcosms with shading and fertilization treatments.. ... 13
Figure 9 Means of the microbial C and N and the ratio C/N of mycorrhizal and non-mycorrhizal microcosms with shading and fertilization treatments. ... 13!
Tables
Table 1. Substrate characteristics of the soil inoculum used in the experiment. ... 5Table 2. ANOVA output of the repeated-measures analysis for N20 fluxes for the M and NM treatments. ... 10
Table 3. ANOVA output of the repeated-measures analysis for N20 fluxes for the shading and the fertilization treatments. ... 10
Table 4. Statistical outputs of cumulative N20 emissions, plant, AM fungal and soil parameters of the microcosms planted with mycorrhizal plants (M treatment) and non-mycorrhizal plants (NM) at high (N+) or low (N-) nitrogen supply and at high (L+) and low (L-) light supply.. ... 12
!
Table 5. Means with the standard error in brackets of the cumulative N20 emissions, plant, AM fungal and soil parameters of the microcosms planted with mycorrhizal plants (M treatment) and non-mycorrhizal plants (NM), of the fertilization (N+ and N-) and shading treatment (L+ and L-). ... 14Table 6. ANOVA output of the repeated-measures analysis for N20 fluxes of the equal performance test.. ... 15
Table 7. Statistical outputs of cumulative N20 emissions, plant, AM fungal and soil parameters of the microcosms planted with mycorrhizal plants (M treatment, n=10) and non-mycorrhizal plants (NM, n=10) in sterile soil. ... 16
APPENDIX
!
APPENDIX I – Denitrification cycle (Giles et al., 2012) ... I!
APPENDIX II - Method for the quantification of root colonization (McGonigle et al.,
1990) ... II!
APPENDIX III – R-Script of the linear mixed effects model used in the experiment. . III!
1. Introduction
Since the development of industrial mineral N fertilizers, the input of reactive N in agricultural soils has increased by 800 % (Canfield et al., 2010). Although this allowed great increases in crop production, the human interference with N cycling processes has high costs on the environment (Schlesinger, 2009). Because of low N use efficiency in cropping systems, 45% of the N fertilizer are not taken up by plants but may get lost through leaching, erosion or gas emissions (Liu et al., 2010). These losses have negative consequences such as pollution of ground-and surface water and of downstream ecosystems and accumulation of greenhouse-gases in the atmosphere (Bobbink et al., 2010, Galloway et al., 2003). Currently, agricultural soils contribute as much as 60 % of global N20 emissions (Smith et al., 2008), a greenhouse
gas with a 300 times greater global warming potential than CO2. Therefore, increasing
nutrient use efficiency and reducing nutrient losses are key aspects for sustainable agriculture.
N transformations in soil are entirely microbially-driven and arbuscular mycorrhizal fungi (AMF) are supposed to have an important influence on the actual rates of N-cycling processes (Veresoglou et al. 2012).
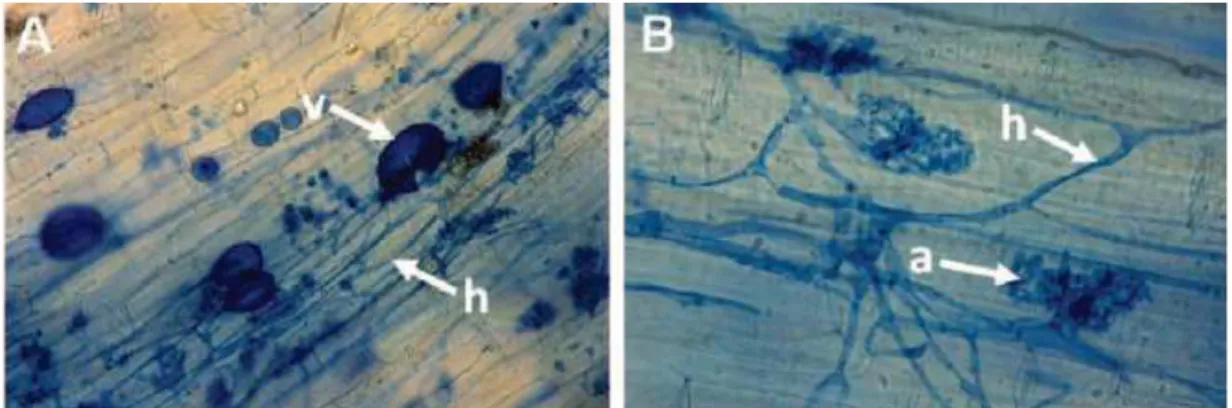
Arbuscular mycorrhizal fungi belong to the fungal phylum Glomeromycota (Schüßler et al., 2001) and associate in a symbiosis with the majority of land plants (Wang and Qui, 2006). Colonization of roots by AMF arises from sources of inoculum such as spores, infected root fragments and hyphae, present in the soil either as fragment or as established mycelia in soil. Following the penetration of the epidermis, hyphae grow in the intercellular spaces and form characteristical structures (Figure 1):
o The arbuscules, formed by differentiation of hyphal branches and present in the intercellular spaces, are responsible for nutrient exchange between fungus and plants.
o The vesicles present in intra or intercellular positions of the cortex, are ovoid structures which contain abundant lipid and nuclei. They are considered as important storage organs, playing a role as propagules within root fragments. However, little is still known about the mechanisms involved in the mobilization of these reserves.
!
Figure 1. AMF structures in plant roots sections : arbuscule (a), hyphae (h) and vesicle (v). Agroscope, J. Moll, 2013.The colonization by the fungi forms a complex network reaching from inside the roots far into the soil (Smith and Read, 2008).
AMF are a key aspect for soil-plant interactions studies as they form direct links between plants and soil. It was shown that AMF could have potential benefits on plant N-nutrition, on the N-uptake and on the reduction of N-losses through leaching (Hodge and fitter 2010, Van der Heijden, 2010). Furthermore, it has been suggested that the presence of AMF could
2!
!
influence denitrification, which is a microbial respiratory process that reduces soluble nitrogen oxides in soil (nitrate N03- and nitrite N02-) to the gaseous nitrogen oxides (nitric
oxide N0 and nitrous oxide N20) which may be reduced to dinitrogen (N2) in a complete
reaction (Knowles, 1982) under anaerobic conditions. In fact, AMF could reduce N2O
emissions from the soil by enhancing a complete denitrification with N2 gas as end product
(Bender et al., 2014). The study actually found a positive correlation of AMF abundance with the gene copy numbers of the functional microbial gene nitrous-oxide-reductase (nosZ) which reduces N20 to non-reactive N2. However, several other soil factors can also mediate
the process such as high water contents or high nitrogen contents which increase the denitrification activity and affect the denitrification product ratio of nitrous oxides to N2 (Giles
et al., 2012).
As AMF are obligate symbionts, they are completely dependent on their plant partner for organic C supplied by photosynthesis (Cooper and Losel, 1979). AMF utilize a considerable proportion of the assimilated C and are therefore involved in the sequestration of plant-derived C in the rhizosphere (Fitter, 2005, Staddon, 2005). Weier et al. (1993) have supposed that the carbon supply in the soil could also be another important factor controlling the N20/N2 ratio.
Besides affecting the carbon and N availability in the soil, AMF could also influence denitrification processes by modulating microbial communities, including denitrifiers through changes in the quantity and the quality of C compounds being exuded into soil or by providing a habitat in soil for certain microbes through the presence of their extraradical hyphae (Toljander et al. 2007, Verosoglou et a.,2012).
A greenhouse experiment was set up to investigate how AMF affect gaseous losses of N20
and N2 to the atmosphere through denitrification. Planted microcosms with high or low AMF
abundance were grown in the greenhouse. Additionally, a shading treatment was applied and N availability was manipulated with a fertilization treatment to test whether this affects the abundance of AMF in soil and whether this subsequently affects N20 and N2 emissions.
After a fertilisation pulse, gas measurements of N20 and N2 were realized in microcosms
either in presence or in absence of AMF. It was hypothesized that :
(i) the presence of AMF affects denitrification after a fertilization pulse by reducing N20 emissions and enhancing N2 emissions
(ii) shading reduces the abundance of AMF and this causes a reduction in the differences in gas emissions between the mycorrhizal and non-mycorrhizal treatments
(iii) high N fertilisation increases denitrification, reduces the abundance of AMF and causes a reduction in the differences in gas emissions between the mycorrhizal and non-mycorrhizal treatments.
In this report, we present the material and methods we used and the results we obtained. A discussion of the results is proposed before to conclude the study.
2. Material and methods
2.1.
Experimental Setup
2.1.1.
Experimental plan (main experiment)
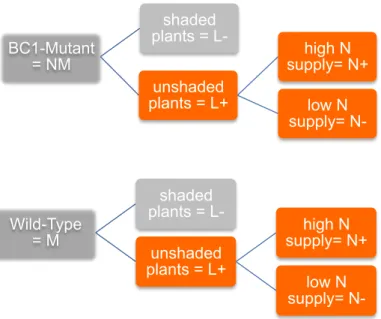
The experiment consisted of 6 treatments. Two genotypes of Tomato were planted: the BC1-mutant (Solanum lycopersicum L. cv. Micro-Tom) (NM treatment) and its wild-type progenitor (M treatment). This method was chosen because it represents an alternative to common approaches which normally use fungicides or destructive methods of the soil biota (by fumigation, autoclaving etc.) to obtain a non-mycorrhizal control treatment.
The non-mycorrhizal plant mutant was created by fast-neutron mutagenization (David-Schwartz et al 2001) and hybridization and exhibits a strongly reduced AMF root colonization compared to its wild-type progenitor (Rillig et al., 2008). This allows the investigation of the role of AMF in plant-soil processes without destruction of the soil system (Cavagnaro et al., 2007).
Each genotype was grown in the greenhouse under natural light conditions (L+ treatment). After 10 weeks of growth, a subset of the microcosms was shaded until harvest (L-
treatment). Unshaded treatments received either a high (N+ treatment, 120 kg/ha) or a low
amount of nutrient fertilizer (N- treatment, 60kg/ha). Each combination of treatments was established in two randomized blocks. Each treatment was replicated 5 times in the block one, 4 times in the block two. This resulted in a total of 54 microcosms (2 genotypes x 2 light treatments x 2 fertilization treatments x 9 replicates). The blocks were set up in 7 day intervals, starting April 7, 2014 (Figure 2).
BC1-Mutant
= NM
shaded
plants = L-
unshaded
plants = L+
high N
supply= N+
low N
supply= N-
Wild-Type
= M
shaded
plants = L-
unshaded
plants = L+
high N
supply= N+
low N
supply= N-
Figure 2. Experimental plan with AMF treatment (M and NM), shading treatment (L+ and L-) and fertilization treatment (N+
4!
!
2.1.2.
Metagenomic Experiment
In parallel of the main experiment, 3 pots of M treatment and 3 pots of NM treatment were placed in the experimental design for metagenome-based analysis. This should permit to have a more precise idea of the influence of AMF on microbial communities and denitrification by investigating DNA and RNA present in the soil during the gas measurements, when denitrification occurs. The NM treatment represented the reference metagenome.
Plants were cultivated in the same greenhouse and in the same conditions as the main experiment.
2.1.3.
Equal performance Test
In addition to this, a test for equal performance (20 additional pots) of both tomato genotypes was conducted in sterile soil. This was done to confirm that both genotypes perform similarly in the absence of mycorrhizal fungi and exclude the possibility of any non-target effects resulting from differences between genotypes independent to AMF. For that, the same field soil used in the main experiment was sterilized by x-ray irradiation with a minimum dose of 8 kGy to eliminate any AMF inoculum. A microbial wash, produced from a 11µm filtered soil suspension, was added to the pots to re-establish microbiota. Important is to note that there are limitations to this re-introduction but this is a widely practiced method as mentioned above (Rillig et al. 2008).
The test was performed independently from the main experiment but took place in the same greenhouse, so plants were growing in the same conditions as described below.
2.1.4.
Experimental material
2.1.4.1.
Pots
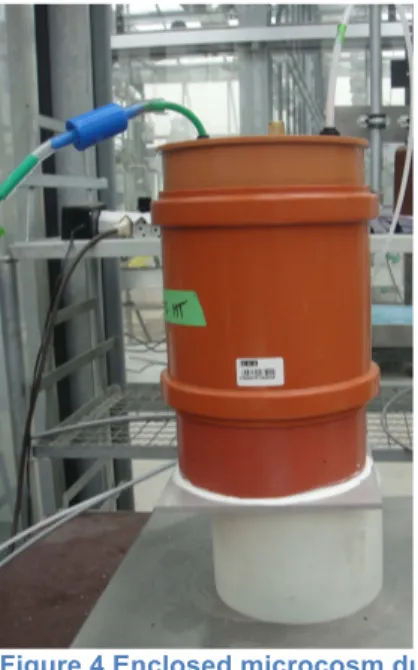
The experiment was conducted in microcosms constructed of PVC tubes with a diameter of 15 cm, a height of 20 cm and a volume of approx. 3.5 l. A sleeve with a rubber seal and a removable cap was fit on the tubes to close the headspace airtight. For N2O analyses, the
cap contained two valves in which tubes for gas sampling could be inserted. For N2
sampling, another cap was used, which contained a valve with a rubber septum through which headspace gas samples could be taken with a syringe (Figures 3 and 4).
!
Figure 4 Enclosed microcosm during Figure 3 with a removable cap with two valves for N20 samples. Agroscope, AL.
Corbel, 2014. a N20 gas measurement.
Agroscope, AL. Corbel, 2014.
!
2.1.4.2.
Substrate
The soil was a calcareous brown earth with a sandy-loam texture collected from a regularly manured long-term pasture of an organic farm near the Research Station Agroscope ART in Zürich, Switzerland (47°43’11.83’’N, 8°53’65.25’’E). The soil was 4 mm sieved to homogenize and to remove large stones, plant material, earthworms and other macrofauna that could cause undesired variation. Microcosms were filled with 300 g of gravel and 3000 ml of the sieved soil and mixed with 150 ml of an additional AMF inoculum. When filling the microcosms, substrate dry weights were determined gravimetrically. The exact weight of the pots was noted to be able to calculate the water filled pores space (WFPS).
AMF inoculum was mixed to this soil to assure a high AMF root infection potential. The Characteristics of the soil inoculum mix are shown in Table 1.
The inoculum was a complex inoculum produced from the same field soil used to fill the microcosms in the main experiment. It was produced in 3 l pots containing a 3:17 (v/v) soil:sand mixture, inoculated with 5 % fresh field soil, planted with Plantago lanceolata. Every 2nd week, pots received 20 ml of a modified Hoagland solution containing one quarter of the original P concentration. After 3 months of growth, plant leaves were removed and roots were cut into <5cm pieces and homogeneously mixed with the substrate. This root-substrate mixture was used as inoculum.
Table 1. Substrate characteristics of the soil inoculum used in the experiment.
Substrate characteristics Clay [%] 22.6 Silt [%] 30.9 Sand [%] 43.4 Humus [%] 3.1 pH (H2O) 7.3 Corg [g*kg soil-1] 18.0 N total [g*kg soil-1] 28.0 Available P [mg*kg soil-1] 0.99
2.1.4.3.
Hyphal bags
In each microcosm, a hyphal bag was vertically inserted at the edge. Bags were 5 cm circumference, 10 cm long and were constructed using 25 um nylon mesh to create a root-restrictive structure that only allowed for penetration of AMF hyphae. The bags were filled with 40 grams of leached medium-corse sand.
In microcosm of the metagenomic experiment, three hyphal bags were inserted at the edge, distributed at equal distance from each other.
2.1.4.4.
Tomato seeds
The tomato seeds were germinated in a sterilized 1:1 (v/v) sand-soil mixture and then transplanted into the microcosms by selection of the healthiest plants of similar size. The setup was made on April 2014 for the first bloc ; 7 days later for the second block.
6!
!
2.2.
Growing conditions
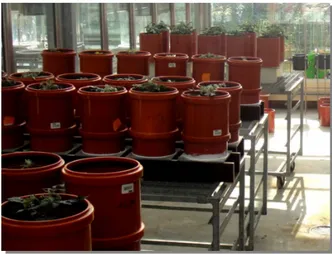
The plants were cultivated in a greenhouse with an average daily temperature of 24 ºC, nightly temperature of 18 ºC and 16 hours of light per day. 400 W high-pressure sodium lights provided supplemental light when natural irradiation was lower than 300W/m2.
The plants of shading treatment were cultivated under the same temperature conditions but were shaded after 1 month of growth with a black shading mesh on the top of the pot to reduce the photosynthetically active radiation (PAR) to 50 % compared to the unshaded plants. All plants were regularly watered to 50% water filed pore space with deionized water.
Figure 5. Shaded and unshaded microcosms. Plants of the L- treatment were shaded with a horticultural shading mesh. Agroscope, F. Bender, 2014.
2.3.
Fertilization and Water Pulse
After 8 weeks of growth, the microcosms of the high fertilization treatment received 100 mL of a modified Hoagland solution containing an equivalent to 30 kgN/ha. A second similar fertilization pulse was repeated 1 week later.
One day before the gas measurements (two weeks after the first pulse), microcosms of the high fertilization treatment were watered with 10 ml of a pure nutrient solution containing 467mM 15N-labeled KNO3 (99 atom% excess 15N) and 311mM unlabelled KN03 (resulting in a mixture of 60 atom% excess 15N-labelled KNO3), 59mM KH2PO4, 1mM MgSO4, 2mM CaCl2, 50µM KCl, 25µM H3BO3, 2µM MnSO4, 2µM ZnSO4, 0.5µM CuSO4 and 0.5µM Na2MoO4, mixed with 190 mL of deionized water, corresponding to a fertilizer pulse of 60 kg N/ha and 10 kg P/ha. The low fertilization treatment received 5ml of the nutrient solution diluted in 195ml of deionized water corresponding to a fertilisation pulse of 30 kg N/ha and 5 kg P/ha.
The day after fertilisation, the pots were watered to 90% WFPS with deionized water using a rain simulator as described by Knacker et al. (2004). Those higher water rate and nutrient pulses were introduced to provide optimal conditions for denitrification.
2.4.
13CO
2labelling
One day before the gas measurements, microcosms were enclosed in an airtight transparent container, comprising a volume of 17 L (Figure 6). 10 mL of 13C labelled CO2 (99% atom
excess 13C) was injected with a gastight syringe through a closable valve inserted in the container wall. The container remained closed during 2 hours to allow photosynthetic uptake of 13CO2 by the plant. After 2 hours, the container was opened and the plants aerated. After
15 minutes, the gas labelling procedure was repeated a second time as described above. During the pulse, shading meshes of the L- treatment were removed for maximum labelling efficiency (Simard S. et al., 1997).
!
The CO2 concentration was estimated directly before and after the pulse and before the end
of the 2 hours with a LI-820 CO2 gas analyser (LI-COR Biosciences, Lincoln, US).
!
Figure 6. Microcosms in transparent containers during 13CO2 labelling. 10 ml of 13
CO2 was
inserted into a valve on the container wall with a gastight syringe. Agroscope, AL. Corbel, 2014.
2.5.
Gas sampling
2.5.1.
N
20
One day after fertilisation, the measurement of gas fluxed started. The headspace was adjusted to a height of 11 cm above the soil surface and was closed for a period of 10 minutes. The gas in the headspace was pumped through a sample loop into a TEI46c automated N2O analyzer (Thermo Fisher Scientific, Waltham, US).
2.5.2.
N
2For the measurements of 15N2O and 15N2 with the 15N gas flux method (Stevens and
Laughlin, 1998), the headspace waskept closed for 2 hours to allow the accumulation of 15N2
in the atmosphere. After 2 hours, 20 ml of the headspace air was sampled using a disposable syringe and needle (16 mm lengh x 0.5 mm diameter) and transferred into evacuated 12 ml Exetainer tubes (Labcom High Wycombe, GB) for later analyses. Each day, two pots were chosen as controls to check for linearity of N2-fluxesin the headspace. For this purpose a sample was taken at 0, 30, 60, 90 and 120 min after closing the headspace. Gas fluxes were measured daily between 10 and 12 AM during seven days in the same order and the same time period resulting in 7 flux measurements per microcosm.
The timeframe between 10 and 12 AM was chosen because measurement taken at this time of day have proven to render representative values for average daily gas fluxes (R. Laughlin,
personal communication).
2.6.
Harvest
2.6.1.
Main experiment
At harvest, soil samples were taken with a soil core sampler in each pot from the edge of the microcosm (defined as bulk soil). The shoot was removed with the roots and was agitated to collect the remained soil on the roots (defined as rhizosphere soil). Three soil core samples were respectively combined to a composite sample from which subsamples were taken for
13
CO2, RNA, DNA and PLFA analysis. The samples for RNA, DNA and PLFA analysis were
8!
!
stored in paper bags and dried at -60°C. The shoots (including fruits) where cut at soil surface, dried at 60°C and weighed. The roots were collected, rinsed with water, cut into pieces < 2cm, and stored in 50% Ethanol. The microcosms were emptied, the hyphal bags collected, subsamples taken and immediately frozen in liquid nitrogen and stored at -80 °C for later RNA, DNA and PLFA analysis. The remaining substrate was mixed thoroughly and soil samples taken for later soil analysis.
2.6.2.
Metagenomic pots
During the gas measurements, samples for the same analyses as mentioned above were taken from the metagenomic pots at three timepoints : 24 hours after the fertilization pulse, 72h after the fertilization pulse and at final harvest after the gas measurements. At each occasion, soil samples were taken with a soil core sampler in each pot from very close to the plant (defined as rhiszosphere soil) and from the edge of the microcosm (defined as bulk soil). Also, one of the three hyphal bags was removed from the microcosm at each occasion. The samples at final harvest were taken as described above and all samples were stored as described above.
2.7.
Laboratory analysis
2.7.1.
Plant biomass and nutrient content
Dried plant shoots were weighed, ground with a centrifuge mill and the total P concentration was analysed photometrically according to (Watanabe and Olsen, 1965) after dry ashing. N concentrations were analysed after combustion with an element analyser (varioMax CN, elementar, Hanau, DE).
2.7.2.
Soil N content
Mineral soil N concentration at the end of the experiment was analyzed after extraction with 0.01M CaCl2.
The determination of Nitrate (NO3-N) was based on the cadmium reduction method. Nitrate
was dialysed, buffered and passed through a column containing granulated copper-cadmium to reduce nitrate to nitrite. The nitrite is then determined by diazotizing with sulfanilamide and coupling with N-(1-napthyl)ethylenediamine dihydrochloride to form a colored complex which is measured using a Dionex DX500 anion chromatograph (Dionex Corporationm Sunnyvale, CA).
Ammonium (NH4-N) was dialysed, buffered and chlorinated to monochloramine which reacts
with salicylate to 5-aminosalicylate. After oxidation, a green colored complex is formed and the absorbance was measured using a continuous-flow Analyzer(Skalar, Breda, NL).
2.7.3.
Microbial Biomass C and N
Microbial biomass C and N contents was assessed by the chloroform fumigation extraction (CFE) carried out on duplicate samples according to Vance et al. (1987). Duplicate samples were constituted of 20 g dry matter soil subsamples and extracted with 80 mL of a 0.5m K2SO4 solution. Organic C (TOC) in the extracts was determined by infrared spectrometry
after combustion at 850°C (DIMATOC® 2000, Dimatec, Essen, Germany). Total N was subsequently measured in the same sample by chemoluminescence (TNb, Dimatec, Essen, Germany). Microbial biomass C and N was calculated according to Joergensen (1996) and Joergensen and Mueller (1996).
2.7.4.
AMF Analysis
2.7.4.1.
Root colonization
The cut root fragments were cleared with 10%KOH at 80°C for 20 minutes, acidified and stained with a vinegar mixture with black ink (Parker Quink Ink) at 80°C for 20 minutes according to the method of Vierheilig et al. (1998) with slight modifications. The stained roots were then stored in 50 % Glycerol (Merck, Darmstadt, Germany) until further usage on a microscope. The percentage of root length colonized by the AMF was assessed using a modified line-intersection method (McGonigle et al., 1990). 100 intersections were counted per sample for all pots, including the equal performance test.
2.7.5.
Statistical analysis
Plant biomass, plant N and P contents, soil data, microbial biomass C and N, cumulative N20 emissions parameters were statistically analysed using two linear mixed effects models with the AMF treatment as fixed effect. For the equal performance test, a one-way ANOVA was performed.
Cumulative gas N20 emissions were calculated by linear interpolation between
measurements. Non parametric Kruskal-Wallis tests were performed to test AM fungal parameters between the two AMF treatments.
Effect of the shading and the fertilization treatments were analysed in separate models containing the AMF treatment and either the shading- or the fertilization treatment and their interactions as fixed effects. The Block effect was included as random effect.
Repeated gas-flux measurements were analysed using a linear mixed effects model including the AMF treatment, either the shading- or the fertilization treatment and the time measurement as fixed effects. As random effect, the pot number nested within Block was included.
Model residuals were checked for normality and homoscedasticity by plotting against fitted values for linear mixed effects models or using Bartlett’s test and Shapiro-Wilk test for the analysis of variance with a one-way ANOVA. The data were log-transformed or sqrt-transformed when necessary.
In Block one, 14 pots showed soil properties, very distinct from the other pots resulting in very low plant growth and high N20 fluxes. Therefore, theses pots were excluded from the
analyses.
10!
!
3. Results
3.1.
Effect of AMF treatment
3.1.1.
Gas emissions
24h after fertilization and watering, the N20 emissions curves of both AMF treatments
increased. After the initial phase, N20 fluxes did not differ significantly between the M and NM
treatments. At the end of the experiment, the total of N20 flux emitted was similar between M
and NM microcosms (Table 2)
.
Table 2."ANOVA output of the repeated-measures analysis for N20 fluxes for the M and NM treatments.The factor time comprised 7 levels (one measurement each day).The factor AMF consisted of two levels, mycorrhizal (M) and non-mycorrhizal (NM) (n=10 for the M and n=9 for the NM).The Block and the pots were included as random effects."
Anova Outputs of repeated N20
measurements for M and NM treatments
log(N20) F-value P-value
AMF:ti 0.027 0.868
AMF 1.073 0.315
ti 19.820 <.0001
Table 3. ANOVA output of the repeated-measures analysis for N20 fluxes for the shading and the fertilization treatments.The factor time comprised 7 levels (one measurement each day).The factor shading consisted of two levels, high light supply (L+, n=19), low light supply (L-=13), the factor fertilization of two levels, high nitrogen supply (N+, n=13), low nitrogen supply (N-, n=19). The Block and the pot number were included as random effects. Significant values are in bold."
ANOVA output of
repeated N20 measurements for the
shading treatment
ANOVA output of
repeated N20 measurements for the
fertilization treatment log(N20) F-Value P-Value log(N20) F-Value P-Value
shading:AMF:time 1.702 0.123 ferti:AMF:time 0.49681 0.8101 shading:AMF 0.000 0.987 ferti:AMF 0.52122 0.4765 shading:time 1.934 0.078 ferti:time 0.2926 0.9398 AMF:time 0.756 0.606 AMF:time 2.4658 0.026 shading 3.748 0.063 ferti 0.33035 0.5702 AMF 1.035 0.318 AMF 3.71273 0.0646 time 77.092 <.0001 time 77.76165 <.0001
There was no significant interaction with AMF and either the shading- or fertilization treatment in N20 fluxes during the measurement time. (Table 3)
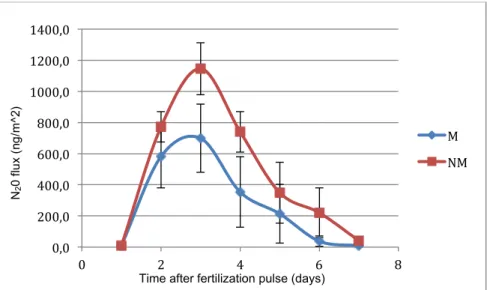
A significant difference between the non-mycorrhizal and mycorrhizal treatments during the time could be detected in the fertilization model (AMF:time interaction F=2.46, P=0.026). The N20 curve at high nutrient supply showed a lower N20 peak and a lower evolution in the
M treatment compared to the NM treatment. At low nitrogen supply, the peak was reached earlier for the M treatment than for the NM treatment and decreased more quickly (Figure 7).
!
Figure 7. N20 emissions curve of the M treatment and NM treatment at high nutrient supply.!
3.1.2.
AMF parameters
Differences in root colonization could be detected between the two AMF treatments. The mutants did not completely suppress root colonization by AMF but significantly reduced it. The percentage of hyhal colonization in mycorrhizal microcosm is 17 %, whereas in non-mycorrhizal microcosms, there are only 7 % colonized roots. The same tendency is observed for vesicular and arbuscular colonization (Tables 4 and 5).
There was no significant interaction of the AMF treatment and either the shading- or fertilization treatment in the root colonization.
However, for the shading treatment, the root colonization was globally higher at low light supply than at high light supply.
The treatment with the high nutrient supply did not show any differences compared to the treatment at low nutrient supply.
0,0! 200,0! 400,0! 600,0! 800,0! 1000,0! 1200,0! 1400,0! 0! 2! 4! 6! 8! M! NM!
Time after fertilization pulse (days)
N2 0 fl ux ( n g/ m ^ 2 )
12!
!
Table 4. Statistical outputs of cumulative N20 emissions, plant, AM fungal and soil parameters
of the microcosms planted with mycorrhizal plants (M treatment) and non-mycorrhizal plants (NM) at high (N+) or low (N-) nitrogen supply and at high (L+) and low (L-) light supply. Values are presented as mean with the standard error in bracket, p-values are obtained from linear mixed effects model with the AMF treatment and either the fertilization treatment or the shading treatment as factor and the block as random effect. Significant values are in bold. * log transformed ** sqrt-transformed. NH4 data are not shown because most values were below the
detection limit.
Parameter P-value
M / MN M N+ / MN N+ M L- / MN L-
ferti:AMF ferti AMF shading:AMF shading AMF
cumulative N20* (mg N20/pot) 0.411 0.340 0.077 0.803 0.625 0.428 0.414 Plant biomass Shoot (g)* 0.787 0.312 0.034 0.676 0.243 0.338 0.666 Root (g)* 0.630 0.441 0.029 0.203 0.584 0.763 0.978 Total (g)* 0.799 0.301 0.030 0.647 0.254 0.352 0.666 Plant P content 0.350 0.103 0.731 0.635 0.128 0.688 0.807 AMF Parameters HC (%)** 0.002 0.776 0.547 <.0001 0.362 0.018 <.0001 VC (%) 0.745 0.945 0.052 0.568 0.016 0.027 0.033 AC (%) <.0001 0.685 0.337 <.0001 0.128 0.013 0.000 Soil data N03-*
(
mg/kg dry soil) 0.774 0.878 <.0001 0.777 0.862 0.107 0.616 NH4+ (mg/kg dry soil) NA NA NA NA NA NA NANmin (mg/kg dry soil) 0.767 0.877 <.0001 0.767 0.865 0.106 0.610
Microbial biomass
C content (mg/ kg dry soil)* 0.051 0.449 0.302 0.029 0.546 0.548 0.036 N content (mg/kg dry soil)* 0.600 0.12 0.008 0.558 0.527 0.587 0.872
C/N ratio* 0.768 0.163 0.001 0.129 0.646 0.713 0.485
3.1.3.
Plant biomass
The shoot, root and total biomass, plant P content and soil mineral N at the end of the experiment did not differ between mycorrhizal and non-mycorrhizal microcosms.
There was no significant effect of the interaction between AMF and the shading- or fertilization treatment in any of the measured variables.
Plant shoot, root shoot and total biomass were significantly higher in the fertilization model at high nutrient supply than at low nutrient supply (Figure 8).
!!
!
!
Figure 8. Means of the shoot and root biomass of mycorrhizal and non-mycorrhizal microcosms with shading and fertilization treatments. No significant effect of the interaction between AMF and both treatment were detected.
3.1.4.
Soil data
There was no significant difference between mycorrhizal and non-mycorrhizal microcosms in microbial biomass either in N or C content or for the C/N ratio.
There was no significant interaction of either the fertilization or the shading treatment in microbial biomass data.
For the fertilization treatment, the microbial biomass C was significantly higher for the mycorrhizal microcosms than the non –mycorrhizal microcosms when plants received a high nutrient supply.
For the shading treatment, there was a significantly higher microbial biomass C for the M treatment compared to the NM treatment when plants were shaded (Figure 9).
!
Figure 9. Means of the microbial C and N and the ratio C/N of mycorrhizal and non-mycorrhizal microcosms with shading and fertilization treatments. Biomass C was significantly higher for microcosms with AMF when plants are shaded and fertilized (N+).
0,00! 0,50! 1,00! 1,50! 2,00! 2,50! M! NM! M!N+! NM!N+! M!LW! NM!LW! Root!(g)*! Shoot!(g)*! 1050,00! 1100,00! 1150,00! 1200,00! 1250,00! 1300,00! 1350,00! 1400,00! M! NM! M!N+! NM!N+! M!LW! NM!LW! C/N! microbial!biomass!N! Microbial!biomass!C!
14#
#
Table 5. Means with the standard error in brackets of the cumulative N20 emissions, plant, AM fungal and soil parameters of the microcosms planted with mycorrhizal plants (M treatment) and non-mycorrhizal plants (NM), of the fertilization (N+ and N-) and shading treatment (L+ and L-).
Parameter M NM M N+ NM N+ M L- NM L-
mean mean mean mean mean mean
cumulative N20 (mg N20/pot) 0.15 (±0.04) 0.15 (±0.03) 0.14 (±0.06) 0.25 (±0.05) 0.14 (±0.02) 0.23 (±0.08) Plant biomass Shoot (g)* 1.36 (±0.15) 1.36 (±0.20) 1.52 (±0.13) 1.95 (±0.14) 1.45 (±0.11) 1.51 (±0.08) Root (g)* 0.04 (±0.01) 0.04 (±0.01) 0.05 (±0.01) 0.07 (±0.01) 0.04 (±0.00) 0.04 (±0.00) Total (g)* 1.40 (±0.15) 1.41 (±0.20) 1.58 (±0.13) 2.02 (±0.14) 1.49 (±0.11) 1.55 (±0.08) Plant P content 2.90 (±0.11) 3.24 (±0.28) 3.33 (±0.09) 2.71 (±0.33) 3.26 (±0.09) 2.50 (±0.04) AMF Parameters HC (%)** 16.90 (±2.45) 7.00 (±1.32) 16.16 (±5.25) 5.85 (±1.16) 22.00 (±3.27) 8.00 (±1.83) VC (%) 1.80 (±0.83) 1.50 (±0.37) 0.66 (±0.33) 0.28 (±0.18) 4.33 (±0.72) 0.75 (±0.48) AC (%) 7.90 (±1.29) 1.30 (±0.58) 6.50 (±2.04) 0.85 (±0.34) 13.44 (±3.10) 1.25 (±0.63) Soil data N03-*
(
mg/kg dry soil) 156.05 (±7.92) 152.43 (±6.72) 199.91 (±10.48) 197.62 (±6.96) 141.08 (±6.15) 137.67 (±6.07) NH4 + (mg/kg dry soil) 0.12 (±0.06) 0.00 (±0.00) 0.11 0.07 0.00 (±0.00) 0.00 (±0.00) 0.00 (±0.00)Nmin mg/kg dry soil) 156.17 (±7.95) 152.43 (±7.09) 200.05 (±10.55) 197.62 (±6.96) 141.08 (±6.15) 137.67 (±6.07)
microbial biomass
C content (mg/ kg dry soil)* 1254.60 (±21.89) 1198.6 (±13.65) 1262.5 (±25.67) 1235.17 (±10.70) 1249.7 (±21.54) 1219.3 (±13.79)
N content (mg/kg dry soil)* 126.69 (±4.86) 122.80 (±4.94) 104.17 (±3.09) 116.28 (±5.51) 126.47 (±4.14) 131.89 (±12.52)
3.2.
Equal performance test
3.2.1.
N
20 emissions
In the absence of AMF in sterile soil, the test for equal performance showed a significant interaction of AMF treatments with the time measurement on N20 emissions (AMF:time
interaction : F-Value = 4.0847, P-value= 0.0011) (Table 6).
Table 6. ANOVA output of the repeated-measures analysis for N20 fluxes of the equal performance test.The factor time comprised 7 levels (one measurement each day).The factor AMF consisted of two levels, mycorrhizal (M) and non-mycorrhizal (NM) (n=10 for the M and n=10 for the NM).
Anova Outputs of repeated N20
measurements for M and NM treatments
log(N20) F-Value P-Value
AMF 1.038 0.323
time 11.933 <.0001
AMF:time 4.085 0.001
3.2.2.
Plant biomass
There were significant differences in plant shoot and total biomass. NM plants had 15% lower biomass than M plants (Table 7).
16#
#
3.2.3.
Soil data
There was no significant difference between mycorrhizal and non-mycorrhizal microcosms in microbial biomass either in N or C content or for the C/N ratio.
Mineral soil N was similar for both mycorrhizal treatments.
Table 7. Statistical outputs of cumulative N20 emissions, plant, AM fungal and soil parameters of the microcosms planted with mycorrhizal plants (M treatment, n=10) and non-mycorrhizal plants (NM, n=10) in sterile soil. Values are presented as mean, p-values are obtained from a linear model with the AMF and block as effects. Significant values are in bold. * log transformed.
Parameter M NM
mean se mean se pvalue cumulative N20* (mg N20/pot) 2.89 0.00 2.89 0.01 0.787 Plant biomass Shoot (g) 5.17 0.19 4.43 0.18 0.013 Root (g) 0.12 0.01 0.12 0.01 0.964 Total (g) 5.30 0.19 4.56 0.18 0.013 Plant P content 2.89 0.11 2.89 0.14 0.982 AMF Parameters HC (%) 0.00 0.00 0.00 0.00 NA VC (%) 0.00 0.00 0.00 0.00 NA AC (%) 0.00 0.00 0.00 0.00 NA Soil data N03-
*(
mg/kg dry soil) 69.81 1.57 80.51 6.45 0.094 NH4 *(
mg/kg dry soil) 7.27 0.94 8.79 1.63 0.774Nmin*
(
mg/kg dry soil) 77.05 2.04 89.29 5.12 0.021microbial biomass
C content (mg/ kg dry soil) 19.49 2.08 13.95 2.55 0.12
N content (mg/kg dry soil) 242.85 12.25 223.11 13.00 0.281
4. Discussion
Assessing the impact of AM fungi on soil ecosystems is difficult. While it was established that AMF play a key role in soil ecological interactions and plant nutrition, only a few studies showed until now that mycorrhizal fungi can influence N20 emissions.
Here we tried, on one hand, to demonstrate that AMF can contribute to reduced N20
emissions and enhanced N2 emissions. On the other hand, with two management treatments
using different nutrient and light supplies, we wanted to show that the effect of AMF on N20
emissions could depend on the nitrogen and carbon supply and that this could have a role in the global release of greenhouse gas N20.
However, our results could not provide a new mechanistic pathway by which AMF can influence soil ecosystem functioning and N20 emissions.
4.1.
Effect of AMF on N
20 emissions
First, there were no clear significant effects of AM fungi on N20 emissions. This was
surprising, because the management of the AMF treatment was made in line with a similar experiment that showed that the presence of AMF significantly reduces N20 emissions
(Bender et al., 2014).
In this experiment, the use of Tomato-Mutant plants was chosen to permit a better manipulation of the establishment of mycorrhizal fungi, always in line with the same previous experiment (Bender et al., 2014). However, the absence of effects of AMF should suggest that there was maybe a depression in the conservation of the mutation during the seed multiplication. The root colonization of the two AMF genotypes in our experiment was strongly reduced compared to the previous similar study.
P availability in the soil was not checked during the experiment.. It can therefore not be excluded that the P availability in the soil, at the beginning of the experiment, was already at a high level that plants were saturated and did not perform symbiosis with the AMF as expected. This could be an explanation for the low root colonization rate we observed. Furthermore, also the equal performance test showed unexpected results as both genotypes did not grow similarly despite the same managements and growing conditions. In fact, wild-type shoot biomass was higher than mutant shoot biomass. It cannot be excluded that there were some non-target effects resulting from differences between the two genotypes (plant and root growth, flowering…) independent of AMF.
The BC1-mutant/wildtype pair had been proposed as a suitable combination for experimental systems that aim at testing the effect of AMF (Rillig et al., 2008). This study did not find differences in the performance of the genotypes in absence of AMF neither did the study of Bender et al. (2014). However, the characteristics of the mutation are poorly described and the genes involved in the mutation are unknown. (Y. Kapulnik, personal communication). It is therefore difficult to identify the possible reasons why this test system did not perform as expected in the present study.
However, we observed that there was a higher microbial biomass C with AMF when plants were shaded or fertilized with a high nutrient rate. This could result of a microbial community shift mediated by the presence of AMF. Studies already showed that AM fungi could have the ability to modify the microbial community in the rhizosphere (Singh et al., 2008). Some bacteria of the species Pseudomonas could be favored whereas other species declined. Therefore, denitrification could be directly affected, through modification of densities of microbes involved in this process; or indirectly affected through shifts in the intensity of competition for exudates with non-denitrifiers. (Christensen and Jakobsen, 1993). This could be linked to the significant effect of AMF on N20 emissions in the fertilization treatment with
the high nutrient supply and explain the difference we saw in the N20 gas production with and
18#
#
Further analysis of the gene copy numbers involved in the denitrification process should be performed in order to analyze if there was a correlation between the AMF abundance and these genes. However, those analyses were not performed in the present study because of the lack of enough satisfying statistical results on the gas emissions data and therefore have limited our work and further analyses.
4.2.
Effect of the fertilization treatment
Second, there was no significant interaction of fertilization with AMF in relation to N20
emissions.
The AMF abundance was not influenced by the fertilization treatment. This was not expected as studies showed that the abundance of AMF in soil depends on soil nutrient availability and declines with high nutrient supplies and intensive land use (as increasing input of nitrogen was associated with a reduction of AM spore abundance and hyphal and vesicular root infection Eggerton-Warburton and Allen, 2000). We can also suppose that the fertilization rates we used in the experiment were too high, also for the treatment with the low nutrient supply, and this could have disrupted the symbiosis between plants and AM fungi.
Furthermore, it was already shown that AMF can acquire significant amounts of nitrogen and transfer it to the plants (Govindarajulu et al.). However, in the present experiment, there was no significant effect of the AM fungi on nitrogen availability in the soil. This suggests that the N acquisition by AMF fungi was relatively low for this study time. N could also be lost from soil through bacteria and soil organisms involved in denitrification processes but the impact of the soil microbes on nutrient cycling is still poorly understood and warrants further investigations. To test differences in bacterial communities involved in the denitrification between the treatments, we should have quantified the copy numbers of the key genes involved in the denitrification (from the hyphal bags, bulk soil and rhizosphere soil), but these analyses were not performed at this time.
Furthermore, the gaseous losses of N20 only showed significant differences in the AMF
treatment with high nutrient supply. N20 emissions were lower for the M treatment than for
the NM treatment. This could indicate that the presence of the fungi can reduce N20
emissions by influencing microbial communities involved in the denitrification but the absence of correlation between N20 emissions and AMF abundance did not permit more
conclusions.
4.3.
Effect of the shading treatment
As for the fertilization treatment, there was no significant interaction of the shading treatment with AMF in relation to N20 emissions. It is possible that the shading period was also not long
enough to permit differences in the carbon supply from the host plant.
We expected that shading plant would decrease the abundance of AMF because of a lower carbon-supply from the plant. However, in contrast to our expectations, we observed that root colonization was significantly higher for the shaded plants than for the unshaded plants, for both mycorrhizal and non-mycorrhizal treatments. We can suppose that the light supply for the unshaded plant was not adapted and was maybe too high, that shaded plants performed better with the shading mesh and, this increased AMF colonisation for the shaded plants. For maybe better and more conclusions, further analyses should be performed such as 13C soil analysis in the rhizosphere and in the bulk soil in order to show that, as some studies suggest (Cheneby et al., 2004), AMF could enhance the transport of C into the bulk soil, where denitrifiers are less abundant and therefore decrease the denitrification rate.
4.4.
Experimental difficulties
Third, we had in this experiment three main hypotheses which focused on different but linked pathways (Carbon cycle and Nitrogen cycle) by which AMF could influence denitrification. We should maybe have focused on only one detailed mechanistic pathway instead of testing additional mechanisms as showing a direct cause-effect relationship for mechanisms with complex interactions was maybe too ambitious. An experiment included less treatments and more replicates should be a better plan experimental plan to facilitate the study.
Furthermore, we observed that 14 pots of the block One could not be integrated in any analysis because of very distinct soil properties and high N2O emissions. Oxygen availability
is a key factor affecting denitrification with typically higher N20 emissions with high water
content and low 02 availability (Phillipot et al. 2009). The 14 pots had higher soil density and
therefore the 02 availability was strongly reduced and denitrification was generally higher.
However, we could not at this time explain why the soil properties were so different compared to the other soil mixtures which came from the same field and had been treated similarly.
Moreover, the exclusion of the pots from the analysis confronted us with statistical difficulties. Because of the removal of the pots out from the analysis, and therefore the absence of some replicates in the test, the experimental plan was unbalanced and the statistical analyses were certainly not so powerful as they should have been.
It was also not excluded that there were some failures during the harvest and the plant analysis.
4.5.
Soil-Plant-Fungi interaction’s complexity
Soils are a complex mixture of several materials and organisms and are characterized by complex physicochemical and biological interactions. The investigation of soil processes like plant-fungal interactions and their effects on ecosystem functions is difficult as these processes are influenced a wide range of factors, which are still poorly understood.
For example, if studies showed that fertilization could have negative effects on the AMF abundance (Van der Heijden, 2010), it is unknown how the fertilization must be considered to understand how it alters other soil microbes and ecosystem processes. Therefore, it is possible in our study that the microbial communities of the microcosms were strongly affected by the fertilization rate we choose. Hence, direct or indirect consequences on AMF soil characteristics or other soil processes are in this case difficult to assess.
20#
#
5. Conclusion
In conclusion, with the experimental design presented in this study, no effect of arbuscular mycorrhizal fungi was detected on N20 and N2 emissions. Therefore, we could not validate
the hypothesis that AMF affect gaseous losses through denitrification.
Furthermore, there was no significant effect of either the fertilization treatment or the shading treatment or of their interactions on N20 production. Hence, we did not confirm the
mechanism-theory of the carbon-supply dependence by which a lower carbon supply reduces the abundance of AMF and reduces differences between mycorrhizal and non-mycorrhizal treatments. On the other hand, we could not prove the role of the nitrogen supply on the abundance of AMF and denitrification.
Even if our results did not permit new conclusions by which the AMF symbiosis could be related with N20 emissions, governed by the carbon supply from the plant or by the nitrogen
availability, they provide a support for further investigations.
There is a high functional complexity in the system we studied but other studies led to the hypothesis that AM fungi affect N20 and N2 gaseous losses through denitrification. Further
experiments should consider the use of other mutants or other methods to eliminate the AM fungi from the microcosms. Also the fertilization and shading methods could be ameliorated to maybe bring better results and more conclusions.
6. Bibliography
Bender, S.F., F. Plantenga, A. Neftel, M. Jocher, H.-R. Oberholzer, L. Koehl, M. Giles, T.J. Daniell, and M.G.A. van der Heijden. (2014). Symbiotic relationships between soil fungi and plants reduce N2O emissions from soil. Isme Journal 8:1336-1345.
Bobbink R., Hicks K., Galloway J., Spranger T., Alkemade R., Ashmore M., Bustamante M., Cinderby S., Davidson E., Dentener F., Emmett B., Erisman J.-W., Fenn M., Gilliam F., Nordin A., Pardo L. and De Vries W. (2010). Global assessment of nitrogen deposition effects on terrestrial plant diversity: a synthesis, Ecological Applications, Bd. 20, Nr. 1, pp. 30–59.
Canfield D. E., Glazer A. N., and Falkowski P. G. (2010). The Evolution and Future of Earth’s Nitrogen Cycle, Science, Bd. 330, Nr. 6001, pp. 192–196.
Cavagnaro T. R., Sokolow S. K., and Jackson L. E. (2007). Mycorrhizal effects on growth and nutrition of tomato under elevated atmospheric carbon dioxide, Funct. Plant Biol., Bd. 34, Nr. 8, pp. 730–736.
Cheneby D, Perrez S, Devroe C, Hallet S, Couton Y, Bizouard F et al. (2004). Denitrifying bacteria in bulk and maize-rhizospheric soil: diversity and N2O-reducingabilities. Can J Microbiol 50: 469–474.
Christensen H. and Jakobsen I. (1993). Reduction of bacterial growth by a vesicular-arbuscular mycorrhizal fungus in the rhizosphere of cucumber (Cucumis sativus L.), Biol
Fertil Soils, Bd. 15, Nr. 4, S. 253–258.
Cooper K. M. and. Losel D. M (1978). Lipid Physiology of Vesicular-Arbuscular Mycorrhiza, New Phytologist, Bd. 80, Nr. 1, S. 143–151.
David-Schwartz R., Badani H., Smadar W., Levy A. A., Galili G. und Kapulnik Y. (2001). Identification of a novel genetically controlled step in mycorrhizal colonization: plant resistance to infection by fungal spores but not extra-radical hyphae, Plant J., Bd. 27, Nr. 6, pp. 561–569.
Egerton-Warburton L. M. and Allen E. B. (2000). Shifts in arbuscular mycorrhizal communities along an anthropogenic nitrogen deposition gradient, Ecological
Applications, Bd. 10, Nr. 2, S. 484–496.
Fitter A. H.(2005). Darkness visible: reflections on underground ecology, Journal of
Ecology, Bd. 93, Nr. 2, pp. 231–243.
Galloway J. N., Aber j. D., Erisman j. W., Seitzinger s. P., Howarth r. W., Cowling e. B. and Cosby b. J. (2003). The nitrogen cascade, bioscience, bd. 53, nr. 4, pp. 341–356. Giles M., Morley N., Baggs E. M. and Daniell T. J. (2012). Soil nitrate reducing processes - drivers, mechanisms for spatial variation, and significance for nitrous oxide production, Front Microbiol, Bd. 3.
Govindarajulu M, Pfeffer PE, Jin HR, Abubaker J,Douds DD, Allen JW et al. (2005). Nitrogen transferin the arbuscular mycorrhizal symbiosis. Nature 435:819–823.
22#
#
Hodge A. and Fitter A. H. (2010). Substantial nitrogen acquisition by arbuscular mycorrhizal fungi from organic material has implications for N cycling, PNAS, Bd. 107, Nr. 31, pp. 13754–13759.
Joergensen R. G. and Mueller T. (1996). The fumigation-extraction method to estimate soil microbial biomass: Calibration of the kEN value, Soil Biology and Biochemistry, Bd. 28, Nr. 1, S. 33–37.
Knacker, T., C. A. M. van Gestel, S. E. Jones, A. M. V. M. Soares, H. J. Schallnass, B. Forster, and C. A. Edwards (2004). Ring-testing and field-validation of a Terrestrial Model Ecosystem (TME): an instrument for testing potentially harmful substances. Conceptual approach and study design. Ecotoxicology , pp.13:9–27.
Knowles R. (1982). Denitrification, Microbiol Rev, Bd. 46, Nr. 1, S. 43–70.
Liu B., Mørkved P. T., Frostegård A., and Bakken L. R. (2010). Denitrification gene pools, transcription and kinetics of NO, N2O and N2 production as affected by soil pH, FEMS
Microbiol. Ecol., Bd. 72, Nr. 3, pp. 407–417.
McGonigle TP, Miller MH, Evans DG, Fairchild GL, Swan JA (1990). A new method which gives an objective measure of colonization of roots by vesicular mycorrhizal fungi.
New Phytol 115: 495-501.
Philippot L., Andert J., Jones C. M., Bru D. and Hallin S. (2011).Importance of denitrifiers lacking the genes encoding the nitrous oxide reductase for N2O emissions from soil,
Global Change Biology, Bd. 17, Nr. 3, pp. 1497–1504.
Philippot L., Hallin S., Börjesson G. and Baggs E. M. (2009). Biochemical cycling in the rhizosphere having an impact on global change, Plant and Soil, Bd. 321, Nr. 1–2, S. 61– 81.
Rillig M. C., Ramsey P. W., Gannon J. E., Mummey D. L., Gadkar V. and Kapulnik Y. (2008). Suitability of mycorrhiza-defective mutant/wildtype plant pairs (Solanum lycopersicum L. cv Micro-Tom) to address questions in mycorrhizal soil ecology, Plant
Soil, Bd. 308, Nr. 1–2, pp. 267–275.
Schlesinger W. H. (2009). On the fate of anthropogenic nitrogen, Proc. Natl. Acad. Sci.
U.S.A., Bd. 106, Nr. 1, pp. 203–208.
Schüβler A., Schwarzott D. and Walker C. (2001). A new fungal phylum, the Glomeromycota: phylogeny and evolution, Mycological Research, Bd. 105, Nr. 12, pp. 1413–1421.
Singh K, Brajesh N. N. (2008). Relationship between assemblages of mycorrhizal fungi and bacteria on grass roots., Environmental microbiology, Bd. 10, Nr. 2, S. 534–41. Smith P., Martino D., Gwary Z. Cai, D., Janzen H., Kumar P., McCarl B., Ogle S., O’Mara F., Rice C., Scholes B., Sirotenko O., Howden M., McAllister T., Pan G., Romanenkov V., Simard S. W., Perry D. A., Jones M. D., Myrold D. D., Durall D. M. and Molina R. (1997). Net transfer of carbon between ectomycorrhizal tree species in the field, Nature, Bd. 388, Nr. 6642, S. 579–582.
Smith S. E. and Read D. J. (2008). Mycorrhizal symbiosis, Third Edition. Academic Press : San Diego.
Staddon P. L. (2005). Mycorrhizal fungi and environmental change: the need for a mycocentric approach, New Phytologist, Bd. 167, Nr. 3, pp. 635–637.
Stevens, R., and Laughlin, R. (1998). Measurement of nitrous oxide and di-nitrogen emissions from agricultural soils. Nutrient Cycling in Agroecosystems 52, 131-139. Toljander J. F., Lindahl B. D., Paul L. R., Elfstrand M. and Finlay R. D. (2007). Influence of arbuscular mycorrhizal mycelial exudates on soil bacterial growth and community structure, FEMS Microbiology Ecology, Bd. 61, Nr. 2, S. 295–304.
Van der Heijden M. G. A. (2010). Mycorrhizal fungi reduce nutrient loss from model grassland ecosystems, Ecology, Bd. 91, Nr. 4, pp. 1163–1171.
Vance E. D.,. Brookes P. C, and Jenkinson D. S. (1987). An extraction method for measuring soil microbial biomass C, Soil Biology and Biochemistry, Bd. 19, Nr. 6, S. 703–707.
Veresoglou S. D., Chen B. and Rillig M. C. (2012). Arbuscular mycorrhiza and soil nitrogen cycling, Soil Biology and Biochemistry, Bd. 46, pp. 53–62.
Vierheilig H.,. Coughlan A. P, Wyss U. and Piche Y. (1998). Ink and Vinegar, a Simple Staining Technique for Arbuscular-Mycorrhizal Fungi, Appl Environ Microbiol, Bd. 64, Nr. 12, S. 5004–5007.
Wang B. and Qiu Y.-L. (2006). Phylogenetic distribution and evolution of mycorrhizas in land plants, Mycorrhiza, Bd. 16, Nr. 5, pp. 299–363.
Watanabe, F. S., and Olsen, S. R. (1965). Test of an ascorbic acid method for determining phosphorus in water and NaHCO3 extracts from soil 1. Soil Science Society
of America Journal 29, 677-678.
Weier K. L., Doran J. W., Power J. F. and Walters D. T. (1993). Denitrification and the Dinitrogen/Nitrous Oxide Ratio as Affected by Soil Water, Available Carbon, and Nitrate,
I#
#
APPENDIX I – Denitrification cycle (Giles et al., 2012)
Partial soil nitrogen cycling pathways with an emphasis on denitrification (in green) showing the enzymes and genes involved in the process.
APPENDIX II - Method for the quantification of root colonization
(McGonigle et al., 1990)
#
#
#
!#
Alignement of the roots on the slide (above) and movement over theslide to count at least 100 intersections (down)
Example of root with 5 intersection. The blue parts are representing the arbuscular mycorrhizal fungus. The circle is representing a
III#
#
APPENDIX III – R-Script of the linear mixed effects model used in the
experiment.
Exemple of the analysis of the effect of AMF, the shading treatment and the interaction as fixed effects, the block and the pots as random effect on N20 gas emissions.