I
nfectious bovine rhinotracheitis is caused by BHV-1 and is clinically characterized by hyperemia andhy-Assessment of the long-term effect
of vaccination on transmission of infectious
bovine rhinotracheitis virus in cattle herds
hyperimmunized with glycoprotein E–deleted
marker vaccine
Bart Ampe, DVM; Luc Duchateau, PhD; Niko Speybroeck, PhD; Dirk Berkvens, PhD; Alain Dupont, MSc; Pierre Kerkhofs, PhD; Etienne Thiry, PhD; Marc Dispas, PhD
Objective—To assess long-term effects and risk factors for the efficacy of
hyperimmuniza-tion protocols against infectious bovine rhinotracheitis (IBR) during a longitudinal field study of dairy and dairy-beef mixed farms.
Animals—Approximately 7,700 cows from 72 farms.
Procedures—Farms were assigned to 3 treatment groups (hyperimmunization groups
[HIGs] 1 and 2, which were hyperimmunized with glycoprotein E [gE]–deleted marker vac-cines, and a nonintervention group [NIG]). Cattle in HIG 1 were initially vaccinated with an attenuated vaccine, whereas cattle in HIG 2 were initially vaccinated with an inactivated-virus vaccine. Cattle in both HIGs received booster inoculations with inactivated-inactivated-virus vac-cines at 6-month intervals. The risk for gE seroconversion was compared among experi-mental groups via a shared frailty model with a piecewise constant baseline risk to correct for seasonal and secular effects.
Results—Risk for gE seroconversion significantly decreased over time for the HIGs,
com-pared with the NIG. Seasonal changes in the risk of gE seroconversion were detected, with a higher risk during winter periods, compared with grazing periods. No significant differ-ence was detected between HIGs 1 and 2. The only significant risk factor was the number of buildings for cattle on a farm; the higher the number of buildings, the lower the risk for gE seroconversion. Prevalence of IBR decreased over time in both HIGs but remained con-stant or increased in the NIG.
Conclusions and Clinical Relevance—Hyperimmunization via repeated administration of
attenuated and inactivated-virus gE-deleted marker vaccines as well as inactivated-virus vaccines may provide a method for control of IBR. (Am J Vet Res 2012;73:1787–1793)
persecretion of the nasal mucosa, cough, and fever. Bovine herpesvirus-1 is also the causative agent of re-productive tract problems, such as infectious vulvo-vaginitis, abortions, and metritis after cesarean section. The worldwide distribution of BHV-1 makes it a major pathogen of cattle.1
Because it is an alphaherpesvirus, BHV-1 remains in the nervous system after infection in cattle and can be reactivated by stressful conditions.2 The frequency
and intensity of viral shedding after reactivation are in-fluenced by the strain virulence and the immune status of the animal.3 In countries (eg, Belgium4 and the
Neth-erlands5) where the seroprevalence for IBR is high, the Received September 21, 2011.
Accepted January 3, 2012.
From the Department of Comparative Physiology and Biometrics, Faculty of Veterinary Medicine, University of Ghent, B-9820 Merel-beke, Belgium (Ampe, Duchateau); the Institute of Health and So-ciety (IRSS), Université Catholique de Louvain, B-1200 Brussels, Belgium (Speybroeck); the Department of Animal Health, Epide-miology Unit, Institute of Tropical Medicine, Nationalestraat 155, B-2000 Antwerp, Belgium (Berkvens); General Direction, Statis-tics and Economic Information, SPF Economics, Middle Classes and Energy, Regentlaan 27, B-1000 Brussels, Belgium (Dupont); Veterinary and Agrochemical Research Centre, Groeselenberg 99, B-1180 Brussels, Belgium (Kerkhofs, Dispas); and the Department of Infectious and Parasitic Diseases, Veterinary Virology and Animal Viral Diseases, Faculty of Veterinary Medicine, University of Liège, B-4000 Liège, Belgium (Thiry).
Supported by the Federal Public Service Health, Food Chain Safety and Environment, Brussels, Belgium.
The authors thank Sophie F. Hamande, Benoît V. Maindiaux, and Frederic L. Sorgeloos for technical assistance.
Address correspondence to Dr. Ampe (Bart.Ampe@ugent.be).
ABBREVIATIONS
BHV Bovine herpesvirus
HIG Hyperimmunization group
IBR Infectious bovine rhinotracheitis
control strategy is based on repeated vaccination of all cattle in a herd. For the past 15 years, marker vaccines6,7
have allowed for the serologic discrimination between cattle infected with BHV-1 (seropositive against gE) and vaccinated cattle (seronegative against gE).8
Two field studies9,10 have been conducted over a
period of 1 year to assess efficacy for the repeated ad-ministration of gE-deleted marker vaccine to cattle in dairy herds. Both compared results for repeated vacci-nation with results for placebo treatments. The authors concluded that the repeated use of live-virus9 or
inacti-vated-virus10 vaccines reduces the incidence of gE
sero-conversion. Vaccination with a live-attenuated strain of virus resulted in a smaller reproductive ratio9 and was
used to control IBR in the Netherlands. This strategy was later rejected because of vaccine contamination.11
More recently, hyperimmunization protocols that in-volve the use of live-virus vaccines have been success-fully tested in 149 herds, mostly large dairy farms.12
Although a hyperimmunization protocol that in-volves the use of sequential administration of live-virus and inactivated-virus vaccines was found to be effi-cient,13 it has not been tested in farm settings.
Current-ly, putative risk factors for BHV-1 infection have been estimated via cross-sectional observational studies.5,14
Only randomized studies are able to determine that a risk factor is causative for the studied disease.
For the analysis of the study reported here, a new model for survival analysis was developed. The model was designed to take into account modification of the intensity of risk factors with time, clustering of animals in a herd, seasonal differences, and long-term change in risk over time (secular change). The objective of the study reported here was to assess in farm settings for a 28-month period the risk factors for BHV-1 infection in cattle herds hyperimmunized in accordance with 2 hyperimmunization protocols and compare them with those for herds without such interventions. We hypoth-esized that the infection rate in an HIG would decrease over time, compared with that for the NIG.
Materials and Methods
Animals—The study was conducted with cattle from 34 dairy herds and 38 dairy-beef mixed herds that were selected from a pool of 92 volunteer herds. Inclu-sion criteria for the herds were that farming activity was the only source of family income and that a herd com-prised ≤ 180 cattle.
Procedures—Farms were assigned to 3 groups (HIG 1, HIG 2, and NIG) by use of a randomization procedure (lottery procedure). All of the cattle in HIG 1 and 2 were hyperimmunized. This consisted of an initial 2 adminis-trations of marker vaccines (interval of 3 to 5 weeks be-tween administrations), which were followed by booster vaccinations at intervals of approximately 6 months. To ensure identification of the treated cattle, vaccinations were performed at the start of the study (January 1997) and then successively shortly before the start of the cattle pasture periods and as soon as possible after the start of the cattle stabling periods for a period of 28 months.
Cattle in HIG 1 initially received 2 intranasal ad-ministrations of an attenuated gE-deleted marker
vaccine.a,b Cattle in HIG 2 initially received 2 SC
ad-ministrations of an inactivated-virus gE-deleted mark-er vaccine.c,d Both hyperimmunized groups received
booster inoculations of the inactivated-virus vaccines,c,d
SC, at 6-month intervals. For the NIG, farmers used their usual vaccination schedules. All cattle of appro-priate age for vaccination in each herd were included in the study. Only gE-deleted marker vaccines were used for all 3 groups, which allowed for serologic differen-tiation between infected and uninfected but vaccinated cattle.8
Serologic monitoring—To limit the amount of ani-mal handling, serologic monitoring of all cattle was con-ducted via the same schedule as the vaccinations, which provided 6 cross-sectional blood sample collections of the 72 herds. Each blood sample was tested with an ELISA gE antibody test kit.e Inconclusive results were considered
as positive.15 Whenever possible, the serologic status of
calves that had positive results because of maternal anti- bodies was adjusted to that of the first test value obtained after those calves were 6 months old. In all other cases, cattle that had at least 1 positive test result were defini-tively considered as latent carriers and positive cattle for subsequent measurements. Calves < 6 months old for which no subsequent sample was available were ex-cluded because there was no further analysis to define their immune status. New cases of BHV-1 infection were defined as gE seroconversion during the interval since the preceding sampling period.
Questionnaire for the risk factor analysis—Each owner completed a questionnaire about the herd man-agement practices potentially linked to the risk of BHV-1 infection; the questionnaire was completed during a face-to-face interview. The questionnaire was designed on the basis of results for studies14,16 of within-herd and
between-herd risk factors and considered potential risk factors linked with herd management (ie, regular pur-chase of cattle, participation at fairs and shows, calf-dam relationship [whether calf was removed immedi-ately after birth], use of artificial insemination or natu-ral mating with bulls, and external sources of infection [ie, the presence of other farms within a radius of 100 m and possible contacts with other herds during the pas-ture period]).
Descriptive epidemiology—Six blood collections were performed for each herd during the study. For each sample collection, seroprevalence was estimated as the ratio of the number of gE-seropositive cattle to the number of cattle from which blood samples were collected.
Data analysis—Data analysis was conducted to ac-count for cattle lost to follow-up monitoring, clustering of data collected at the same farm (all cattle in a herd were managed in the same manner [random effect]), season (animal density differed between winter [sta-bling period] and summer [grazing period]), natural turnover of cattle (birth of calves and purchase of cattle were balanced against death, culling, and sale of cattle, which resulted in a continuous entrance of cattle into and exit of cattle from the study population), and long-term change of the risk ratio over time.
A survival model is the most appropriate technique to use for analysis of time-to-event data (eg, time to seroconversion). The expected seasonal effect was cor-rected by assuming 2 seasons/y (ie, summer and win-ter), each of which had a different constant baseline risk. This simple model was extended with a random effect for each farm, ui. The shared frailty was assumed to follow a 1-parameter gamma-distribution with a mean of 1 and variance of θ. This meant that an aver-age frailty (ui equal to 1) had no effect on the risk for seroconversion. This resulted in a piecewise constant baseline risk shared frailty model defined by the follow-ing equation:
hij(t) = ([λ1•I{t < 153}] + [λ2•I{153 < t < 335}] + …)ui•exp(α + βt•x
ijt)
where hij(t) is the risk for seroconversion at time t for cow j on farm i with covariates xijt at time t; λ1, 2, … are the baseline risks for period 1, 2, …; I is the indicator function, which is 1 if the condition is true and 0 if the condition is false; 153, 335, … are the boundaries of the seasons in number of days; exp(α) is the difference in risk at the start of the study between the HIGs and the NIG; and β is the effect of an HIG over time. The base-line risk for each group was the basebase-line risk of the NIG multiplied by exp(α). The differences at the start of the study were not expected to be significant.
Comparison of the time to seroconversion of the HIG cattle with that of the NIG was used to establish the secu-lar change in the time to seroconversion since the start of the hyperimmunization protocol on a farm. This implied that most cattle entered the study at a time different from 0. Only the period starting at the entrance of an animal (yij0) until an event or censoring time (yij) may have an
effect on the cumulative risk. Therefore, the risk function was integrated from yij0 to yij as follows:
yij
Hij(yij) =
∫
hij(t)•dtyijo
The β values for HIG 1 and HIG 2 were an indica-tion of the change in the risk over time. However, if
Blood
sample No.† HIG 1 HIG 2 NIG
1 2,140 (20) 2,379 (20) 3,387 (32) 2 2,194 (20) 2,449 (20) 3,337 (32) 3 2,169 (20) 2,383 (20) 3,284 (32) 4 2,152 (20) 2,211 (20) 3,208 (32) 5 2,086 (20) 2,278 (20) 3,162 (32) 6 1,688 (19) 1,797 (19) 1,718 (20) *Cattle in HIG 1 were initially vaccinated with 2 doses of an at-tenuated vaccine, whereas cattle in HIG 2 were initially vaccinated with 2 doses of an inactivated-virus vaccine. Then, cattle in both HIGs received booster inoculations with inactivated-virus vaccines at approximately 6-month intervals. For the NIG, farmers used their usual vaccination schedules. Only gE-deleted marker vaccines were used for all 3 groups. †To minimize cattle handling, blood samples were collected at the time of initial vaccinations (January 1997) and then at approximately 6-month intervals to coincide with 2 seasons (winter with stabling conditions and summer with grazing conditions).
Table 1—Number of cattle (No. of herds) in each of 3 experimen-tal groups* that were tested for gE seroconversion at 6 succes-sive blood sample collections.
Figure 1—Change in the mean gE seroprevalence of cattle in 3 experimental groups (HIG 1 [thin black line], HIG 2 [thick gray line], and NIG [dashed gray line]) as determined at each of 6 blood sample collections for dairy herds (A), female cattle of dairy-beef mixed herds (B), and male cattle of dairy-beef mixed herds (C). Cattle in HIG 1 were initially vaccinated with 2 doses of an attenu-ated vaccine, whereas cattle in HIG 2 were initially vaccinattenu-ated with 2 doses of an inactivated-virus vaccine. Then, cattle in both HIGs received booster inoculations with inactivated-virus vac-cines at approximately 6-month intervals. For the NIG, farmers used their usual vaccination schedules. Only gE-deleted marker vaccines were used for all 3 groups, To minimize cattle handling, blood samples were collected at the time of vaccinations (approx 6-month intervals).
hyperimmunization were to reduce the number of new infections, then a secular reduction (a negative β value for HIG 1 and HIG 2) in the risk for seroconversion would be expected.
Risk factors related to management practices that were obtained from the questionnaire were also intro-duced into the model as additional covariates. A for-ward-stepwise selection procedure was used to build the final model. Only risk factors with a value of P < 0.1 were considered for the stepwise procedure to build the final model. The corresponding survival function was then described by the following equation:
Sij(t) = exp ([λ1•I{t < 153}] + [λ2•I{153 < t < 335}] + …)•t•ui•exp(α + βt•x
ijt)
where Sij(t) is the survival function at time t. By use of these equations, the marginal likelihood for the ith cluster was calculated as follows:
∞ ni Li(λ, α, β, θ) =
∫
Π
(h0[yij]•ui•exp[α + 0 j = 1 βt•x ijt]) δij•exp(–H0[yij]•ui•exp[α + βt•xijt])•([u 1/θ – 1]/ [θ{1/θ}•Γ{1/θ}])•exp(–u/θ)•du
where Li(λ, α, β, θ) is the marginal likelihood for the ith cluster, H0 is the cumulative baseline risk, and δij is the censor indicator (1 in case of an event and 0 in case of right censoring). The variance of the frailties
(θ) may be interpreted as an indication of the differences among the farms (ie, the higher the variance, the greater the dif-ferences among the farms). Alternatively, after conversion to Kendall τ (estimated as θ/[θ + 2]), the variance may be con-sidered as a measure for the intraclass correlation.17
Separate models were fitted for dairy herds and dairy-beef mixed herds. Be-cause females and males were housed in separate buildings and had different pop-ulation turnover and contact structure, differences in their risk ratio for sero-conversion could be assumed. Therefore, separate analyses were also performed for each sex population of the mixed herds, following the same forward-stepwise selection of risk factors. For all final models, values of P < 0.05 were considered significant.
Results
Animals—One farmer in HIG 1 and another in HIG 2 opted to leave the study before the last win-ter period because they considered the schedule for collection of blood samples to be excessively restric-tive. In the NIG, 12 farmers left the study during the last period because they wanted to start a hyperim-munization program or were excluded because they wanted to modify the main type of production for their farm. Thus, at the end of the study, there were 19, 19, and 20 herds remaining in HIG 1, HIG 2, and the NIG, respectively (Table 1).
Dairy herds—Although the farms were ran-domly allocated to the various experimental groups, the mean seroprevalence at the start of the study was higher for HIG 1 (45%) than for HIG 2 (33%) and the NIG (35%; Figure 1). The gE seroprevalence decreased systematically in both hyperimmunized groups during the first 4 periods but remained al-most constant in the NIG. During the last period, the gE seroprevalence increased slightly in HIG 1, remained constant in HIG 2, and markedly increased in the NIG.
The estimated risks of gE seroconversion over time were calculated (Figure 2). At the start of the study, the baseline risks were not significantly different for HIG 1 and HIG 2, compared with that for the NIG (α values for HIG 1 and HIG 2 were not significantly different from 0; Table 2). The risk ratio for gE seroconversion was higher for the NIG than for HIG 1 or HIG 2. In addition, increased protection with time was observed for both HIG 1 and HIG 2, as indicated by a change in the risk over time in HIG 1 and HIG 2, compared with that for the NIG (β values for HIG 1 and HIG 2 were negative and significantly different from 0). Although the reduction over time was slightly greater for HIG 2 than for HIG 1, there was no significant difference in the risk ratio for gE seroconversion over time between the 2 HIGs.
The decreasing risk was also evident by the change in the mean seroprevalence on a herd-level basis
(Fig-Coefficient Estimate P value†
θ 1.563 (0.396) < 0.001 α HIG 1 –0.148 (0.566) 0.793 HIG 2 –0.568 (0.627) 0.365 β HIG 1 –0.734 (0.174) < 0.001 HIG 2 –0.761 (0.197) < 0.001 Building‡ –0.471 (0.182) 0.010
†Values were considered significant at P < 0.05. ‡Effect of an additional building for cattle on a farm.
α = Initial difference between the HIG and the NIG. β = Change over time attributable to the HIG. θ = Variance among farms.
See Table 1 for remainder of key.
Table 2—Estimate (SE) for the coefficients of the piecewise constant risk model for dairy cows in 3 experimental groups.*
Figure 2—Change in the risk ratio for gE seroconversion over time in dairy herds for HIG 1, HIG 2, and the NIG. Winter periods with stabled conditions (shaded areas) and summer conditions with grazing conditions (unshaded areas) are indi-cated. The initial 2-dose vaccinations were administered at time 0. See Figure 1 for remainder of key.
ure 1). The seroprevalence in the HIGs primarily had a pattern of decreasing values, whereas the seropreva-lence for the NIG remained almost constant.
Seasonal differences were determined by use of the risk for seroconversion for the NIG as the baseline value. The winter periods were always associated with a higher baseline risk than were the summer periods (Figure 2).
The estimated θ was 1.563 (Table 2). This corre-sponded to a Kendall τ of 0.439, which indicated a high correlation within the herds.
After consideration of all available risk factors, the final model revealed that only the number of buildings for cattle on a farm had an additional significant effect on the risk ratio. The greater the number of buildings on a farm, the lower the risk for gE seroconversion (risk ratio, 0.62/building).
Dairy-beef mixed herds—Although the farms were randomly allocated among the various experi-mental groups, the mean seroprevalence at the start of the study for the female population was lower for the NIG (36%) than for HIG 1 (56%) and HIG 2 (46%; Figure 1). In females, the baseline risk for
seroconver-sion was significantly higher for the HIGs than for the NIG (α values for HIG 1 and HIG 2 were significantly > 0; Table 3). There was no significant difference in the baseline risk for gE seroconversion between HIG 1 and HIG 2. Over time, HIG 1 and HIG 2 had a large and significantly lower risk for seroconversion, compared with the risk for seroconversion for the NIG (β values for HIG 1 and HIG 2 were significantly < 0), which indicated that the protection conferred by hyperimmu-nization increased over time and was twice as large as the value for dairy cattle.
In the male population, there were no significant differences between the 2 HIGs and the NIG at the start of the study or over time. Also, seasonal differences
were less pronounced in the male popula-tion, compared with seasonal differences in female cattle of beef-dairy mixed herds and for the dairy herds (Figure 3).
Clustering had an important effect on the model, which indicated that herd management practices and environmen-tal factors can have a major impact on the control of IBR. For female cattle in dairy-beef mixed herds, a value of 1.501 was estimated for θ (Kendall τ, 0.429), which was similar to the values for the dairy herds. However, the estimated θ in beef bulls was 2.761, which was much higher than that of the female cattle and resulted in an extremely high intraclass correlation (0.580).
All risk factors were considered for the final model of female and male cattle of the dairy-beef mixed herds. However, none of them had a significant effect on the risk ra-tio for gE seroconversion.
Discussion
The randomized longitudinal study re-ported here was based on the individual gE serologic follow-up monitoring of all cattle in 3 experimental groups on dairy and dairy-beef mixed farms. Two hy-perimmunization protocols were used, and both sig-nificantly reduced the risk of BHV-1 infection in the females, compared with the risk for the NIG. However, it was not possible to detect the same effect in the male population of the dairy-beef mixed herds. These results are consistent with those obtained in previous field studies that revealed a reduction of virus circulation in cattle herds hyperimmunized with live-virus vaccine9,12
or an inactivated-virus vaccine.10
It is not possible to make further comparisons be-tween results of other studies and those of the present study because conclusions of other studies were based on the reproduction ratio18 calculated for a period of 18
months in studies in which only female cattle > 1 year old were included. By comparison, the present study was based on an analysis of the time to seroconversion in all cattle on the farms measured over shorter inter-vals and for a much longer period (28 months). In con-trast to the calculation of the reproduction ratio, the proposed piecewise constant risk model estimates the Figure 3—Change in the risk ratio for gE seroconversion over time in dairy-beef
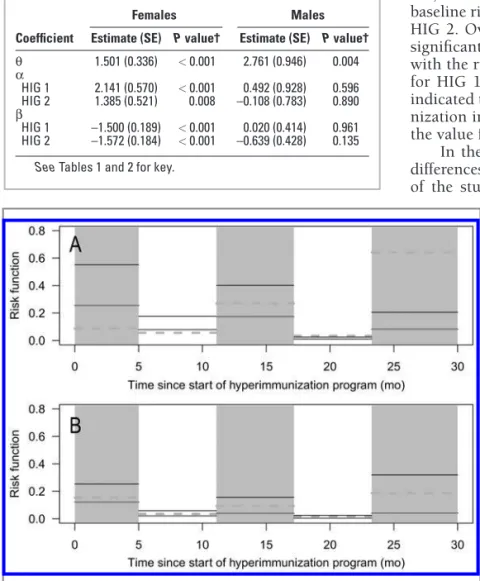
mixed herds for HIG 1, HIG 2, and the NIG for females (A) and males (B). See Figures 1 and 2 for remainder of key.
Table 3—Estimate (SE) for the coefficients of the piecewise con-stant risk model for cattle in 3 experimental groups* for dairy-beef mixed herds stratified on the basis of sex.
Females Males
Coefficient Estimate (SE) P value† Estimate (SE) P value†
θ 1.501 (0.336) < 0.001 2.761 (0.946) 0.004 α HIG 1 2.141 (0.570) < 0.001 0.492 (0.928) 0.596 HIG 2 1.385 (0.521) 0.008 –0.108 (0.783) 0.890 β HIG 1 –1.500 (0.189) < 0.001 0.020 (0.414) 0.961 HIG 2 –1.572 (0.184) < 0.001 –0.639 (0.428) 0.135
change in seroprevalence over time and takes into ac-count clustering, different levels of risk over time, sea-sonal effects, and the development of herd immunity. This results in more information about the behavior of the infection, immunity on a herd-level basis, and dif-ferences between herds than does only a single sum-mary measure such as the reproductive ratio.
Selection of the 2 hyperimmunization protocols was based on results of previous studies. The protocol for HIG 1 was based on the conclusions of an experi-mental trial13 that revealed successive administration
of live-virus and inactivated-virus vaccines induced the production of antibodies and a cellular immune response, which were significantly higher than those obtained with only a single administration. The pro-tocol for HIG 2 was based on the administration of an inactivated-virus vaccine, which had already been tested in a field setting, but for a shorter period.10 Both
protocols were designed to prevent the development of major problems linked with the intensive use of live-attenuated virus vaccines. These problems include con-tamination of the vaccine by another virus, reactivation or re-excretion of a gE-negative vaccine strain in a field setting,19 and potential emergence of highly pathogenic
gE-negative mutant strains of BHV-120 as a result of
re-combination between vaccine and field strains.
An NIG, rather than a placebo treatment, was used in the present study, even though it is more difficult to detect a significant difference between control and treatment groups. A placebo treatment was not accept-able because of the increased risk of virus circulation and infection, in comparison to the risk for the usual manage-ment procedures. In addition, it is unethical to force farm-ers to stop vaccinating cattle (ie, placebo treatment) for several years if their animals are selected for the control group. Thus, an NIG is commonly used to compare new treatments with standard treatments.21,22
In dairy herds, there were no differences in the ini-tial risk ratio, but the change over time was significant-ly < 0 for the HIGs. This resulted in a decrease in risk over time for the HIGs, compared with that for the NIG. The risk of gE seroconversion for HIG 1 was always higher than, or equivalent to, that for HIG 2 (Figure 2); however, the differences were not significant. This observation is in agreement with results of a study10 in
which animals hyperimmunized with inactivated-virus vaccines shed less virus after reactivation than did ani-mals vaccinated with live-virus vaccine. This suggests that the most efficacious approach for the eradication of BHV-1 is the use of inactivated-virus vaccines to re-duce reactivation, as opposed to the administration of live-virus vaccines in an attempt to prevent new infec-tions. This strategy is also supported by results of an-other study.23
The increased risk for seroconversion during the winter periods, which was caused by commingling of cattle of various age classes and infection status in barns, revealed the limits of hyperimmunization in stressful situations. To be effective, hyperimmuniza-tion has to be applied for a long period (as indicated by the significant interaction between time and treatment; Tables 2 and 3). Even then, virus circulation cannot be totally stopped. Therefore, additional bio-security
mea-sures should accompany the use of hyperimmunization protocols. First, adult cows and heifers should receive booster inoculations of inactivated-virus gE-deleted IBR vaccine at least 15 days before the end of the graz-ing period. Second, whenever possible durgraz-ing the win-ter period, gE-seropositive cattle should be separated from cattle seronegative for gE. The present study re-vealed that there was a significant decrease in the risk for seroconversion when a farm had more buildings for cattle. In addition, as a general rule, calves should be immediately removed from their dams, and young stock should not have contact with dry (nonlactating) cows. This will allow for complete initial vaccination and booster administration before contact with a group of older animals, which are potential virus shedders. The specific accelerated removal of gE-seropositive cat-tle should be used to decrease the length of the hyper-immunization schedule.
In dairy-beef mixed herds, there was a difference between the female and male populations. For the fe-male population, the findings were in agreement with those obtained for the dairy herds, although the risk ratio for seroconversion was significantly larger in the HIGs than in the NIG at the start of the study. This is probably attributable to the higher seroprevalence, and corresponding infection pressure, at the start of the study.
The risk of gE seroconversion in the HIGs de-creased over time, compared with that for the NIG, and there was no significant difference between the 2 HIGs. The decrease over time in the females of the dairy-beef mixed herds was faster than that of the dairy herds. The higher seroprevalence for the HIGs at the start of the study is a possible explanation for this.
For the male population, we did not detect a sig-nificant difference in the change of the risk for gE sero- conversion over time and the seroprevalence among the 3 groups, which had almost the same pattern. This may have been associated with an extremely high turnover rate associated with the management of feedlots (grouping of stressed cattle without previous testing for IBR and possi-ble infection before optimal protection from vaccination). A reduction in infection pressure can be expected when the number of cattle shedding virus decreases among older animals as a result of hyperimmunization. In this category, a high clustering of infection times at the farm level was observed (high θ; Table 3), which resulted in a higher correlation within the herds for the male popula-tion than for the female populapopula-tion. This is indicative of large differences among the farms and suggested that the management of each farm and environmental factors can have a major impact on the control of IBR.
In the present study, we suggested that hyperim-munization that involved repeated administration of attenuated and inactivated-virus gE-deleted marker vaccine (HIG 1) as well as inactivated vaccines (HIG 2) allowed for the control of IBR. The efficacy of vacci-nations can be maintained by appropriate management during the winter (cold season) and thus shorten the time until eradication of IBR.
a. Bayovac IBR-Marker vivum, provided by Bayer AG, Brussels, Belgium.
b. Rhinobovin Marker Live, provided by Intervet Inc, Brussels, Belgium.
c. Bayovac IBR-Marker inactivatum, provided by Bayer AG, Brus-sels, Belgium.
d. Rhinobovin Marker inactivated, Intervet Inc, Brussels, Belgium. e. HerdCheck, IDEXX, Westbrook, Me.
References
1. Straub OC. Infectious bovine rhinotracheitis virus. In: Dinter Z, Morein B, eds. Virus infections of ruminants. Amsterdam: Else-vier Science Publishers, 1990;71–108.
2. Lemaire M, Pastoret P-P, Thiry E. Le contrôle de l’infection par le virus de la rhinotrachéite infectieuse bovine. Ann Med Vet 1994;138:167–180.
3. Muylkens B, Thiry J, Kirten P, et al. Bovine herpesvirus 1 infec-tion and infectious bovine rhinotracheitis. Vet Res 2007;38:181– 209.
4. Boelaert F, Biront P, Soumare B, et al. Prevalence of bovine herpesvirus-1 in the Belgian cattle population. Prev Vet Med 2000;45:285–295.
5. Van Wuijckhuise L, Bosch JC, Franken P, et al. Epidemiologi-cal characteristics of bovine herpesvirus 1 infections deter-mined by bulk milk testing of all Dutch dairy herds. Vet Rec 1998;142:181–184.
6. Kaashoek MJ, Moerman A, Madic J, et al. A conventionally at-tenuated glycoprotein E-negative strain of bovine herpesvirus type-1 is an efficacious and safe vaccine. Vaccine 1994;12:439– 444.
7. Kaashoek MJ, Van Oirschot JT. Early immunity induced by a live gE-negative bovine herpesvirus 1 marker vaccine. Vet Mi-crobiol 1996;53:191–197.
8. Van Oirschot JT, Kaashoek MJ, Maris-Veldhuis MA, et al. An enzyme-linked immunosorbent assay to detect antibodies against glycoprotein gE of bovine herpesvirus 1 allows differ-entiation between infected and vaccinated cattle. J Virol Meth 1997;67:23–34.
9. Mars MH, De Jong MCM, Franken P, et al. Efficacy of a live glycoprotein E-negative bovine herpesvirus 1 vaccine in cattle in the field. Vaccine 2001;19:1924–1930.
10. Bosch J, De Jong M, Franken P, et al. An inactivated gE-negative marker vaccine and an experimental gD-subunit vaccine reduce
the incidence of bovine herpesvirus 1 infections in the field. Vaccine 1998;16:265–271.
11. Barkema H, Bartels C, Van Wuijckhuise L, et al. Outbreak of bovine virus diarrhea on Dutch dairy farms induced by a bovine herpesvirus 1 marker vaccine contaminated with bovine viral diarrhea virus type 2. Tijdschr Diergeneeskd 2001;126:158–165. 12. Makoschey B, Zehle H-H, Bussacchini M, et al. Efficacy of a live
bovine herpesvirus type 1 marker vaccine under field condi-tions in three countries. Vet Rec 2007;161:295–298.
13. Kerkhofs P, Renjifo X, Toussaint J-F, et al. Enhancement of the immune response and virological protection of calves against bovine herpesvirus-1 with an inactivated gE-deleted vaccine. Vet Rec 2003;152:681–686.
14. Van Schaik G, Dijkhuizen AA, Huirne RBM, et al. Risk factors for existence of BHV-1 antibodies on nonvaccinating Dutch dairy farms. Prev Vet Med 1998;34:125–136.
15. Kramps JA, Perrin B, Edwards S, et al. A European inter-labo-ratory trial to evaluate the reliability of serological diagnosis of bovine herpesvirus 1 infections. Vet Microbiol 1996;53:153–161. 16. Wentinck GH, Van Oirschot JT, Verhoeff J. Risk of infection with
bovine herpesvirus 1 (BHV1): a review. Vet Q 1993;15:30–33. 17. Duchateau L, Janssen P. Frailty distributions. In: Duchateau L,
Janssen P, eds. The frailty model. New York: Springer, 2008;117– 197.
18. Diekmann O, Heesterbeek J, Metz J. On the definition and the computation of the basic reproduction ratio (R0) in models for infectious diseases in heterogeneous populations. J Math Biol 1990;28:365–382.
19. Dispas M, Schynts F, Lemaire M, et al. Isolation of a glycopro-tein E deleted bovine herpesvirus-1 strain in the field. Vet Rec 2003;152:209–212.
20. Muylkens B, Meurens F, Schynts F, et al. Intraspecific bovine her-pesvirus 1 recombinants carrying glycoprotein E deletion as a vac-cine marker are virulent in cattle. J Gen Virol 2006;87:2149–2154. 21. Djulbegovic B, Clarke M. Scientific and ethical issues in
equiva-lence trials. JAMA 2001;9:1206–1208.
22. Pocock SJ. The pros and cons of noninferiority trials. Fundam Clin Pharmacol 2003;17:483–490.
23. Bosch JC, Kaashoek MJ, van Oirschot JT. Inactivated bovine herpesvirus 1 marker vaccines are more efficacious in reduc-ing virus excretion after reactivation than a live marker vaccine. Vaccine 1997;15:1512–1547.
![Peripheral forces: The growing impact of second-tier cities is narrowing the gap in research production [Comment]](data:image/gif;base64,R0lGODlhAQABAIAAAP///wAAACH5BAEAAAAALAAAAAABAAEAAAICRAEAOw==)