Université de Montréal
Classification et relations entre les traits fonctionnels des
crustacés zooplanctoniques : de l’organisme à l’écosystème
par
Marie-Pier Hébert
Département des sciences biologiques Faculté des arts et des sciences
Mémoire présenté à la Faculté des arts et des sciences en vue de l’obtention du grade de Maître ès sciences (M. Sc.)
Université de Montréal
Faculté des études supérieures et postdoctorales
Ce mémoire intitulé :
Classification et relations entre les traits fonctionnels des crustacés zooplanctoniques : de l’organisme à l’écosystème
Présenté par Marie-Pier Hébert
Abstract
Ecologists have long recognized that organisms are sustained by the flux, storage and turnover of ecosystem energy, which fuels biological metabolism, and material, used to construct biomass. Over the past three decades, the importance of individual organisms in regulating ecosystem processes, such as consumer-driven nutrient cycling, has been increasingly recognized. Occupying a central position in aquatic food webs, zooplankton are known to influence other trophic levels and exert a strong influence on energy fluxes or material processing in ecosystems. Several species’ characteristics have been pointed out as being good indicators, or predictors, of the effect of zooplankton on their environment, including individual body size, corporal stoichiometry and specific physiological rates. Most of these characteristics can also be termed “functional traits”. While the use of traits has recently gained popularity amongst aquatic community ecologists, few have applied this approach to concretely link zooplankton community structure to ecosystem processes. In the present study, we compiled data from a wide variety of literature to construct a database of crustacean zooplankton species and their traits contributing directly or indirectly to C, N or P ecosystem fluxes. Our literature search yielded over 9000 empirical observations on 287 different species and thereby allowed identification of knowledge gaps in the literature. We explored trait relationships amongst taxonomic units and between marine and freshwater habitats. Of all cross-correlations tested among 16 zooplankton traits, 35 were significant, with most traits being related to body mass. Our synthesis revealed significantly different patterns between freshwater and marine zooplankton respiration and allometry (body mass vs. length). We propose a novel trait classification scheme according to both organismal and ecosystem functions.
Résumé
Les écologistes reconnaissent depuis longtemps que les organismes sont soutenus par le flux, l’emmagasinage et le renouvellement d’énergie et de matériel de l’écosystème, puisqu’ils sont nécessaires au métabolisme biologique et à la construction de biomasse. L’importance des organismes dans la régularisation des processus écosystémiques est maintenant de plus en plus considérée. Situé au centre des chaînes trophiques aquatiques, le zooplancton influence les flux d’énergie et de matériel dans les écosystèmes. Plusieurs de leurs caractéristiques sont connues comme étant de bons indicateurs de leur effet sur l’environnement, notamment leur taille, contenu corporel et taux métabolique. La plupart de ces caractéristiques peuvent être appelées « traits fonctionnels ». Alors que l’emploi des traits devient de plus en plus populaire en écologie des communautés aquatiques, peu ont su utiliser cette approche afin de concrètement lier la structure des communautés zooplanctoniques aux processus écosystémiques. Dans cette étude, nous avons colligé les données provenant d’une grande variété de littérature afin de construire une base de données sur les traits du zooplancton crustacé contribuant directement ou indirectement aux flux de C, N et P dans les écosystèmes. Notre méta-analyse a permis d’assembler plus de 9000 observations sur 287 espèces et d’identifier par le fait même ce qu’il manque à nos connaissances. Nous avons examiné une série de corrélations croisées entre 16 traits, dont 35 étaient significatives, et avons exploré les relations entre les unités taxonomiques de même qu’entre les espèces marines et d’eaux douces. Notre synthèse a entre autres révélé des patrons significativement différents entre le zooplancton marin et dulcicole quant à leur taux de respiration et leur allométrie (masse vs. longueur corporelle). Nous
Table des matières
Abstract ... iii
Résumé ... iv
Table des matières ... v
Liste des tableaux ... vii
Liste des figures ... viii
Liste d’abréviations ... x
Remerciements ... xii
Chapitre 1: Introduction générale ... 1
I. Contexte général ... 1
II. L’approche par traits ... 3
III. Le zooplancton ... 4
i. Rôle du zooplancton dans les cycles biogéochimiques ... 6
ii. Équilibre stœchiométrique et théorie métabolique de l’écologie ... 7
IV. Objectifs d’études ... 9
Chapitre 2: Zooplankton functional traits: Linking organisms to ecosystems ... 15
Abstract... 16 1. Introduction ... 17 2. Methods ... 20 2.1. Database compilation ... 20 2.2. Data treatment ... 22 2.3. Meta-analysis limitations ... 23
4.1.1 Data availability in the literature and knowledge gaps ... 35
4.1.2 Mean trait values ... 36
4.1.3 Allometry ... 38
4.1.4 Ecological implications of relationships among physiological traits ... 41
4.2. Linking individuals to ecosystem processes ... 45
5 Acknowledgments ... 50
Chapitre 3: Conclusions générales ... 61
Bibliographie ... 65
Liste des tableaux
Tableau 1. Number of individual observations (N), number of species and summary of ranges and means of twelve quantitative functional traits in various crustacean zooplankton species included in the present analysis... 51
Tableau 2. Matrix of correlation of selected crustacean zooplankton quantitative traits (all ln-transformed). ... 53
Tableau 3. Major axis regression equations, number of species included (N), Pearson correlation coefficients (r), coefficients of determination (R2), and statistical significance (P) of mass-length allometric relationships for different subsets of species from the database, grouped based on either major habitat and/or taxa. ... 54
Tableau A.I. List of zooplankton species associated to trait values considered as statistical outliers in the present study. ... i
Tableau A.II. List of freshwater and marine zooplankton species included in the present meta-analysis. ... ii
Liste des figures
Figure IA. Voies de consommation, transformation et libération d’azote par le zooplancton (modifié par Steinberg et Saba, 2008, tiré de Møller et al., 2003). ... 12
Figure IB. Effet d’un trait présenté par plusieurs individus de la même espèce (i.e. rapporté à l’échelle de la population) sur les processus d’un écosystème. ... 12
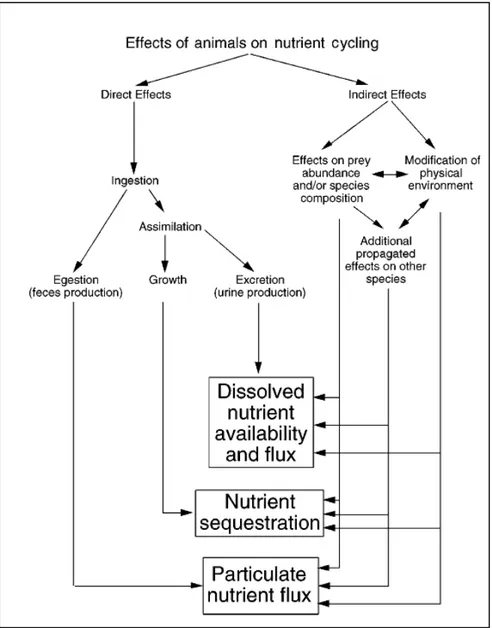
Figure II. Diagramme schématique incorporant les effets directs et indirects qu’ont les animaux sur le cycle des nutriments dans les écosystèmes aquatiques (tiré de Vanni, 2002). ... 13
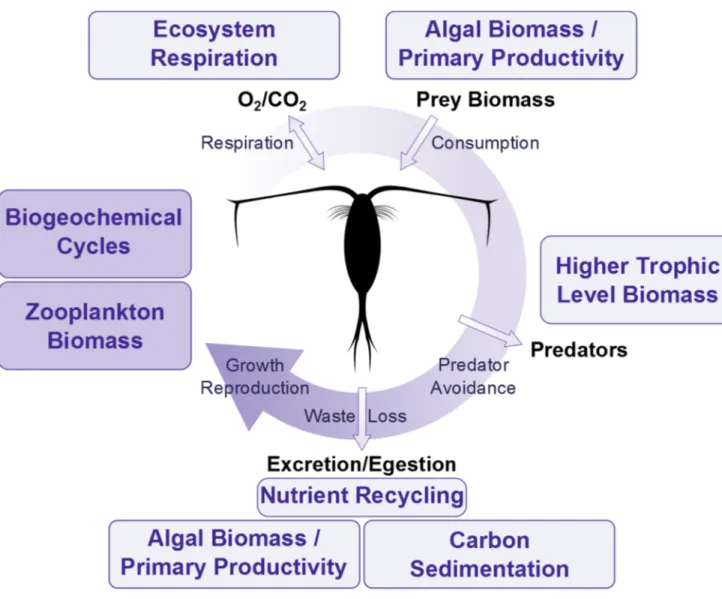
Figure III. Principe du recyclage des nutriments dissous par l’excrétion de zooplancton de différents groupes trophiques : herbivores, omnivores et carnivores. ... 14
Figure 1. Box-plots representing the data variability of N:P body ratio (a) and N:P excretion ratio (b) among zooplankton species groups based on taxa and habitat. ... 55
Figure 2. Regressions by major axis of mass-length allometric relationships ... 56 Figure 3. Regressions (OLS) of excretion and respiration rates as a function of species body mass. ... 57
Figure 5b. Typical interactions of a zooplankter with its environment, in terms of direct chemical output, input or energy transfer. ... 60
Figure A.I. Box-plots representing the distribution of trait values among major zooplankton taxa and habitats. ... vi
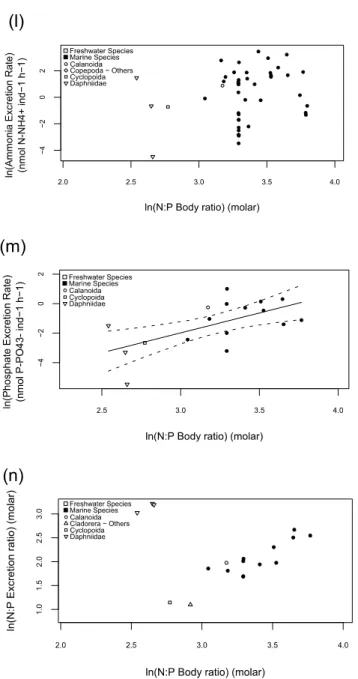
Figure A.II. Bivariate plots and regressions of body composition versus dry weight (a, b, c), N:P body ratio, excretion rates and ratio versus body N content (d, e, f, g), N:P body ratio, excretion rates and ratio versus body P content (h, I, j, k), and excretion rates and ratio versus N:P body ratio (l, m, n). ... viii
Liste des abréviations
C: Carbone / Carbon N: Azote / Nitrogen P: Phosphore / Phosphorus NH4+: Ammonium / Ammonia PO43-: PhosphateO2: Oxygène / Oxygen
CO2: Dioxyde de carbone / Carbon dioxide
PON: Azote organique particulaire / Particulate Organic Nitrogen DON: Azote organique dissous / Dissolved Organic Nitrogen
MTE: Théorie métabolique de l’écologie / Metabolic Theory of Ecology
EST: Théorie stœchiométrique de l’écologie / Ecological Stoichiometry Theory CIEE: Institut d’écologie et d’évolution / Institute of Ecology and Evolution ANCOVA: Analyse de covariance / Analysis of Covariance
OLS: Moindre carré ordinaire / Ordinary Least Squares ln: logarithme naturel / Natural Logarithm
« Success is the ability to go from one failure to another with no loss of enthusiasm. » -Winston Churchill
Remerciements
Je souhaite d’abord remercier mes codirectrices Roxane Maranger et Beatrix Beisner pour m’avoir offert les moyens de faire ma maîtrise et d’avoir cru en mon projet, aussi changeant a-t-il pu être. Merci Beatrix d’avoir toujours répondu rapidement à mes messages; merci Roxane de m’avoir supportée lorsque mon disque dur s’est brisé à 3 jours de mon dépôt.
Bien que ma maîtrise fut enrichissante, nombreux ont été les obstacles lors de mon cheminement : bris multiples et vol d’ordinateur suivis de perte de données, cultures non-viables, déceptions scientifiques, et je m’abstiens du plus difficile. Je suis parvenue à traverser bien des moments pénibles en partie grâce à la présence et à la solidarité de ma deuxième famille : mes compatriotes de laboratoire. Merci à mes petites sœurs de maîtrise, Cynthia Soued et Stéphanie Massé, pour leur écoute pleine d’empathie, leur encouragement continu et leur bonne humeur au quotidien; la relation d’entraide que nous avons développée est inestimable et sera sans aucun doute un de mes meilleurs souvenirs. Merci à Dan Nguyen, mon complice humoristique, pour son soutien et son exemple de persévérance, dans la vie à l’intérieur comme à l’extérieur du laboratoire. Merci à Laure Tall qui a été, sans trop le savoir, mon premier mentor alors que j’en étais à
trucs à la fois élégants et utiles en R et à El-Amine Mimouni pour nos échanges « express » en statistiques dans les couloirs et avec qui j’ai eu la chance d’avoir mes premières discussions passionnées sur le zooplancton au début de ma maîtrise.
Je tiens aussi à remercier tout particulièrement Vincent Fugère pour sa critique constructive lors de nos conversations scientifiques et ses conseils qui ont su éclairer mon jugement, mais plus concrètement pour m’avoir aidée à me réconcilier avec ma console R, prêté son vieil ordinateur lorsque le mien s’est brisé et relu quelques passages de mon manuscrit avec son œil mcgillien entraîné. Merci Vincent de m’avoir autant appris et stimulée en sciences, mais surtout d’avoir cru en moi; tu as été le mentor dont j’avais besoin et il n’y a simplement pas de mot pour t’exprimer ma reconnaissance.
Je me dois également de remercier une seconde fois ma collègue Stéphanie, qui a non seulement été la meilleure colocataire qui soit pendant ma maîtrise, mais qui est devenue une précieuse amie. Que ce soit à notre bureau au pavillon Marie-Victorin, dans le café du coin, à la bibliothèque ou dans nos chambres respectives, travailler avec toi n’aurait pas pu être plus agréable et je me considère choyée de t’avoir eue à mes côtés. Merci chère petite notch d’avoir partagé autant de sphères de ma vie pendant ces années. Finalement, merci à ma famille, spécialement à ma mère, qui a été une source
Chapitre 1 : Introduction générale
I. Contexte général
Un des paradigmes les plus classiques de l’écologie repose sur l’interaction et l’influence mutuelle entre les organismes et leur environnement physique, chimique et biologique (Elton 1927; MacArthur, 1955; 1972). Que ce soit au niveau de l’individu, de la dynamique des populations ou des interactions à l’échelle des communautés, les organismes modulent les fonctions d’un écosystème via leur biomasse, métabolisme et comportement (Jones et Lawton, 1995; Rosenzweig, 1995; Chapin et al., 2000, Vanni, 2002; Enquist et al., 2003; Allen et al., 2005). Les fonctions écosystémiques, tels que le renouvellement, l’emmagasinage et les flux de carbone (C), d’azote (N) et de phosphore (P), ne sont donc pas seulement influencées par la présence et l’abondance d’une communauté, mais également par la structure de celle-ci (Balseiro et al., 1997; Schindler
et al., 1997; Enquist et al., 2009).
Le terme ‘’fonction écosystémique’’ est maintenant largement employé pour faire allusion aux propriétés, processus et services d’un écosystème. Afin d’illustrer clairement
Lecerf et Richardson, 2009). Quant aux services écosystémiques, ils dérivent essentiellement des propriétés et des processus qui, individuellement ou collectivement, représentent une source de bien-être pour les humains (Pacala et Kinzig, 2002). Le fonctionnement des écosystèmes est donc une combinaison de multiples fonctions écosystémiques.
Il n’en demeure pas moins que d’évaluer l’impact des communautés sur le fonctionnement d’un écosystème est un défi majeur et d’actualité en écologie (Grime, 1998; Loreau et al., 2001; Eviner and Chapin, 2003; Hooper et al., 2005). De ce fait, caractériser clairement une communauté représente une étape critique afin de pouvoir adéquatement lier la composition de celle-ci au fonctionnement de l’écosystème. Mis à part l’utilisation de mesures taxonomiques, la diversité d’une communauté peut s’estimer par la variabilité phénotypique, que celle-ci soit basée sur des différences régulées par la génétique ou bien induites par un changement dans l’environnement, conduisant par exemple à de la plasticité phénotypique. Ainsi, les caractéristiques phénotypiques, c’est-à-dire les traits des organismes, peuvent s’avérer être des attributs plus pertinents pour comprendre et prédire les relations espèce-écosystème que les indices taxonomiques, tel que le nombre d’espèces (Tilman et al., 1997; Walker et al., 1999; Norberg et al., 2001;
II. L’approche par traits
Dans sa plus simple définition, un trait représente toute sorte de caractéristiques mesurables à l’échelle d’un individu, que celles-ci soient de nature morphologique, physiologique ou comportementale. Les traits sont souvent associés à la performance d’un organisme en vue d’optimiser son succès (ou fitness) par l’entremise de sa croissance, reproduction et survie (Darwin, 1859; Arnold, 1983; Geber et Griffen 2003; Reich et al., 2003). Ayant été initialement utilisés dans cette perspective évolutive, les traits font maintenant parties d’un cadre théorique intégrateur expliquant comment un changement dans les valeurs de traits sous des conditions environnementales fluctuantes peut influencer une panoplie de processus à plusieurs niveaux organisationnels, des individus aux écosystèmes (Violle et al., 2007). Ce type d’intégration est possible à travers le concept de « traits fonctionnels », soit tous ces traits ayant la capacité de nous informer sur les interactions entre les espèces ou entre celles-ci et leur environnement (Díaz et Cabido, 2001). En effet, ces traits peuvent être utilisés afin de représenter la dynamique d’une population (i.e. traits « démographique »; Saether et Bakke, 2000), d’exprimer la réponse fonctionnelle d’une communauté (traits « réponse »; McGill et al., 2006) ainsi que pour quantifier les apports provenant directement des organismes à l’échelle écosystémique
extrapoler les effets des organismes à l’échelle de l’écosystème (McIntyre et al., 1999; Díaz et Cabido, 2001; Lavorel et Garnier, 2002; Eviner et Chapin, 2003). Quelques études ont d’ailleurs concrètement testé l’effet de certains traits (e.g. ceux de type physiologique (Calow, 1987)) sur des processus biogéochimiques, telle la productivité primaire ou la décomposition (Garnier et al., 2004; Kerkhoff et Enquist, 2006; Vile et al., 2006). Ainsi, le type et la nature d’un trait nous informent sur l’effet que les organismes peuvent avoir sur les fonctions écosystémiques, puis l’abondance relative des espèces qui partagent ces dits traits nous permet de prédire la magnitude que cet effet peut avoir.
Bien que l’approche par traits soit relativement bien implantée en écologie terrestre, elle n’est pas aussi fréquemment employée en écologie aquatique (Giller et al., 2004). De plus, les études ayant eu recours aux traits fonctionnels ont eu tendance à utiliser des traits plus facilement mesurables, ou plus communément accessibles dans la littérature, au lieu de se concentrer sur les traits étant plus directement liés aux fonctions écosystémiques qui leur étaient d’intérêt (Petchey et Gaston, 2006).
III. Le zooplancton
Dans les environnements aquatiques, le zooplancton est présent en forte biomasse et occupe une position pivot au centre des réseaux trophiques. Ces organismes sont donc
n’explorent pas les relations entre les traits de façon quantitative et ont tendance à omettre certains traits physiologiques connus pour influencer d’importantes fonctions écosystémiques, notamment le recyclage des nutriments. En effet, les traits considérés par ces études sont essentiellement liés à la performance de l’individu et aux interactions interindividuelles, laissant ainsi de côté des processus physiologiques d’intérêt majeur dans la régulation des flux d’éléments de l’environnement. Par exemple, les traits quantifiant la respiration, l’excrétion, le contenu des pelotes fécales ou qualifiant la capacité d’effectuer du sloppy feeding fournissent énormément d’informations sur le rôle du zooplancton au sein des cycles biogéochimiques, notamment celui de l’azote (Fig. IA) (Sirotnak et Huntly, 2000; Steinberg et Saba, 2008). La nature de la contribution du zooplancton à ces cycles varie donc selon l’effet qu’ont les traits dans le système et la magnitude de cet effet dépend de la taille de la population qui présente ces traits (Fig. IB). L’incorporation de traits physiologiques dans les classifications fonctionnelles est donc d’intérêt si l’objectif est de lier la composition des communautés aux fonctions de l’écosystème, particulièrement celles liées aux cycles de N, P et C.
Par le passé, diverses études se sont intéressées au métabolisme du zooplancton comme étant une fonction de la taille et/ou de la composition chimique de leur corps, sous
évaluées pour différents taxa, de différents habitats aquatiques, ces études restent à petite échelle et ne comparent pas les relations entre les traits à travers les écosystèmes.
i. Rôle du zooplancton dans les cycles biogéochimiques
Au cours des trois dernières décennies, l’importance du zooplancton dans les cycles biogéochimiques a considérablement été revendiquée, tant en milieu marin qu’en eaux douces (Elser et al., 1988; Sirotnak et Huntly, 2000; Vanni, 2002; Alcaraz et al., 2010). Leur rôle dans la biodisponibilité des nutriments et la régénération d’énergie s’effectue par plusieurs voies, que ce soit directement ou indirectement (Fig. II). Les effets directs proviennent essentiellement des transformations physiologiques entre le moment où les éléments sont consommés et celui où ils sont relâchés dans le milieu. Les éléments ingérés sont en partie assimilés par l’organisme, ce qui n’est pas assimilé sera relâché sous forme de pelotes fécales, puis ce qui est assimilé sera en partie utilisé pour l’approvisionnement ainsi que la croissance des tissus et l’excédent et les déchets métaboliques seront libérés via l’excrétion (Fig. II; Vanni, 2002). Les consommateurs zooplanctoniques influencent également le lot de nutriments indirectement en contrôlant la biomasse et la structure de communauté de leurs proies, modulant ainsi l’effet des maillons inférieurs sur les flux d’éléments (Sirotnak et Huntly, 2000; Vanni, 2002) (Fig. II).
(Lehman, 1980; Bidigare, 1983; Regnault, 1987), représente une source importante de nutriments biodisponibles pouvant fournir respectivement entre 19-130 % et 37-200% de la quantité de N et P nécessaire à la production primaire d’un système (Verity, 1985; Johnson et al., 2010). Alors que l’excrétion est potentiellement la voie influençant le plus le lot de nutriments dissous, la respiration apparaît comme étant l’activité métabolique de base pouvant contribuer le plus au cycle du carbone en émettant du CO2, considérant que ces deux processus physiologiques sont exercés par toutes les espèces de zooplancton (Mayzaud, 1973; Ikeda et al., 2001; Frangoulis et al., 2005; Alcaraz et al., 2010). La vitesse et la stœchiométrie auxquelles les espèces respirent et excrètent les éléments représentent donc des caractéristiques importantes afin de mesurer l’impact du zooplancton sur les flux de N, P et C dans leur écosystème.
ii. Équilibre stoechiométrique et théorie métabolique en écologie
De façon générale, le taux et la stœchiométrie d’une réaction métabolique représentent un centre d’intérêt très populaire en écologie, en partie grâce à la théorie métabolique (Metabolic Theory of Ecology; MTE) (Brown et al., 2004) et la théorie stoechiométrique (Ecological Stoichiometry Theory; EST) (Sterner et Elser, 2002). Le zooplancton a entre autres déjà été utilisé comme système d’étude pour tester et appliquer
al., 2001; Brown et al., 2004; West et Brown, 2005). L’explication amenée par la MTE a su
rationaliser ce concept d’invariance énergétique en prenant également en compte la température du milieu (West et al., 1997; Brown et al., 2004). Explorer les relations entre les taux de respiration et d’excrétion en fonction de la masse des espèces de zooplancton, à température constante, permet ainsi de comparer la cinétique de ces processus physiologiques le long d’un gradient de taille et, par le fait même, d’évaluer l’effet indirect de la taille des organismes sur les flux de C, N et P dans le système. Ce type de modèle est particulièrement pertinent en vue d’évaluer les implications écologiques de la physiologie des organismes selon la structure de taille d’une communauté.
Par ailleurs, la stœchiométrie des produits excrétés par un organisme varie selon un principe de balance de masse. Le ratio élémentaire de l’excréta dépend essentiellement du déséquilibre entre le ratio du corps de l’organisme (i.e. ses besoins corporels) et le ratio de la nourriture ingérée. À valeur nutritive constante, EST prédit donc que plus les espèces présentent un ratio N:P élevé dans leur corps, plus celles-ci auront tendance à excréter des nutriments à un ratio N:P faible et vice versa (Sterner, 1990; Hessen et Andersen, 1992; Sterner et al., 1992; Sterner et Elser, 2002). La composition élémentaire corporelle peut entre autres dépendre du contenu biochimique, c’est-à-dire de la nature et de la proportion
corporel N:P très bas, en raison de leurs besoins importants en P, comparativement aux autres cladocères, qui eux-mêmes sont connus pour présenter un ratio plus faible que celui généralement mesuré chez les copépodes (Andersen et Hessen, 1991; Elser et Urabe, 1999). Par conséquent, il est attendu que le ratio N:P de l’excréta des cladocères soit plus élevé (particulièrement celui des daphniidés) que celui des copépodes. Le ratio élémentaire N:P de l’excrétion est particulièrement d’intérêt lorsqu’il est comparé à celui du milieu, à savoir si celui-ci indique une limitation générale en N ou en P (i.e. supérieur ou inférieur à 16:1, Redfield, 1958). Ainsi, la variation du ratio N:P du contenu corporel et de l’excréta des espèces peut présenter d’importantes implications pour les processus écosystémiques, notamment la production primaire du système à travers différents habitats. Ces dits traits peuvent donc servir d’indicateurs, ou de prédicteurs, afin d’estimer la contribution du zooplancton au fonctionnement de l’écosystème.
IV. Objectifs d’étude
L’objectif global de cette étude est d’améliorer notre compréhension mécanistique de la structure des communautés zooplanctoniques et de fournir des outils permettant de mieux lier ces communautés au fonctionnement de leur écosystème. Nous focaliserons notre attention sur l’intérêt de l’approche par traits dans la caractérisation des
taille corporelle (masse et longueur), composition chimique des espèces (C, N, P, ratio N :P, proportion lipidique et protéique), taux de respiration et d’excrétion de N et de P, de même que le ratio N:P de l’excréta.
L’objectif premier est d’explorer la base de données que nous avons nous-mêmes construite et d’examiner la distribution des valeurs de traits compilés entre les taxa et les habitats. Par le fait même, nous ferons également le point sur les traits pour lesquels il semble y avoir moins d’information disponible dans la littérature, que ce soit en milieu marin ou dulcicole. Nous décrirons ensuite les relations entre les traits par approche corrélationnelle et tenterons de déterminer la présence de patrons entre les unités taxonomiques du zooplancton crustacé (i.e. calanoïdes, cyclopoïdes, daphniidés et les autres cladocères), de même qu’entre les habitats principaux des espèces (environnement marin ou dulcicole). Nos hypothèses générales sont les suivantes :
1. les relations linéaires entre (a) la taille et la masse, (b) la masse et les taux métaboliques et (c) entre les taux d’excrétion de N et P seront les plus fortement corrélées;
2. les coefficients allométriques entre la masse et la longueur du corps seront de ±3 et varieront selon la différence entre les formes corporelles typiques des deux grands groupes de zooplancton : copépodes (calanoïdes, cyclopoïdes) versus cladocères (daphniidés et autres);
3. les coefficients de régression des taux métaboliques (respiration et excrétion) en fonction de la masse des organismes sera de ±¾ (ou de -¼
Pour ce faire, nous caractériserons quantitativement les relations allométriques, entre les taux métaboliques et la masse corporelle, puis entre les taux métaboliques eux-mêmes afin de comparer les coefficients obtenus entre les groupes et habitats, puis à ceux rapportés dans la littérature. Les équations générales obtenues pourront ultimement être utilisées afin d’estimer la valeur de traits plus difficilement mesurables à partir de mesures plus facilement accessibles. L’usage de ces équations faciliterait entre autres l’incorporation de traits physiologiques dans la caractérisation de communauté reposant sur un assemblage ou une combinaison de traits.
L’objectif final de cette étude est d’établir un cadre de travail conceptuel afin de classifier les traits du zooplancton en vue de pouvoir mieux les lier aux processus écosystémiques qu’ils affectent. Notre catégorisation se base sur le budget énergétique des organismes, intégrant ainsi les traits physiologiques souvent omis dans les études, de même que sur les fonctions écosystémiques connues pour être influencées. Nous espérons que notre contribution assistera les écologistes dans le choix des traits utilisés pour décrire les communautés de zooplancton et stimulera l’intégration entre les champs de l’écologie des communautés et de la biogéochimie.
Figure I. A. Voies de consommation, transformation et libération d’azote par le zooplancton (PON : azote organique particulaire; DON : azote organique dissous) (modifié par Steinberg et Saba, 2008, originalement de Møller et al., 2003). Tous ces processus au niveau de l’individu peuvent être quantifiés et rapportés en traits. B. Effet d’un trait présenté par plusieurs individus de la même espèce (i.e. rapporté à l’échelle de la population) sur les processus d’un écosystème. La nature de l’effet dépend du trait, la magnitude de l’effet dépend de la taille de la population qui partage le trait.
Figure II. Diagramme schématique incorporant les effets directs et indirects qu’ont les animaux sur le cycle des nutriments dans les écosystèmes aquatiques (tiré de Vanni, 2002).
Figure III. Principe du recyclage des nutriments dissous par l’excrétion de zooplancton de différents groupes trophiques : herbivores, omnivores et carnivores. Les voies illustrées comprennent un aperçu des maillons classiques impliqués dans les microchaînes trophiques ayant comme maillon supérieur le zooplancton herbivore ou carnivore. L’énergie et les éléments remis en circulation via l’excrétion regagnent la chaîne alimentaire et traversent un nombre de maillon variable selon la position / groupe trophique du zooplancton.
Chapitre 2: Zooplankton functional traits: Linking
organisms to ecosystems
Auteures : Marie-Pier Hébert, Beatrix Beisner et Roxane Maranger
Abstract
The use of traits to characterize communities is proposed to be a more effective way to link community structure to ecosystem function. Organism morphology, corporal stoichiometry and physiology can be more readily linked to large-scale processes through functional traits, by providing information on interspecific and species-environment interactions. Given their key trophic position in aquatic ecosystems, zooplankton affect energy fluxes and element processing, making these organisms a good model for individual-ecosystem functioning linkages. Here, we compiled a large database of zooplankton species and their traits contributing directly or indirectly to C, N or P ecosystem fluxes. We identified gaps in the literature, explored cross-correlations among 16 traits, and examined the effects of taxonomy and main habitat (marine vs. freshwater) on these relationships. Specifically, we quantitatively described mass-length relationships, the scaling of respiration rates and N and P excretion rates with body mass, as well as the stoichiometry among these metabolic rates. Respiration and excretion rates followed mass-dependent scaling relationships in both major habitats, in line with the metabolic theory of ecology, although exponents were generally higher than predicted, ranging from 0.70 to 0.90. The strongest and most surprising effect that we found was the influence of
propose a new trait classification framework for zooplankton with the aim to promote a more complete integration of community ecology and aquatic biogeochemistry through the use of traits.
1. Introduction
One of the most classic paradigms in ecology is that organisms are fundamentally integrated in, affected by and affecting their physicochemical and biological environment (Elton, 1927; MacArthur, 1955; 1972). The activity of individual organisms, including their population dynamics and community interactions are known to influence ecosystem properties in both space and time via their behaviour, biomass changes and metabolism (Jones and Lawton, 1995; Rosenzweig, 1995; Chapin et al., 2000; Vanni, 2002; Pacala and Kinzig, 2002; Enquist et al., 2003; Allen et al., 2005). Clearly characterizing how changes in community composition mechanistically alter ecosystem functions however remains a major challenge (Grime, 1998; Loreau et al., 2001; Hooper et al., 2005). One way to more fully assess how biological communities influence ecosystems is to classify the broader ecological roles of species within communities using a trait-based approach (Chapin et al., 1996; Lavorel and Garnier, 2002; Eviner and Chapin, 2003; Eviner, 2004). Functional traits
(Tilman et al., 1997; Bengtsson, 1997; Walker et al., 1999; Norberg et al., 2001; Hooper et
al., 2005).
Although the effect of an individual trait in a single organism is likely to be negligible for ecosystem processing, this may no longer be the case when the trait effect is scaled to the population- or community-level. Ecosystem processes, such as energy and elemental fluxes, storage and turnover, are not only influenced by the overall biomass of a community but likely also by its structure (Vanni, 1988; Balseiro et al., 1997; Schindler et
al., 1997; White et al., 2007; Enquist et al., 2009). Although the use of traits may best link
organismal effects to their ecosystems, this approach is either rarely implemented (Hillebrand and Matthiessen, 2009), or when proposed, linkages are not always quantified. Furthermore, most trait-based studies tend to use traits that are more easily measurable or more commonly available, rather than focusing on traits that are best related to the ecosystem function of interest (Petchey and Gaston, 2006). To some extent this discrepancy depends on whether the utilization of traits is to reflect ecosystem process effects on communities, in which case “response traits” are measured (e.g. Woodward and Diament, 1991; Keddy, 1992; Lavorel et al., 1997; Barnett and Beisner 2007; Beisner and Longhi 2013). Our approach however focuses on the less commonly
Although several functional descriptions and trait classification schemes have recently gained popularity in zooplankton ecology (Barnett et al., 2007; Merico et al., 2009; Kiørboe, 2011; Litchman et al., 2013; Barton et al., 2013), most of these remain qualitative or conceptual and few have applied this approach to concretely link zooplankton community structure to ecosystem functions. We conducted a meta-analysis on crustacean zooplankton species traits contributing directly or indirectly to C, N and P fluxes in aquatic ecosystems using a large amount of trait information available in the literature. Our study includes data on traits related to body size, elemental and biochemical body composition, respiration and excretion rates and stoichiometric ratios. Although relationships for zooplankton metabolism or nutrient recycling as a function of body mass or elemental composition of organisms are known (Peters, 1983; Ikeda, 1985; Sterner, 1990; Sterner and Elser, 2002; Ikeda et al., 2001; Sereda and Hudson, 2011; Kiørboe and Hirst, 2014), few studies have examined the relationships amongst those traits from a functional diversity perspective, as well as their correlation structure.
Here, we synthesize and review a large number of observations on zooplankton traits likely to influence ecosystem processes and identify gaps in the literature to help direct future research efforts. We then explore the relationships between all traits and
ecologists to derive or develop more appropriate functional species groupings that may more readily link communities to various ecosystem processes of interest. Overall, this synthetic analysis provides new insights into the functional structure of zooplankton communities and increases our mechanistic understanding of the influence of zooplankton on aquatic ecosystems.
2. Methods
2.1 Database compilation
Web of Science and Google Scholar databases were searched in 2012 (January through November) to find articles on zooplankton nitrogen and phosphorous content and excretion rates. Two separate searches were conducted including the following keywords: (i) zooplankton* AND (nitrogen* OR ammonia* OR phosphorus* OR phosphate*) AND excretion*, (ii) zooplankton* AND (elemental* OR nitrogen* OR phosphorus* OR lipid* OR protein*) AND body* AND composition*. Both databases were revisited in 2013 (November to December) for information on zooplankton carbon content and respiration rates, using two combinations of search terms: (i) zooplankton* AND respiration*, (ii) zooplankton* AND (elemental* OR carbon*) AND body* AND composition*. We then
estimate individual-level excretion and respiration rates (or, inversely, estimate mass-specific rates), and body composition as % elemental proportions of unit dry mass. Note that most studies refer to body mass as body weight (mg); although this term has been pervasively used in literature, the term body mass will be used in this study. It should also be noted that the term zooplankton used throughout this text refers to the crustacean meso- and macrozooplankton taxa targeted in the present study.
For studies on zooplankton respiration, rate estimates based on ETS (electron transport system) activity were excluded in order to minimize variance across species for this trait caused by methodological differences. Although ETS is now considered as a good predictor of zooplankton respiration rates (Bode et al., 2013), a larger number of literature estimates are still available for more traditional approaches like measurements of oxygen metabolism. We included studies from a wide range of marine and freshwater environments, although most of the articles that we retained were from temperate regions. Ambient or experimental temperatures in each study of zooplankton metabolism (i.e. for respiration and excretion rates) were recorded in order to apply a standardized temperature correction. Data were often extracted directly from figures in articles or reference books using the software Datathief III, (version 1.6, Bas Tummers ©). Note that
were enhanced by the inclusion of data from several North American datasets including the North Temperate Lakes Long Term Ecological Research (NTL-LTER) site in Wisconsin, U.S.A. and data from the Experimental Lakes Area (ELA), part of the Canadian Department of Fisheries and Oceans (DFO) until 2012. Dry mass estimates were based on taxon-specific length-mass allometric equations (McCauley 1984, Culver et al. 1985).
We are aware that more information on species body size is available in the literature, especially for marine species. However it should be noted that the focus of the study was initially on zooplankton excretion, with respect to the stoichiometry of body composition, but the interest of study evolved to consider a broader suite of available traits, including respiration, in order to make direct links to ecosystem function.
2.2 Data treatment
Species were first classified according to their main habitat type, i.e. freshwater or marine. The few brackish water species included in the dataset were grouped with marine species. To avoid pseudo-replication in further statistical analyses, all trait information on juvenile stages and male individuals were removed and only data on adult females (i.e. C6F for copepods) were considered for trait relationships.
where k1 and k2 are the respiration rates corresponding to temperatures t1 and t2. We used Q10 approximations adapted for respiration, and N and P excretion in zooplankton. According to Ivlena (1980) and Ikeda et al. (2001), the Q10 for marine copepod respiration rates ranges from 1.8 to 2.1. Considering that no comparable compilation of respiration data exists for freshwater species, we followed Hernández-León and Ikeda (2005) suggestion and applied the relationship developed for marine zooplankton to freshwater taxa. Likewise, we used mean Q10 estimates for ammonia and phosphate excretion derived from marine species, which are 2.0 and 1.55, respectively (Bidigare, 1983, Ikeda, 1985, Ikeda et al. 2001, Regnault, 1986).
2.3 Meta-analysis limitations
Given some of the large information gaps and data heterogeneity in the literature, several limitations in the data available restricted the scope of the analysis and sometimes prevented us from using formal meta-analytical methods (Gurevitch and Hedges, 1999; Koricheva et al., 2013). Regardless of the limited number of observations for our empirical review, there was a lack of stoichiometric information on food supply that would have permitted us to include its effect on zooplankton excretion in our analyses. Instead, most
Second, the number of observations (ranging from 1 to 72 individuals in our case) used to estimate a trait value for a given species differed. Furthermore, it was impossible to weight the estimates by the number of observations when variance was not reported, as recommended by Koricheva et al. (2013). Although these sources of variation sometimes limited our possibilities in terms of data analyses, we still explored all relationships among traits by giving equal weight to all trait values. However, a strength in our study is that we only considered raw data to develop relationships which is more rigorous than using data inferred from a statistical test (Valentine et al., 2010).
2.4 Statistical analyses
All analyses were conducted in R, version 2.14 (R development Core Team, 2011). Given that the number of measured individuals per trait varied among species, as did the number of traits per individual, we averaged all observed values for each trait per species, and used these means as observations in regressions. Dotcharts were used to visualize data and identify potential outliers; Dixon’s Q test was used to decide whether or not these points were to be excluded (Dean and Dixon, 1951, Rorabacher, 1991). We only performed this test once for each variable and used 95% confidence intervals in order to apply
larger than all other freshwater species reaching a body length as high as 15.8 mm. It should be noted that including or rejecting outliers led to the same patterns and statistically-significant results, although the p values of the relationships changed slightly. Box-plots were used to compare trait values distribution among taxa and habitats. When a comparison was particularly of interest (e.g. for N:P ratios in body composition and excretion), we used traditional t-tests to determine if a taxonomic group was a significantly different from other taxa. All data were then ln-transformed prior to conducting further analyses to best approximate normality.
In order to explore relationships among species traits, we computed a correlation matrix of Pearson’s correlation coefficients. Relationships between pairwise trait combinations were investigated in further analyses in order to detect differences among taxa and habitats. For several significant relationships, we tentatively developed predictive equations based on easily-measured traits. To evaluate how dry mass varies with body length, we used analysis of covariance (ANCOVA) to include “taxon” or “main habitat” as covariates, to uncover potential differences in length-mass relationships across taxonomic groups or habitats. We then calculated separate allometric equations using either all species in the database or only a subset of species from a given habitat
mass-length relationship among all species, taxa or main habitats, we computed model II simple linear regressions by major axis, using the library “lmodel2” (Legendre, 2013). Model II regressions were used because we could assume that the error variance of both variables was relatively similar and because we aimed to compare the slopes of the relationships between the same two variables measured under different conditions (Jolicoeur, 1990). The major axis method seemed like the most appropriate to estimate parameters of an equation that describes the functional relationship between two morphological attributes, namely body mass and length, because we cannot state which of the two traits is the dependent or independent variable considering that their influence is bidirectional (Legendre and Legendre, 2012).
To quantify relationships between respiration and excretion rates (in terms of N and P) versus body mass, we used simple linear regressions by ordinary least squares (OLS). The OLS method was sufficient in this case because we could reasonably assume that the error variance of the measured physiological rates was significantly higher than the one associated with body mass measurements and because it is well-known that mass influences metabolic rates, rendering obvious the determination of the dependent and independent variables. We regressed respiration and excretion rates against body dry
3. Results
3.1 Overview of meta-analysis
Our literature search yielded 8871 and 508 observations for marine and freshwater crustacean zooplankton traits respectively, corresponding to 134 marine and 153 freshwater species (outliers removed). Studies on marine zooplankton often reported information on the same commonly-studied species, whereas studies on freshwater zooplankton frequently described whole community assemblages with trait value averages reported for every species. This explains the discrepancy between the number of observations of a given trait versus the total number of species between habitats. Most studies reporting on crustacean zooplankton provided information on body size, making length and dry weight the most commonly available species traits from both habitats (Table 1). Marine species were significantly larger on average than freshwater ones. Indeed, the mean body length (BL) and dry mass (DM) were 2 and 7 times higher on average respectively, with a broader range of values in zooplankton from marine systems versus freshwaters.
Species-level values of elemental body composition (N, P and C content), biochemical composition (lipid and protein content) and physiological traits (respiration
had significantly more P in their body composition, and thus lower N:P body ratios as compared to other cladocerans and copepods (Fig. 1a). Ratios were similar among freshwater and marine cladocerans and calanoids, but they diverged strikingly in cyclopoid species (Fig. 1a). However, the latter observation is based on one observation per habitat only and would need to be confirmed. The N:P ratios of excreted products were highly variable in both marine and freshwater species, varying by an order of magnitude (Table 1). Although the mean and range for this stoichiometric ratio was similar between marine and freshwater species, we did observed a difference among taxonomic groups (Fig. 1b). Daphniids had significantly higher N:P ratios in their excreted products than other cladocerans and copepods, (Fig. 1b), consistent with their body requirements (Fig 1a).
Biochemical composition data were mostly reported as either total mass of proteins, total mass of lipids or by type (i.e. lipid classes or amino acid composition), however we were only interested in the total body proportion (%). Of the limited number of freshwater studies found, most reported differences among stages (especially during diapause stage (C5) for copepods), and between sexes within a given species. Fewer than five species from freshwaters were compiled in our literature survey (i.e. 3 cladoceran and
However, we did find overall higher values of total lipid content in marine organisms (Table 1).
For physiological traits, ranges for individual respiration and N and P excretion rates varied over two to three orders of magnitude in marine zooplankton whereas for freshwater species, rates ranged from only one to two orders of magnitude (Table 1). Individual mean respiration and N and P excretion rates were on average approximately 3, 6 and 9 times higher in marine versus freshwater species. However, when expressed per unit dry body mass, freshwater species were approximately 3, 2.5 and 5.5 times higher for respiration, N and P excretion (Table 1).
3.2 Data analyses
In order to evaluate how traits covaried, we explored the correlation coefficients among all trait combinations (Table 2). The number of observations for each pairwise comparison differed greatly among relationships and is indicated in the upper panel of the correlation matrix. Certain traits, such as BL, DM and those related to physiological processes resulted in a large number of significant correlations. Relationships between these traits were explored further in subsequent analyses in order to characterize
zooplankton species across habitats (corresponding to 98 copepods and 85 cladocerans in this study), with a R2 of 0.8 (Table 3, Fig 2a). Although both habitats span a broad range in values, it is clear from the distribution of the data that marine species dominate in the upper quadrant. In order to determine, how DM varies with BL between major habitats and among taxa, we used an ANCOVA approach. All effects in both ANCOVA models were statistically-significant (p < 0.0001) (Figs 2b and c). Given that differences among taxa and between habitats appeared to influence both the slope and the intercept of the overall allometric relationship, separate length-mass linear regression equations for all possible combinations were performed (Table 3).
When the dataset was divided according to taxa but pooled across habitats, significant differences in the BL-DM relationships were observed among taxonomic groups (Fig. 2b), again with very high R2 values ranging from 0.70 to 0.82 (Table 3). Calanoids gained more mass across a similar increase in body length than did all other taxa, with an allometric coefficient (i.e. scaling exponent, which corresponds to the slope of the ln-transformed equation) of 3.469 (Table 3). This scaling exponent was almost twice as large as the one observed for non-daphniid cladocerans at 1.907 (Table 3). The allometric coefficient for daphniids was 2.735, which was significantly higher than the one
mass as they increase in length (Table 3). Again relationships were very strong and highly significant explaining a high proportion of the variance in both habitats. Given the differences and strong relationships we observed among taxa and between habitats, ANCOVAs were performed to explore patterns within taxa between marine and freshwater habitats. The general pattern that emerged in the relationship between habitats (Fig. 2c), wherein freshwater species had lighter mass compared to marine species for a given body length, was also observed when different taxa were considered independently (Table 3). Most obvious was the pattern between calanoids from different habitats, where the intercept of the relationship for marine species was almost four times higher than the one observed for freshwater species, whereas the allometric coefficients were relatively similar between the two equations (Table 3). The same pattern emerged with cyclopoids, although the number of observations for marine systems that fulfilled our selection criteria was rather limited (Table 3). Comparisons for cladorecans were not possible with this dataset as marine representatives were too rare. Interestingly the patterns observed within taxa suggest that lighter zooplankton relative to their length in freshwaters may not simply be a function of cladoceran species being more abundant in freshwaters, or a matter of shape variation across taxa, but that the differential allometry
variable for many other traits, particularly physiological rate variables (Fig. 3). In accordance with allometric theory, individual N and P excretion rates were all significantly (p < 0.0001) and positively related to species DM (Figs 3a and b), explaining 73% (n=71) and 72% (n=47) of the variance respectively using the following models:
ln(N-NH4+ excretion rate) = 0.84 ln(DM) + 2.50 (Eq. 3.1) ln(P-PO43- excretion rate) = 0.70 ln(DM) + 0.56 (Eq. 3.2) where rates are expressed in nmol (N or P) ind-1 h-1 and DM in mg.
An ANCOVA did not reveal any significant difference in these relationships between habitats. Although observations from both environments fell clearly along the regression line, marine observations were however more clustered at the higher end of the graph (Figs 3a and b), again highlighting the greater overall individual excretion rates of both N and P from the typically larger marine zooplankton (Figs 3a and b). No significant difference was observed among taxonomic groups either. This however may have been due to a limited number of observations for most species groups with the exception of marine calanoids. Copepods tended to excrete more P than cladocerans (represented primarily by daphniids) in freshwaters, for the same body mass (Fig. 3b). This pattern supports as the stoichiometric needs of daphniids compared to copepods (Figs 1a and b).
ln(respiration rate)FR = 0.82 ln(DM) + 1.24 (Eq. 3.3)
ln(respiration rate)MA = 0.90 ln(DM) + 0.21 (Eq. 3.4)
where respiration rate is expressed in µL O2 ind-1 h-1 and DM in mg. DM explained considerably more variance in individual respiration rates in freshwater zooplankton than in marine species at 94% (n = 17, p < 0.0001) and 54% (n = 42, p < 0.0001) respectively.
Physiological rates measurements were in all cases significantly and negatively related to body mass when expressed per unit DM, with the exception of mass-specific respiration in marine zooplankton where the relationship was not significant (Fig. 3f). These relationships were comparatively weaker with only 12% of variance explained for N and 41% for P specific excretion rates. However these trends did support that smaller organisms, mostly freshwater species, tended to have a more rapid mass-specific metabolism, regardless of their taxonomic group (Figs 3d-f). As for mass-specific respiration, DM explained 41% of the variance in freshwater respiration rates, whereas the relationship for marine respiration rates was not significant.
All significant trait relationships in the correlation matrix (see Table 2 for r values) yielded significant regression results (p < 0.05). However, in the case of the relationships referring to elemental and biochemical composition of zooplankton, those that predicted
content, and P excretion rates versus P content and N:P body ratio (Table 2). However, these relationships were weaker (see Fig. A.II for more details).
Physiological traits were for the most part strongly correlated (Table 2). Model II simple regressions were used to quantitatively characterize the significant relationships between metabolic rates. Individual P and N excretion rates were highly related (R2 = 0.84, n = 42, p < 0.001) (Fig. 4a), according to the following equation:
ln(P-PO43- excretion rate) = 0.95 ln(N-NH4+ excretion rate) - 1.97 (Eq. 3.5) where excretion rates are expressed in nmol (N or P) ind-1 h-1. No significant differences between habitats or taxa were observed in this relationship. Interestingly, the stoichiometry of this relationship indicates an average molar N:P ratio of approximately 8 in zooplankton excretion, thus suggesting a recycled input generally limited in N. However, most species included in this relationship are marine copepods (76%) potentially resulting in a bias given the stoichiometry of their body requirements (Fig. 4a; Table 1).
Interestingly, a model II regression showed that N excretion rates were strongly and positively related to respiration rates (R2 = 0.74, n=37, p < 0.001) (Fig. 4b):
4. Discussion
Zooplankton play a pivotal role in aquatic ecosystems and although there has been a considerable amount of effort in promoting a trait-based approach for their characterization (Barnett et al., 2007; Litchman et al., 2013; Barton et al., 2013), these studies typically remain mainly qualitative and descriptive. The novel aspect of our work was to put different traits into a quantitative context and characterize the relationships among several trait combinations, between habitats and among taxonomic groups. Although some of the relationships are known from previous studies (Peters, 1983; Ikeda, 1985; Sterner, 1990; Ikeda et al., 2001; Sereda and Hudson, 2011; Kiørboe and Hirst, 2014), their applicability from a trait perspective has yet to be evaluated, as does the correlation structure among multiple traits. The results of our meta-analysis revealed fundamental differences among freshwater and marine zooplankton, even within a taxonomic unit, and provide mass-scaled exponents of metabolic rates. We believe that physiological traits may be the most useful ones to extrapolate the effect of organisms to an ecosystem context (Calow, 1987; Díaz and Cabido, 2001; Lavorel and Garnier, 2002; Alcaraz et al., 2010). Finally, we propose a modified and more complete framework of zooplankton traits together with the ecosystem functions these traits are likely to influence.
made by other large-scale studies on zooplankton metabolism (Wen and Peters, 1994; Hernández-León and Ikeda, 2005). Comparatively to studies on marine zooplankton, freshwater species appeared to be relatively less characterized in terms of elemental and biochemical body composition as well as metabolic rates (Table 1). This bias likely reflects a difference in research interests between limnologists and oceanographers where freshwater scientists likely focus more on community and population dynamics than marine scientists who are often concerned with zooplankton physiology. Irrespective of habitat type, there were also some traits for which information was generally scarcer, such as total biochemical body composition (Table 1). The aforementioned general knowledge gaps limit the scope of empirical model development, such as ours, that attempt to compare taxa and ecosystem types. Nevertheless, we were able to derive mean values of all traits among taxa and between habitats and robustly quantify several relationships.
4.1.2 Mean trait values
Many differences in mean traits were observed between marine and freshwater zooplankton and among taxonomic groups (Table 1, Figs 1 and A.I). Between habitats, marine zooplankton tended to have larger body size and expressed higher individual rates
freshwater and marine species metabolism clearly has implications for zooplankton-ecosystem processes linkages.
N:P ratios have been an important focus of ecological stoichiometric theory (EST) in zooplankton (Sterner and Elser, 2002). In our analysis, mean values of N:P body ratios were almost two-fold higher in marine species. This difference is consistent with the fact that cladocerans (especially daphniids) are known to have lower N:P body ratios than do copepods and the fact that cladocerans are considerably more abundant in freshwaters while copepods dominate in oceans (Andersen and Hessen, 1991; Elser and Hassett, 1994; Elser and Urabe, 1999). Furthermore, averaged trait values per taxon and habitat showed that species groups with higher N: P body ratios had lower N: P excretion ratios (Figs 1a and b), consistently with EST (Sterner, 1990; Hessen and Andersen, 1992; Sterner et al., 1992). Our analyses revealed N: P ratios generally below Redfield’s ratio (Redfield, 1958) in zooplankton excretion in all species groups, with the exception of daphniids (Fig. 1b).
Although this well-established stoichiometric concept could easily be seen in our dataset using box-plots, results were less apparent in broader cross comparisons using a regression approach. Indeed, certain relationships between elemental body composition and excretion rates and stoichiometric ratios were not significant, in contrast to those
regression analysis because the effect of zooplankton body composition on excretion ratios could have been masked by site variability in food N:P ratio. Indeed, Elser and Urabe (1999) suggested that the N: P ratio of food may be more important in predicting excretion ratios than is zooplankton N: P body requirements. Alternatively, we might have not detected a relationship between body composition and excretion ratios because our species did not exhibit sufficient variance in P content. Indeed, organisms without bones such as zooplankton have lower corporal P variation, making their N:P body ratio less variable than vertebrates (Vanni, 2002; Vanni et al., 2002).
4.1.3 Allometry
The description of mass-length relationships across many species provides useful insights for broader patterns in allometric relationships than do those determined at the species-level (e.g. Cohen and Lough, 1981; McCauley, 1984; Culver et al., 1985; Ara, 2001). The scaling exponent of the overall mass-length relationship for crustacean zooplankton in our dataset was approximately 3 (2.8), corresponding to reported values in freshwater and marine large- and small-scale studies (McCauley, 1984; Omori and Ikeda, 1984). The observed differences in scaling exponents and intercepts of the linearized mass-length
cladocerans had the lowest slope and highest intercept, indicating a higher body mass to equivalent length which might arise from their generally smaller and rounder body shape in other groups. Substantially higher intercept values were also found for some species-level relationships, such as congeners of Holopedium, Bosmina or Chydorus (McCauley, 1984).
In addition to the variation among species, zooplankton mass-length relationships are also known to vary seasonally, according to geographic location, due to fluctuations in temperature and food availability, and thus the physiological state of the animals (Ikeda 1974; Durbin & Durbin 1978; Viitasalo et al. 1995). Despite this great site-to-site variability, we surprisingly found a strong emergent difference in mass-length relationships between major habitats: marine species not only had a heavier body mass over freshwater species of equivalent lengths, but also had a greater increase in body mass for an increase in body length. These differences in allometry between habitats has, to our knowledge, never been noted before; likely because only very few studies compare data across aquatic ecosystems. Considering that the trend was observed both among and within our taxonomic groupings (Table 3), variation in the general body shape of dominant taxa (copepods in marine; cladocerans in freshwaters) cannot explain this
density, a zooplankter may control its buoyancy with greater mass in other tissues as compared to zooplankton using other lipid types (Ackman, 1989; Brett et al., 2009). Although our dataset does indicate that several marine species may have higher proportions of lipids in their body (Table 1), we could not evaluate the potential effect biochemical composition on their body mass variation. However analogous adaptations have been found for fishes (e.g. darters), where the length of swim bladders (internal gas-filled organ for buoyancy control) appear to not only be related to fish body size, but also to the type of habitat and swimming behaviour (e.g. midwater versus benthic) (Evans and Page, 2003). Generally, marine fishes have relatively smaller swim bladders than do freshwater species, to counter positive buoyancy in salt water (Evans and Page, 2003). To our knowledge, no study has formally compared freshwater and marine zooplankton body tissues in terms of their density; however, intra-habitat data on gelatinous marine zooplankton suggests that length-standardized dry mass correlates positively with salinity, suggesting local hydration in buoyancy control (reviewed by Hirst and Lucas, 1998). Although this relationship between salinity and mass is only known for certain species (Lucas et al., 2011), these results imply that body dry mass may be significantly overestimated in some gelatinous forms due to environmental salts concentrated in dried
4.1.4 Ecological implications of relationships among physiological traits
It is now well-known in biology that virtually all metabolic processes scale with body mass to the 0.75 power, or -0.25 on a mass-specific basis (Kleiber, 1961; Peters, 1983; West et al., 1997; Gillooly et al., 2001; Brown et al., 2004; West and Brown, 2005). The metabolic theory of ecology (MTE), which rationalized this energetic invariance concept with respect to ambient temperature (a parameter that was standardized in our study), is particularly relevant when assessing ecological implications of organismal physiological traits. Equations 3.1 to 3.4 quantify crustacean zooplankton excretion and respiration rates, as well as the stoichiometry according to the mass dependency of those processes. A clear pattern emerged from our dataset, despite all the noise related to site and species variation: respiration and excretion rates followed mass-dependent scaling relationships in both major habitats, faithful to MTE. While the scaling for P excretion versus body mass was slightly under 0.75 (0.70), N excretion as well as freshwater and marine respiration mass-relationships were above the 0.75 scaling law predictions (values of 0.84, 0.82 and 0.90 respectively). These slopes are within the range of values found in other zooplankton data compilations (Wen and Peters, 1994; Ikeda et al., 2001). They, however, indicated a differential response in respiration, and P and N excretion as
may partly be due to noise in the data (perhaps especially for the relationship between mass and respiration with an R2 of only 0.54), scaling patterns are known to differ across species according to both the spectrum of body sizes considered in an analysis and phylogenetic history (i.e. which species included) (Frost, 1980; Glazier, 2005; 2006; Kiørboe and Hirst, 2014).
Although the limited number of observations for certain taxa prevented us from detecting significant differences in excretion among taxa or habitat, the trends drawn from our regression analysis suggested that marine copepods, freshwater copepods and cladocerans may have similar scaling for excretion, but potentially different intercept values (Figs 3a, b, d and e). The fact that freshwater copepods and cladocerans seemed to qualitatively differ in their excretion rates is in line with previous work on zooplankton stoichiometry and EST, according to their body requirements. However, only patterns for P excretion, where daphniids were found to recycle less P in contrast to copepods, were coherent with predictions from EST (Sterner and Elser, 2002). This aspect has considerable implications for ecosystem nutrient cycling; indeed, seasonal or inter-annual increases in Daphnia abundance have already been associated with severe P limitation of phytoplankton in freshwaters (Elser et al., 1988; Urabe et al., 1995) When comparing
substantially higher oxygen consumption by crustacean zooplankton biomass in freshwaters as compared to marine ecosystems (Figs 3c and f). Although literature data is limited for freshwater zooplankton respiration, this pattern has not yet been observed to our knowledge. While there is no comprehensive compilation of respiration rates for freshwater zooplankton comparable to those on marine species, Hernández-León and Ikeda (2005) tentatively made a comparison between habitats by predicting respiration rates in freshwater zooplankton across a suite of taxa (from rotatorians to dipterans) according to their mass, based on Ikeda’s (1985) empirical model for epipelagic marine zooplankton. As they could predict reasonably well respiration values for freshwater species using an equation derived from marine species, they concluded that zooplankton respiration did not differ consistently across habitats. However, when only looking at crustacean zooplankton species that Hernández-León and Ikeda included in their analysis (Fig. 5.1 from Respiration in Aquatic Ecosystems, 2005), every single species of this group had respiration values underestimated by the relationship based on marine species. This suggests that a differential response in respiration may occur in freshwater crustacean zooplankton, particularly when compared to marine copepods.