HAL Id: hal-01391095
https://hal.archives-ouvertes.fr/hal-01391095
Submitted on 29 Apr 2018
HAL is a multi-disciplinary open access archive for the deposit and dissemination of sci-entific research documents, whether they are pub-lished or not. The documents may come from teaching and research institutions in France or abroad, or from public or private research centers.
L’archive ouverte pluridisciplinaire HAL, est destinée au dépôt et à la diffusion de documents scientifiques de niveau recherche, publiés ou non, émanant des établissements d’enseignement et de recherche français ou étrangers, des laboratoires publics ou privés.
A mixed physical-phenomenological approach for the
Mullins effect
Grégory Chagnon, Gilles Marckmann, Erwan Verron, Laurent Gornet, Pierre
Charrier
To cite this version:
Grégory Chagnon, Gilles Marckmann, Erwan Verron, Laurent Gornet, Pierre Charrier. A mixed physical-phenomenological approach for the Mullins effect. Fourth European Conference on Consti-tutive Models or Rubber (ECCMR 2005), KTH, Jun 2005, Stockholm, Sweden. �hal-01391095�
1 INTRODUCTION
Rubberlike materials exhibit a very complex behav-ior with an ability to endure very large deformations. They present a time dependent behavior (hysteresis, relaxation) and others phenomenons like a large stress-softening after a first loading cycle. This last phenomenon is known as Mullins effect (Mullins, 1969).
This paper only focuses on the Mullins effect, all the others phenomenons present in rubber materials will not be taken into account. The behavior is then considered time-independent. It is assumed to be represented by the Figure 1 for a tensile cyclic test.
Figure 1. Static behavior of a hyperelastic elastomer enduring only stress-softening.
The virgin undamaged material is first stretched
as the extension ratio reaches I and the stress
fol-lows the path I. Then the unloading from I to 0
fol-lows the path I'. The second loading from 0 to II >I
first follows the path I' until =I then it follows the
path II. The second unloading from stretch ratio II
to 0 follows the path II' which is different than path I'. At a given stretch, the stress on II' is lower than the stress on I'. Repeating this process, the loading path corresponding to the increase of stretch from 0 to II is the path that joins II' and the part III of the
virgin curve. Finally, the corresponding unloading follows the path III'.
The aim of the paper is to propose a Mullins ef-fect modeling based on physical consideration and easily implementable in a finite element code. In a first part, a brief bibliography of Mullins effect mod-eling is proposed, the choice of the Marckmann et al. (2002) model is realized. In a second part, the model is studied and the finite element implementation problems are highlighted. An adaptation of the mod-eling is proposed thanks to relations between hypere-lastic energy density parameters.
2 MODELS FOR THE MULLINS EFFECT
Since the stress softening phenomenon has been ob-served, many models have been proposed; for a complete bibliography of the first models the reader can refer to Harwood et al. (1967) and Mullins (1969). The first approaches were physically moti-vated, on the one hand, the structure of the material was studied, i.e. the links between the
macromolecu-A mixed physical-phenomenological approach for the Mullins effect
G. Chagnon
Laboratoire 3S, Université Joseph Fourier - INPG, Domaine universitaire BP 53, 38041 Grenoble cedex 9, France.
G. Marckmann, E. Verron & L. Gornet
Ecole Centrale de Nantes - GeM, BP 92101, 44321 Nantes cedex 3, France
P. Charrier
Modyn Trelleborg, Zone ind. de Carquefou, BP 419, 44474 Carquefou Cedex, France
ABSTRACT: Elastomers present a stress softening phenomenon known as the Mullins effect. The main diffi-culty is to determine a model based on physical hypothesis with an analytical form usable in finite element codes. An attempt to reconcile the two approaches is presented. The alteration model proposed by Marckmann et al. (2002) is successful in the simulation of the stress softening phenomenon but has a complex analytical form because of the eight-chain model formulation. Thanks to the use of equivalences between different hy-perelastic energy densities, a new stress softening model is built thanks to the Gent hyhy-perelastic energy densi-ty.
lar chains and fillers. For example, Bueche (1960, 1961) developed a one-dimensional model by as-suming that the Mullins effect is due to the break-down of links between filler particles and chains, and that it only depends on the maximum stretch his-tory. For Dannenberg & Brennan (1966) and Dan-nenberg (1966), the macromolecular chains can slip or dissociate of the fillers. These approaches have been generalized to a three-dimensional formulation by Govindgee & Simo (1991). The problem of these approaches is that the Mullins effect occurs in un-filled materials, too. Later, Marckmann et al. (2002) proposed a global approach. The global evolution of the links in the material is studied without distin-guishing links breakage between chains, or between fillers and chains or chains rupture. This permits to propose a global three dimensional approach. Re-cently, Qi & Boyce (2004) distinguish the rubber matrix and fillers, considering that stress softening appears only in the rubber matrix. Based on the in-fluence of fillers on mechanical behavior, they pro-posed a new evolution law.
On the other hand, the material has been consid-ered composed of two parts, one soft and one hard. Then the stress softening is due to the transformation of the hard phase into soft phase after solicitation (Mullins & Tobin, 1957). This approach is used by Johnson & Beatty (1993) to propose an uniaxial modeling. Next, Beatty & Krishnaswamy (2000) and Zuñiga & Beatty (2002) proposed three-dimensional evolution laws of the stress softening.
An other kind of approaches exists based on the continuum damage mechanics. It was first intro-duced by Gurtin & Francis (1981) and generalized by DeSouza Neto et al. (1994); they proposed a damaged master curve that they adapt to the maxi-mum deformation of each second loading curve. Dif-ferent forms of damage evolution laws have been proposed (Simo, 1987; Miehe, 1995). Recently Chagnon et al. (2004) have synthesized the continu-um damage mechanics approach and proposed a damage evolution law.
Each model has its advantages and inconvenienc-es. The key point depends on what the model is used for; a discussion is proposed by Chagnon (2003). We focus on physical modeling, and choose to keep the most recent model proposed, i.e. the one proposed by Marckmann et al. (2002).
3 ALTERATION MODELS 3.1 Marckmann model formulation
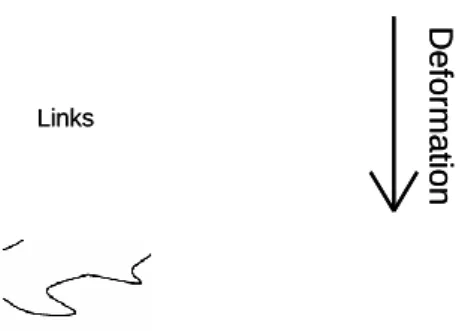
Marckmann et al. (2002) have studied the evolu-tion of the rubber network. When the material is stretched some links are broken, links between chains as well as links between chains and fillers as illustrated by Figure 2. Links D e form a tion Links D e form a tion
Figure 2. Evolution of the macromolecular network when sub-mitted to a deformation.
The evolution of the rubber network can be de-scribed thanks to the evolution of the characteristics of the macromolecular chains. In fact, after link rup-ture, chains become longer but their number de-creases. As a consequence, two working hypotheses are made; first, the number of chains by volume-unit is a decreasing function of the maximum defor-mation, second, the number of monomers by chains is an increasing function of the maximum defor-mation.
The constitutive law is built thanks to the use of the eight-chain model of Arruda & Boyce (1993) be-cause this hyperelastic energy density has only two material parameters which are the number of mono-mers by chains N and the density of chains by
vol-ume-unit Cr. The energy is written:
sinh ln . N N C W chain r (1) with
chain/ N
1 L and chain 21 22 23 (2)where L is the Langevin function. Marckmann et al.
make the eight-chain parameters dependant of the maximum deformation, to simulate material configu-ration evolution. They described the evolution laws thanks to exponential functions; a decreasing one for the number of chains per volume-unit and an in-creasing one for the number of monomers per chains:
1
0 exp r r r C C C (3)
1 0 exp N N N (4)where is the deformation measure. In the rest of
the paper, the first invariant I1 is chosen as it
repre-sents a global three-dimensional deformation meas-ure. It is important to verify that the number of ac-tive monomers in the material i.e. the product of the number of monomer by chains by the number of
of the deformation. Actually, the number of active monomers is decreasing as during the deformation process, hanging chains appear. An identification of the material parameters is realized on the carbon-black filled rubber studied by Chagnon et al. (2004), the stresses are normalized. The parameter values are given by Table 1.
Table 1. Values of the Marckmann model parameters for a car-bon black filled rubber.
Cr0 Cr1 N0 N1
0.0575 0.0282 4.85 0.0278
A simulation of the tensile test is realized and compared to experimental data on Figure 3.
0 0,2 0,4 0,6 0,8 1 1 2 3 4 5 6
Maximal principal stretch
Nominal
str
es
s
Figure 3. Simulation of the Marckmann model on tensile test () model (…) experimental data.
The model is very efficient to simulate the stress-softening phenomenon, as the first and second load-ing curves are well described. The slight stress de-crease at the end of the first loading curve is due to the limiting fit region. As a consequence, the model is only usable for deformations weaker that the one of the critical point.
The product CrN is easily expressed thanks to the
evolution laws:
1 1
0 0 exp r r rN C N N C C (5)As N1< Cr1 the number of active monomers in the
material is a decreasing function of the deformation. 3.2 Marckmann model limitations
Many hyperelastic energy densities have been used for many years, but few of them are really used for finite element simulations. For example in the Finite Element Code Abaqus©, few hyperelastic energy densities are implemented, we can quote: Rivlin se-ries, van der Waals model, Ogden model and the Ar-ruda-Boyce model. The last one is not implemented in its analytical form but in its invariant form i.e. fifth order series development:
3 3 3 33 ...
1 3 2 2 1 2 1 1 nk C I C I C I W (6)Actually, the analytical form is not easily usable in finite element codes because of its principal direc-tions formulation and of the Langevin function.
The differences between the two formulations are not important for small and medium deformation but are more penalizing for large deformation. Figure 4 presents the differences between the two
formula-tions for a tensile test (with Cr 1 and N 10). It
appears that the strain hardening phenomenon is quite different as in the first case it is represented by an asymptote and in the second case by a polynomial form. Moreover, one formulation limits the maxi-mum deformation while the other permits to reach any deformation. 0 50 100 150 200 1 2 3 4 5 6
Stretch in traction direction
Stre
ss
Figure 4. Difference between the analytical form () and the fifth order series development (--) of the Arruda and Boyce model for uniaxial tensile test.
The difference is not so important for hyperelastic calculus but for Mullins effect simulation, the key point is different. The Marckmann model is built on the position of the strain-hardening. The parameter evolution is directly relied to the asymptote position. As an example, a simulation of the stress-softening model is realized with the fifth and tenth series de-velopment and presented on Figure 5. The
coeffi-cients of the I1-series development are presented on
Table 2.
Table 2. Coefficients of the I1-series development of the
Arru-da-Boyce model. C1 1/2 C2 1/20N C3 11/1150N2 C4 19/7000N3 C5 519/673750N4 C6 59991/262762500N5 C7 105771/1532781250N6 C8 3123763/148898750000N7 C9 54543778207/8577405555468750N8 C10 74301767/38899798437500N9
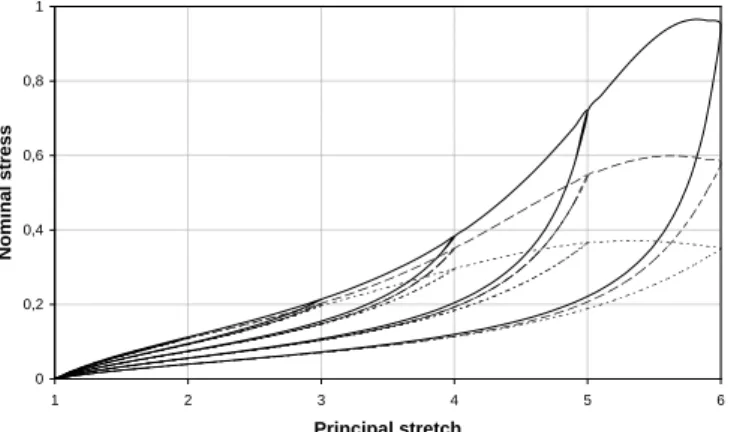
0 0,2 0,4 0,6 0,8 1 1 2 3 4 5 6 Principal stretch Nominal str es s
Figure 5. Simulations of the Marckmann model () analytical form, (…) fifth order development (--) tenth order develop-ment.
It appears that I1-series developments of the
mod-el are not able to correctly describe the stress soften-ing phenomenon. The exact formulation is the only one that permits a good correlation between the phe-nomenon and the modeling but is not easily imple-mentable in finite element codes. An other formula-tion is indispensable.
3.3 A new modeling 3.3.1 Formulation
To avoid this problem, a key is to use an other hy-perelastic energy density. The Mullins effect model-ing bemodel-ing based on physical hypothesis, it needs a hyperelastic energy density dependant on the density of chain by volume-unit and the average chain length. The key is to use the equivalence proposed by Boyce (1996) and extended by Chagnon et al. (2004) between the different hyperelastic energy densities, here the eight chain model (Arruda & Boyce, 1993) and the Gent (1996) model:
m m J I J E W ln 1 3 6 1 (7) It has been proved that the Gent model parameters can be related to the eight chains model parameters:
r C E 3 (8)
1
3 N Jm (9)That means that the Gent model parameters which are at first phenomenological have a physical mean-ing. E can be related to the density of chain by
vol-ume-unit and Jm can be related to the chain length.
As a consequence, the Mullins effect can physically be described by the Gent model. The evolutions of the density of chain by volume-unit and of chain length are respectively described by the evolution of
the parameters E and Jm. They have the same kind of
evolution as Cr and N:
1
0 exp 3Cr Cr E (10)
exp 1
3 0 1 N N Jm (11)The evolution functions are deduced from the Marckmann model parameters (Table 2). Figure 6 presents a comparison between the Marckmann and Gent altered models for the same parameter values. It appears that the Gent stress softening model is slightly stiffer at large deformations but has an iden-tical shape. 0 0,3 0,6 0,9 1,2 1 2 3 4 5 6
Maximal principal stretch
Nominal
str
es
s
Figure 6. Comparison of the Marckmann model () and the Gent altered model (--) for the same parameter values.
The differences between the two simulations are due to the fact that the equivalence between the two hyperelastic energy densities is based on the initial slope and the asymptote position. As an example, the
Arruda-Boyce model (with Cr=1 and N=10) and
Gent model (with E=3 and Jm=27) are plotted for a
tensile test in Figure 7. It appears that the curves are confounded at small deformations and are closed to near the asymptote. But in the medium strain region, there is a weak difference; the Gent model is slightly stiffer. This explains why the curve of the Gent stress softening formulation is above the curve of the Marckmann model in Figure 6.
0 20 40 60 80 100 1 2 3 4 5
Maximal principal stretch
Nominal
str
es
s
Figure 7. Comparison of the Gent (--) and the Arruda-Boyce () models for a tensile test simulation.
To correct this problem, it is possible to fit the Gent stress softening parameters on experimental da-ta. In this way the evolution of the Gent parameters are written as new exponential functions:
1
0 exp E E E (12)
1 0 exp m m m J J J (13)Table 3 presents the Gent stress softening model pa-rameter values fitted on experimental data. It is no-ticeable that the parameter values are different from the values of the Marckmann model parameters pre-sented in Table 1.
Table 3. Values of the Gent stress softening model parameters fitted on experimental data.
E0 E1 J
m0 Jm1
0.196 0.0384 12.3 0.0304
A simulation of the tensile test is presented on Figure 8. The forms of the model are in good corre-lation with experimental data. It can be noted that the form of the model simulations are similar to the Marckmann model simulations (of Figure 3). The two models have the same characteristics and pre-sent the same simulations.
0 0,2 0,4 0,6 0,8 1 1 2 3 4 5 6
Maximal principal stretch
Nominal
str
es
s
Figure 8. Simulation of the Gent stress softening model on ten-sile test. () model (…) experimental data.
Finally, it is important to study the evolution of the number of active monomers in the material. Thus the function E/3(Jm/3+1) (which corresponds to the
product CrN) is plotted according to the maximum
deformation on Figure 9. It permits to verify that this function is a decreasing function of the maximum deformation. This validates parameter values.
0,19 0,2 0,21 0,22 0,23 0,24 0,25 3 9 15 21 27 33 39 I1 CrN
Figure 9. Evolution of the number of active monomers in the material according to the maximum deformation.
As a conclusion, a new Mullins effect modeling based on physical considerations expressed thanks to the first strain invariant and with a simple mathemat-ical form is proposed.
3.3.2 Finite element simulations
The new stress softening modeling is implement-ed in Abaqus. As an example, a biaxial test is real-ized, the structure of the Figure 10 is considered.
1 2
1 2
Figure 10. Biaxial test specimen
A quarter of the specimen is modeled and meshed (cf. Figure 11). Two simulations are realized, the first consists in stretching the specimen in the two directions consecutively (one first the other later). The second simulation consists in stretching the specimen in the two directions at the same time. The deformation criterion (i.e. the maximum of the first strain invariant in the history) is presented on Figure 12.
Figure 11. Mesh of a quarter of the biaxial test specimen.
(a) (b)
(a) (b)
Figure 12. Evaluation of the maximum of the first strain invari-ant for the biaxial sample specimen (a) stretch in one direction and later in the other (b) stretch in the two directions at the same time.
It appears that the deformation criterion is differ-ent in the two simulations, i.e. the stress softening.
That emphasizes the importance of the Mullins ef-fect in structure design. Moreover, the new stress-softening modeling proves its finite element calculus efficiency (others calculus has been realized but are not presented in the paper).
4 CONCLUSION
This study uses the equivalence between hyperelastic energy densities to build a stress softening modeling that can describe correctly the Mullins effect (i.e. the difference between the first loading curve and the second loading curves) with an analytical form easily implementable in finite element codes.
A key point of this modeling is that it is physical-ly motivated but written thanks to a phenomenologi-cal model. Nevertheless, it is better to identify di-rectly the parameters model instead of using the Marckmann et al. parameter values because of the slight difference between the Arruda-Boyce and Gent models for medium deformations.
Finally the new model permits to have a good correlation with experimental data, and is easy to use in a finite element code.
REFERENCES
Arruda, E. M. & Boyce, M.C. 1993. A three dimensional con-stitutive model for the large stretch behavior of rubber elas-tic materials. J. Mech. Phys. Solids 41, 389-412.
Beatty, M.F. & Krishnaswamy, S. 2000. A theory of stress-softening in incompressible isotropic materials. J. Mech.
Phys. Solids 48, 1931-1965.
Boyce, E.M. 1996. Direct comparison of the Gent and the Ar-ruda-Boyce constitutive models of rubber elasticity. Rubber
Chem. Technol. 69, 781-785.
Bueche, F. 1960. Molecular basis for the Mullins effect. J.
Appl. Polym. Sci. 3, 107-114.
Bueche, F. 1961. Mullins effect and rubber filler interaction. J.
Appl. Polym. Sci. 5, 271-281.
Chagnon, G. Marckmann, G. & Verron, E. 2004. A comparison of the physical model of Arruda-Boyce with the empirical Hart-Smith model and the Gent model. Rubber Chem.
Technol. 77, 724-735.
Chagnon, G. Verron, E. Gornet, L. Marckmann, G. & Charrier, P. 2004. On the relevance of continuum damage mechanics as applied to the Mullins. J. Mech. Phys. Solids 52, 1627-1650.
Chagnon, G. Verron, E. Marckmann, G. Gornet, L. & Charrier, P. 2003. Comparison of recent models for the Mullins ef-fect: formulation and finite element implementation,
Consti-tutive Models for Rubber III, J.J.C. Busfield and A. H.
Muhr eds, 245-250.
Dannenberg E.M. 1966. Trans. Inst. Rubber Ind. 42, 26. Dannenberg E.M. & Brennan J.J. 1966. Strain energy as a
cri-terion for stress softening in carbon-black-filled vulcaniza-tes. Rubber Chem. Technol. 39, 597-608.
De Souza Neto, E.A Djordje Peric & Owen, D.R.J. 1994. A phenomenological three dimensional rate independent con-tinuum damage model for highly filled polymers: formula-tion and computaformula-tional aspects. J. Mech. Phys. Solids. 42, 1533-1550.
Gent A.N. 1996. A new constitutive relation for rubber. Rubber
Chem. Technol. 69, 59-61.
Govindjee S. & Simo J.C. 1991. A micro-mechanically contin-uum damage model for carbon black filled rubbers incorpo-rating Mullins's effect. J. Mech. Phys. Solids 39, 87-112. Gurtin, M.E. & Francis, E.C. 1981. Simple rate-independent
model for damage. J. Spacecraft. 18, 285-286.
Harwood, J.A.C. Mullins, L. & Payne, A. R. 1967. Stress sof-tening in rubbers - A review. Journal of the IRI 1, 17-27. Johnson, M. A. & Beatty, M. F. 1993. The Mullins effect in
uniaxial extension and its influence on transverse vibration of rubber string. Continuum Mech. Therm. 5, 83-115. Marckmann, G. Verron, E. Gornet, L. Chagnon, G. Charrier, P.
& Fort, P. 2002. A theory of network alteration for the Mullins effect. J. Mech. Phys. Solids. 50, 2011-2028. Miehe, C. 1995. Discontinuous and continuous damage
evolu-tion in Ogden type large strain elastic materials. Eur. J.
Mech., A/Solids 14, 697-720.
Mullins, L. 1969. Softening of rubber by deformation. Rubber
Chem. Technol. 42, 339-362.
Mullins, L. & Tobin, N. R. 1957. Theoretical model for the elastic behavior of filler-reinforced vulcanized rubbers.
Rubber Chem. Technol. 30, 551-571.
Qi H.J. & Boyce M.C. 2004. Constitutive model for stretch-induced softening of the stress-stretch behavior of elasto-meric materials. J. Mech. Phys. Solids. 52, 2187-2205. Simo, J.C. 1987. On a fully three-dimensional finite-strain
vis-coelastic damage model: formulation and computational as-pects. Comp. Meth. Appl. Mech. Engng. 60, 153-173. Zuñiga, A.E. & Beatty, M.F. 2002. A new phenomenological
model for stress-softening in elastomers. Z. Angew. Math.